7. genetics, pops, ecosystems
1/121
Earn XP
Description and Tags
ADD HARDY WEINBERG
Name | Mastery | Learn | Test | Matching | Spaced | Call with Kai |
|---|
No analytics yet
Send a link to your students to track their progress
122 Terms
give 2 biotic factors which may affect pop size:
competition
predation
give and define the 2 types of competition:
interspecific competition - competition for resources between different species
intraspecific competition - competition for resources within the same species
give a key difference between interspecific and intraspecific competition:
intraspecific competition also involves competition for a mate
what effect does increasing population density have on competition?
increase in pop density → increase in competition intensity
so lower birth rate
what is outcompetition?
when one species/organism is more well-adapted to the environment than another
what is predation?
when an organism (predator) kills and eats another (prey)
describe a typical predator-prey graph:
size of predator and prey pop both fluctuate
there will always be more prey than predators
the size of the prey population will always change before the predator population - lag time
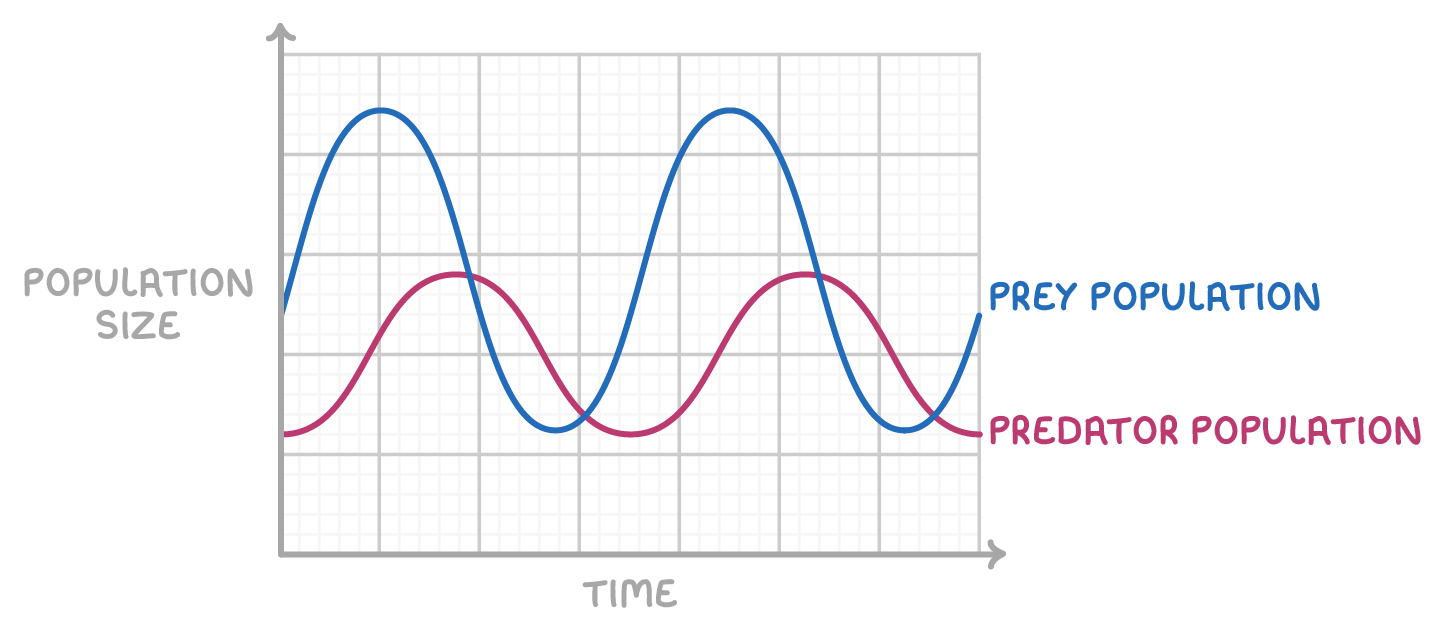
explain the shape of the predator-prey graph:
increase in prey pop → more food for predators → increase in predator pop
→ more predation on prey → decrease in prey pop
→ increases competition among predators for food → decrease in predator pop
→ increase in prey pop as more successful reproduction

what is an abiotic factor?
non living conditions of an ecosystem
what is a biotic factor?
impact of the interactions between organisms
give 3 abiotic factors which affect pop size:
pH
availability of water
temp
explain how pH affects pop size:
a change in pH past the optimum temp may denature the enzymes/transport proteins
this causes the movement of substances to decrease
explain how availability of water affects pop size in plants:
low availability of water would decrease the rate of transpiration and photosynthesis as less photolysis occurs
so less glucose produced, decreasing growth
explain how availability of water affects pop size in animals:
explain how temperature may affect pop size:
if temperature increases past the optimum, enzymes/transport proteins may denature
decreasing movement of proteins
give 2 biotic factors that may affect pop size:
competition - interspecific and intraspecific competition
predation
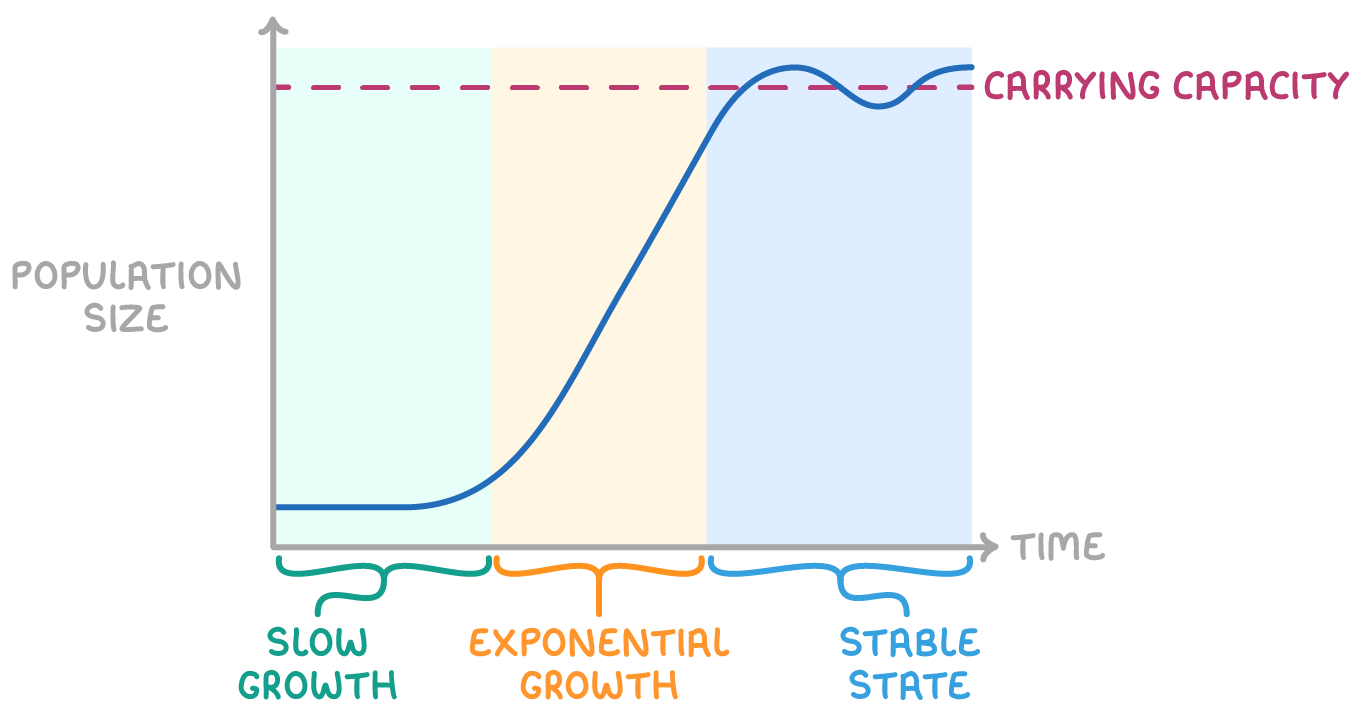
what is the carrying capacity of a pop?
the maximum pop size it can sustainably support

what is an ecosystem?
a community and the non living components of its environment
what is a population?
a group of individuals of the same species in a habitat
what is a habitat?
the physical location where an organism lives
what is a community?
populations of diff species in a habitat
what is an ecosystem?
a community and the abiotic conditions in its habitat
what does it mean for an ecosystem to be a dynamic system?
constantly changing due to continuous interaction between biotic and abiotic factors
what is a niche?
the exact resources/conditions an organism needs to survive
governed by adaptation to both abiotic and biotic conditions
state the competitive exclusion principle:
2 species cannot occupy exactly the same niche
what is biodiversity?
the range/no. of diff species in a habitat
what is the carrying capacity?
the maximum stable pop size of a species an ecosystem can support

describe and explain the shape of a pop growth curve:
initially, pop increases slowly, as birth rate exceeds the death rate
pop then expands exponentially when there are no sig restrictions on growth
plateaus - carrying capacity is reached due to biotic and abiotic factors
give 2 factors which each contribute +vely/-vely to a population:
+vely:
births
immigration
-vely:
emigration
deaths
give the eqn to calculate the no. of cells on agar at a certain time:
cells at time t = initial cells x 2(t/generation time)
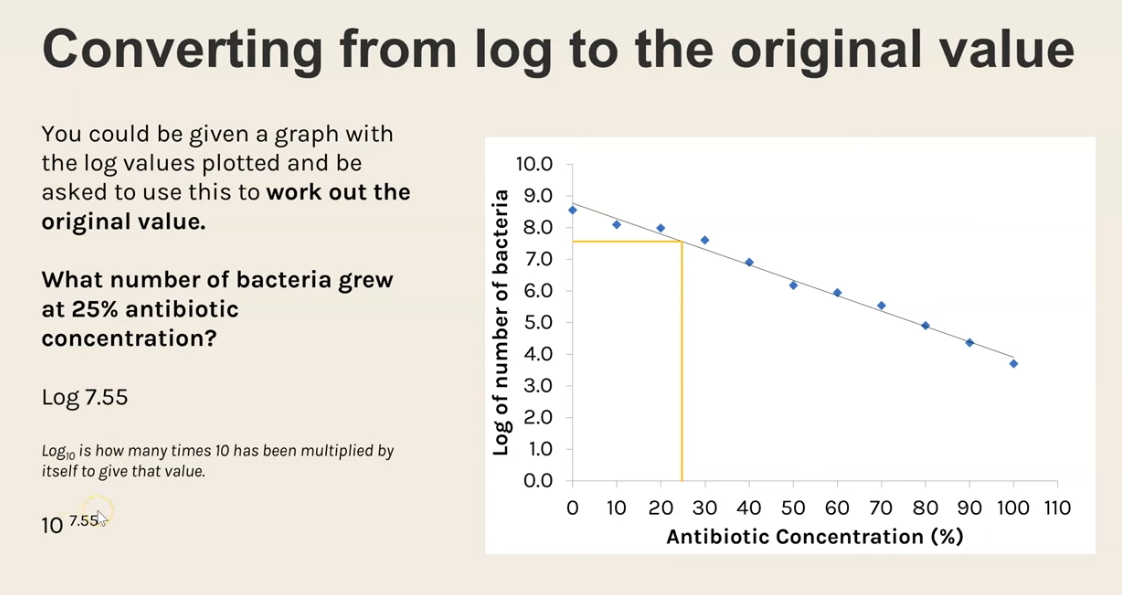
give an advantage of using log scales:
to compare values with a large range of values
allows more accurate reading off a graph
how do you convert from a log value to the normal value?
10whatever no you put in the brackets of log
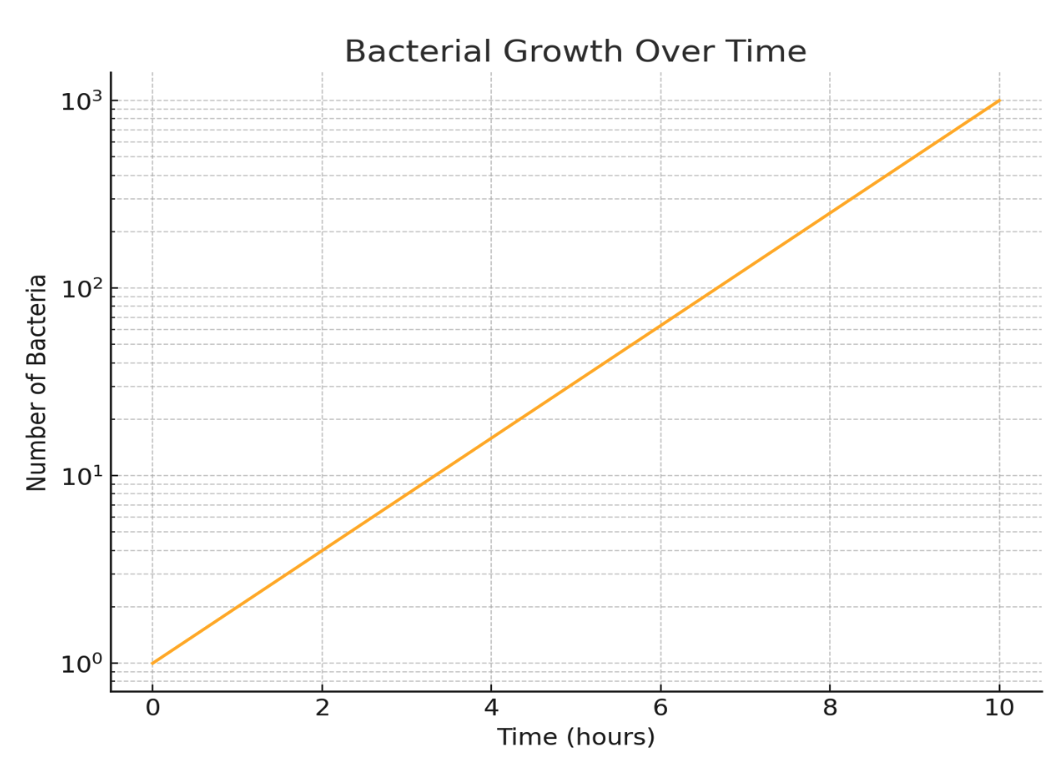
how do you read a log scale?
one axis increases in a linear way
the other axis has unevenly distributed lines - each represent a power of 10 (e.g. 1 ×101, 1× 10² etc.)
(each marked increment on scale overlaps)
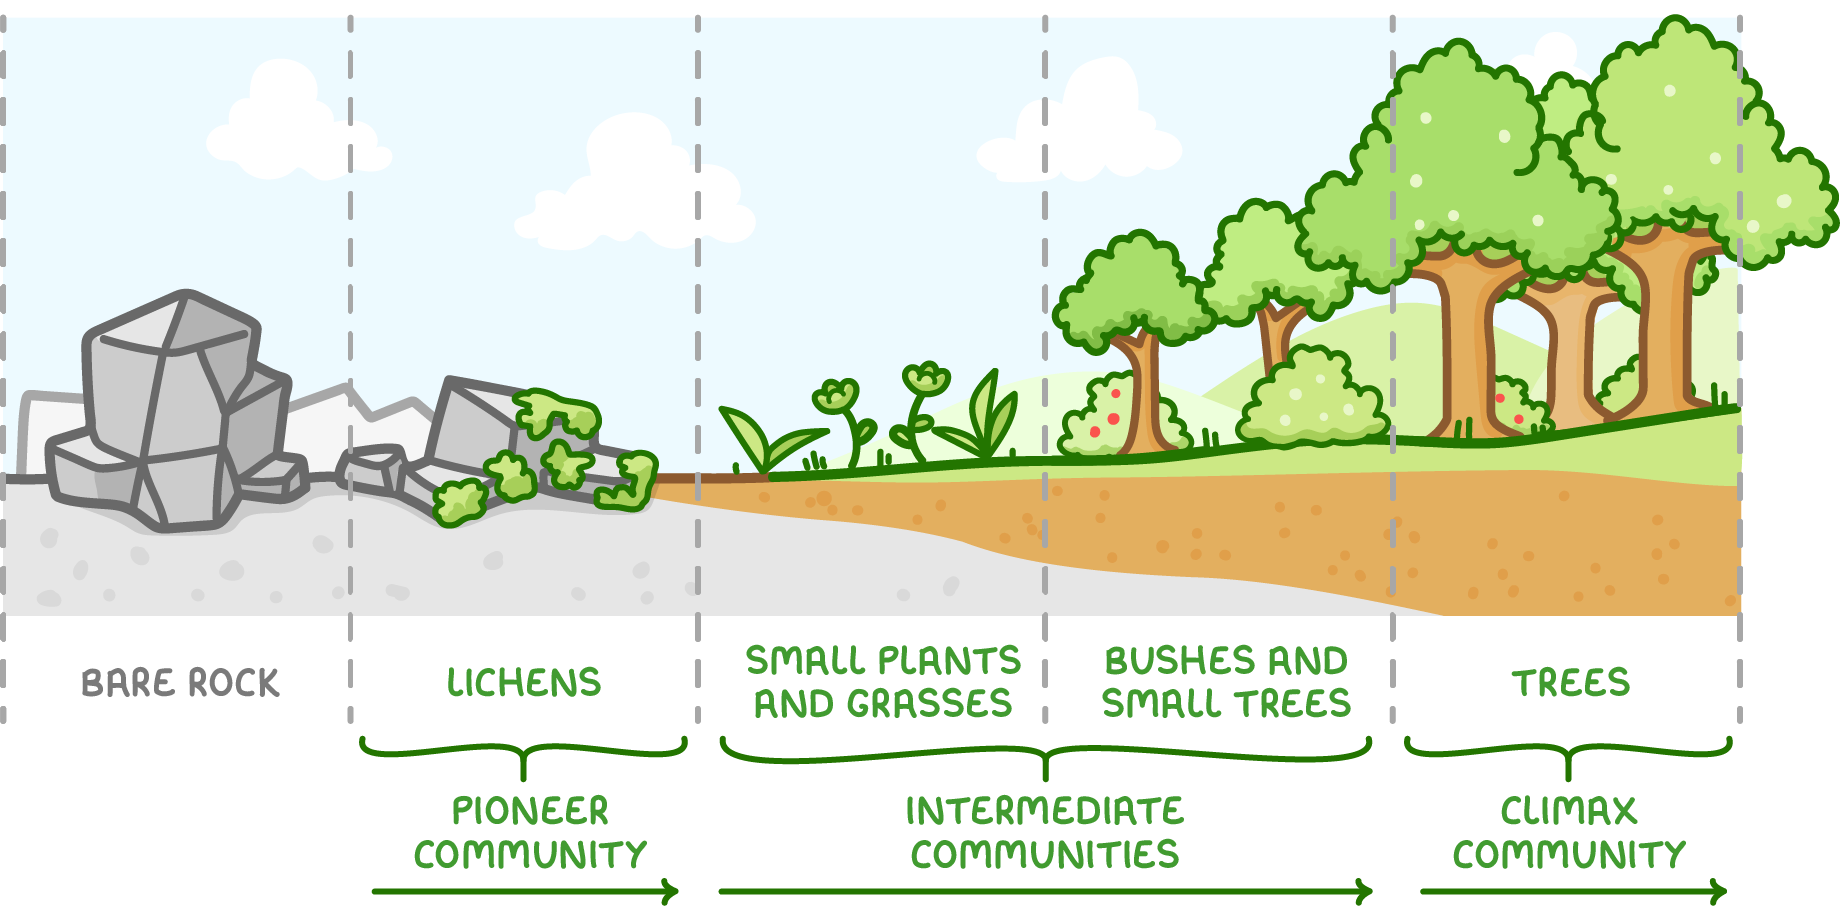
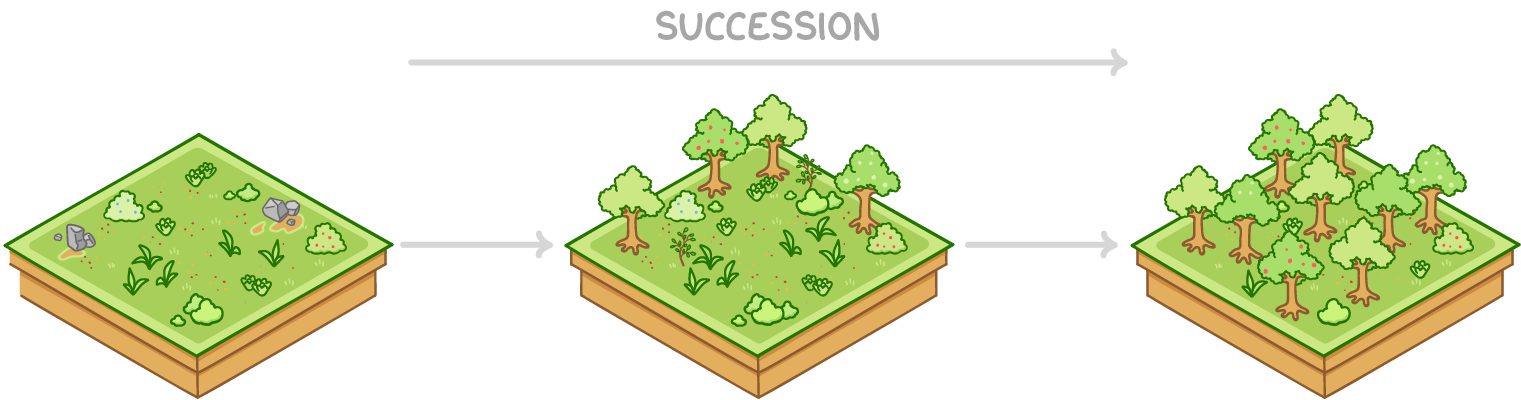
describe and explain how succession occurs:
colonisation by pioneer species
pioneer species change environment, making it less hostile/more suitable for other species
this causes an increase in biodiversity
allowing the climax community to be reached
what is succession? name the two types of succession:
the process by which ecosystems change over time due to changes in the environment:
primary succession
secondary succession
what is primary succession?
succession occurring on newly formed or exposed land without soil or organic material
what is secondary succession?
succession in areas where an existing community has been removed, leaving soil intact but with no plant or animal species
how can we use succession for conservation?
preventing succession by preserving an ecosystem in its current stage of succession
e.g. mowing the lawn to prevent the growth of shrubs and trees
why is conservation important?
maintains biodiversity
e.g. moorland is preserved through grazing to prevent the loss of the plants and animals living there
this therefore keeps the ecosystem intact through preventing succession
give 2 features of a climax community:
same species present/stable community/pop over a long period of time
abiotic factors constant over time
what is genetic drift?
a mechanism of evolution in which the allele freq of a pop changes over generations due to chance (i.e. surviving pop not better adapted)
which pops does genetic drift occur in?
can occur in all pops of infinite size, but effects strongest in small pops
what may genetic drift result in?
may result in the loss of some alleles
and the fixation (rise to 100%) of other alleles
what are the 2 types of genetic drift?
bottleneck effect
founder effect
what is the bottleneck effect?
size of pop is severly reduced by events like natural disasters i.e. change in allele freq not because of a selection pressure but instead a natural catastrophe
often most ind killed and small, random assortment of survivors remain
allele freq diff from those of pop prior and some alleles may be missing entirely
smaller pop will be more susceptible to the effects of genetic drift for generations to come
what is the founder effect?
small group of ind breaks off from a larger pop to establish a colony
new colony is isolated from the original pop and founding ind may not represent full genetic diversity of original pop
alleles in founding pop may be present at diff freq than original pop and some alleles may be missing altogether
why may individuals w/in a pop show wide range of variation in phenotype?
genetic factors
environmental factors
give the 5 sources of genetic variation:
mutation
crossing over
independent segregation
random fertilisation
random mating
give and describe the 2 the types of genetic variation - state which type the environment has a large effect on:
variation due to multiple genes (environment has large effect):
may be due to multiple genes (polygenes)
e.g. human height
freq in pop represented by freq graph
variation due to one gene (environment has little effect):
due to one gene
e.g. human blood group
freq in pop represented by bar chart
what is evolution?
change in allele freq in a pop
describe the process of evolution by natural selection in terms of allele freq:
there is genetic variation w/in the gene pool due to mutation
selection pressures - variation means that some ind may have an advantageous alleles whereas others do not
those w/ the advantageous allele are more likely to survive and produce, passing on the advantageous allele to their offspring
over time the freq of the the advantageous allele that leads to reproductive advantage in the gene pool increases
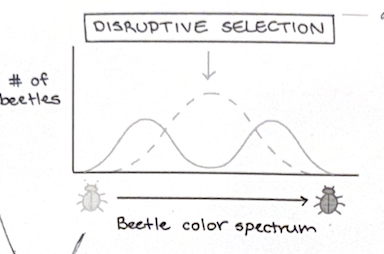
what are the 3 types of selection?
disruptive selection
stabilising selection
directional selection
what is disruptive selection? draw the graph:
selects for 2 extremes
(mode stays the same, range increases, SD increases)
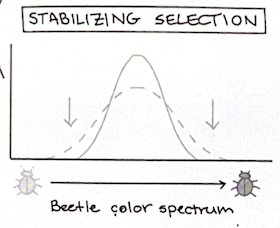
what is stabilising selection? draw the graph:
the average phenotype is selected for
(mode stays the same, range decreases, SD decreases)
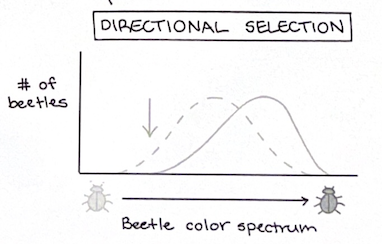
what is directional selection? draw the graph:
one extreme is selected for
(mode, range and SD all remain the same)
what is speciation?
the evolution of new species from existing ones
give 4 reasons why 2 groups may become reproductively isolated from one another:
2 pops become geographically separated (leading to allopatric speciation)
diff breeding seasons
some active at night, some active in the day
some active in the summer, some active in the winter
sexual selection i.e. preference based on looks/courtship behaviour
describe sympatric speciation:
not geographically isolated/in the same habitat
variation due to mutation
reproductive isolation/gene pools kept separate
selection/survival linked to (named) traits - adapted organisms breed
change in genetic constitution of pops/gene pools/allele freq → disruptive selection
eventually diff species cannot interbreed to produce fertile offspring - separate gene pools
describe allopatric speciation:
geographical isolation of pops
variation present in pops due to mutation
diff environmental conditions/diff selection pressures/diff phenotypes selected
selection/survival linked to (named) traits - adapted organisms breed
change in genetic constitution of pops/gene pools/allele freq → disruptive selection
eventually diff species cannot interbreed to produce fertile offspring - separate gene pools
what is a gene pool?
all the alleles in a pop
how can scientists use DNA to determine whether or not individuals are of the same species?
compare DNA base sequence
diff in diff species
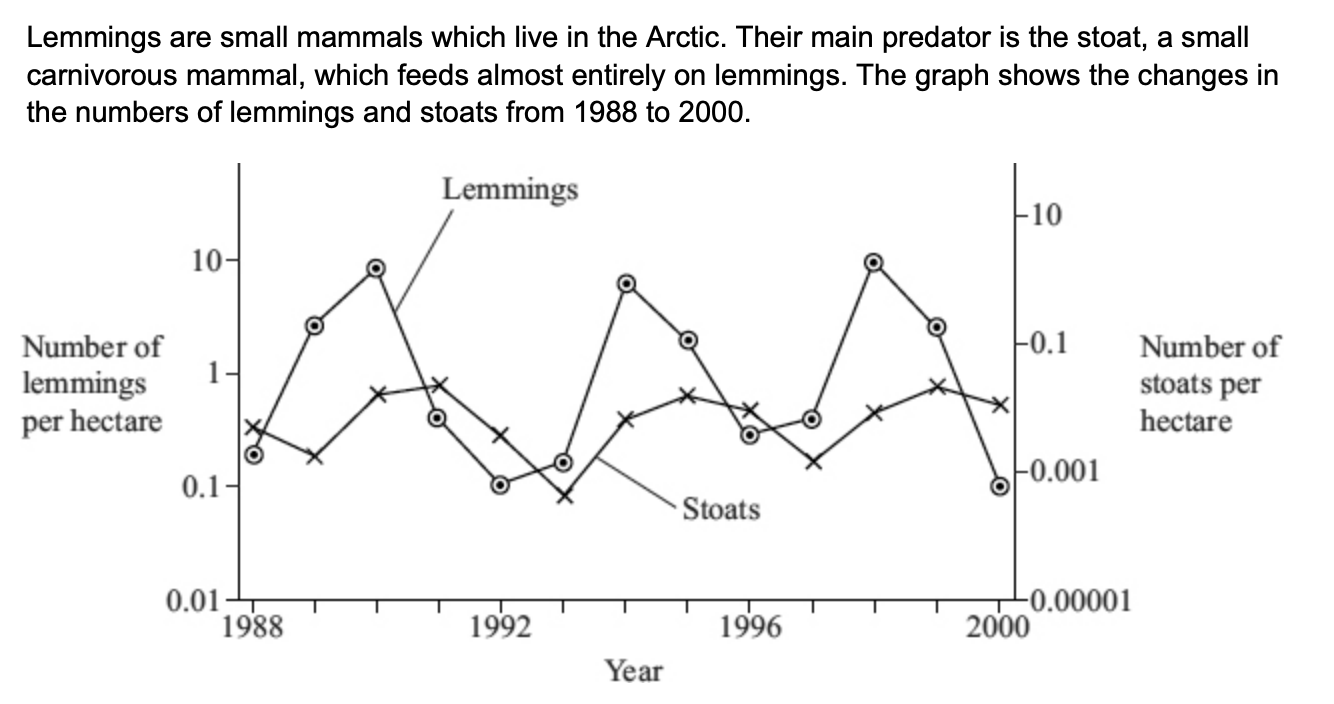
describe and explain the changes which occur in the lemming and stoat pops (6):
4 year cycles
predator/stoat peaks after prey/lemming
lemmings increase due to low numbers of stoats/available food
more food for stoats so nos increase
increased predation reduces no. of lemmings
no. of stoats decreases due to lack of food/starvation
lemmings often live in isolated populations. from time to time some lemmings move and join other populations - explain how this movement is important in maintaining genetic variability in lemming pops which have large fluctuations in size (2)
small pops have fewer diff alleles/smaller gene pool/lower genetic variability
migrants bring in new alleles/increase gene pool
many species of cichlids are similar in size and apart from their colour, appearance - suggest how the variety of colour patterns displayed by these cichlids may help to maintain the fish as separate species (2)
selection of mate dependent on colour pattern
prevents interbreeding/keeps gene pools separate
what is codominance?
2 different alleles are =lly expressed in an organism’s phenotype
for codominant alleles, when the genotype is heterozygous, what phenotype is expressed?
mixture of both alleles
(e.g. CR = red, CW = white, CRCW = pink)
what is the notation used in codominance?
uppercase letter for gene (e.g. C for colour)
superscript uppercase letters for alleles (e.g. CR = red, CW = white)
what does it mean for two genes to be linked?
genes on the same autosome
give the steps needed to determine if genes are linked or not:
perform a test cross: AaBb x aabb
assume no linkage - gametes = AB, Ab, aB, ab, ab
expected ratio = 1:1:1:1 (AaBb, Aabb, aaBb, aabb)
assume linkage and no crossing over - gametes = AB, ab
expected ratio = 1:1 (AaBb, aabb)
for a linked test cross, why may the actual genotype ratios differ from the expected ratios?
crossing over during meiosis may produce new allele combinations - recombinant offspring - and break the linkage
i.e. mainly AaBb and aabb but fewer aaBb and Aabb
what determines how likely linked genes will be separated during crossing over?
how close together they are on a chromosome
the closer the genes, the more likely they are to be inherited together
what statistical test could you use to compare the goodness of fit of observed phenotypic ratios w/ expected ratios and why?
Chi-squared test: use of categorical data
suggest 2 reasons why observed phenotypic ratios obtained in offspring may not be the same as expected ratios:
autosomal linkage
small sample size
epistasis
lethal genotypes
what is epistasis?
when one gene prevents the expression of another gene
what is the epistatic gene?
the gene responsible for suppressing another gene - the hypostatic gene
what is recessive epistasis?
epistasis where the epistatic gene must be homozygous recessive to prevent the expression of the other gene
what is dominant epistasis?
epistasis which requires at least one dominant allele to prevent the expression of the other gene
give the expected phenotypic ratio for a double heterozygous cross for recessive epistasis:
9:3:4
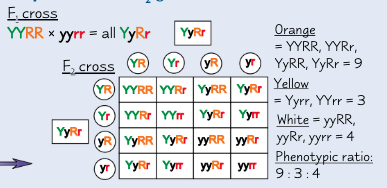
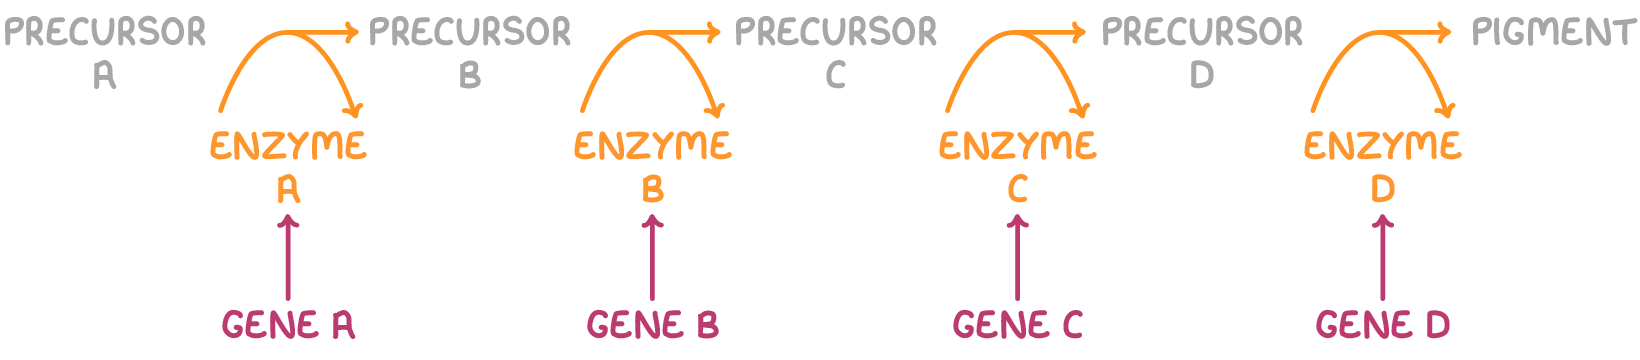
explain how epistasis could be applied to biochemical pathways
if any one of enzyme genes is not expressed - step in pathway is disrupted
so prevents production of intermediate substrate needed for the next enzyme in the sequence
∴ early blocked step masks the activity of genes further down in the pathway
give the expected ratio for a double heterozygous cross for dominant epistasis:
12:3:1
what is the genotype?
the genetic constitution of an organism
what is the phenotype?
the expression of the genotype and its interaction w/ the environment
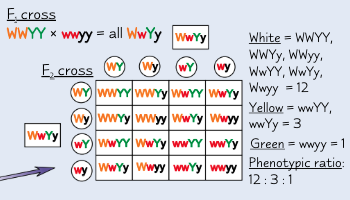
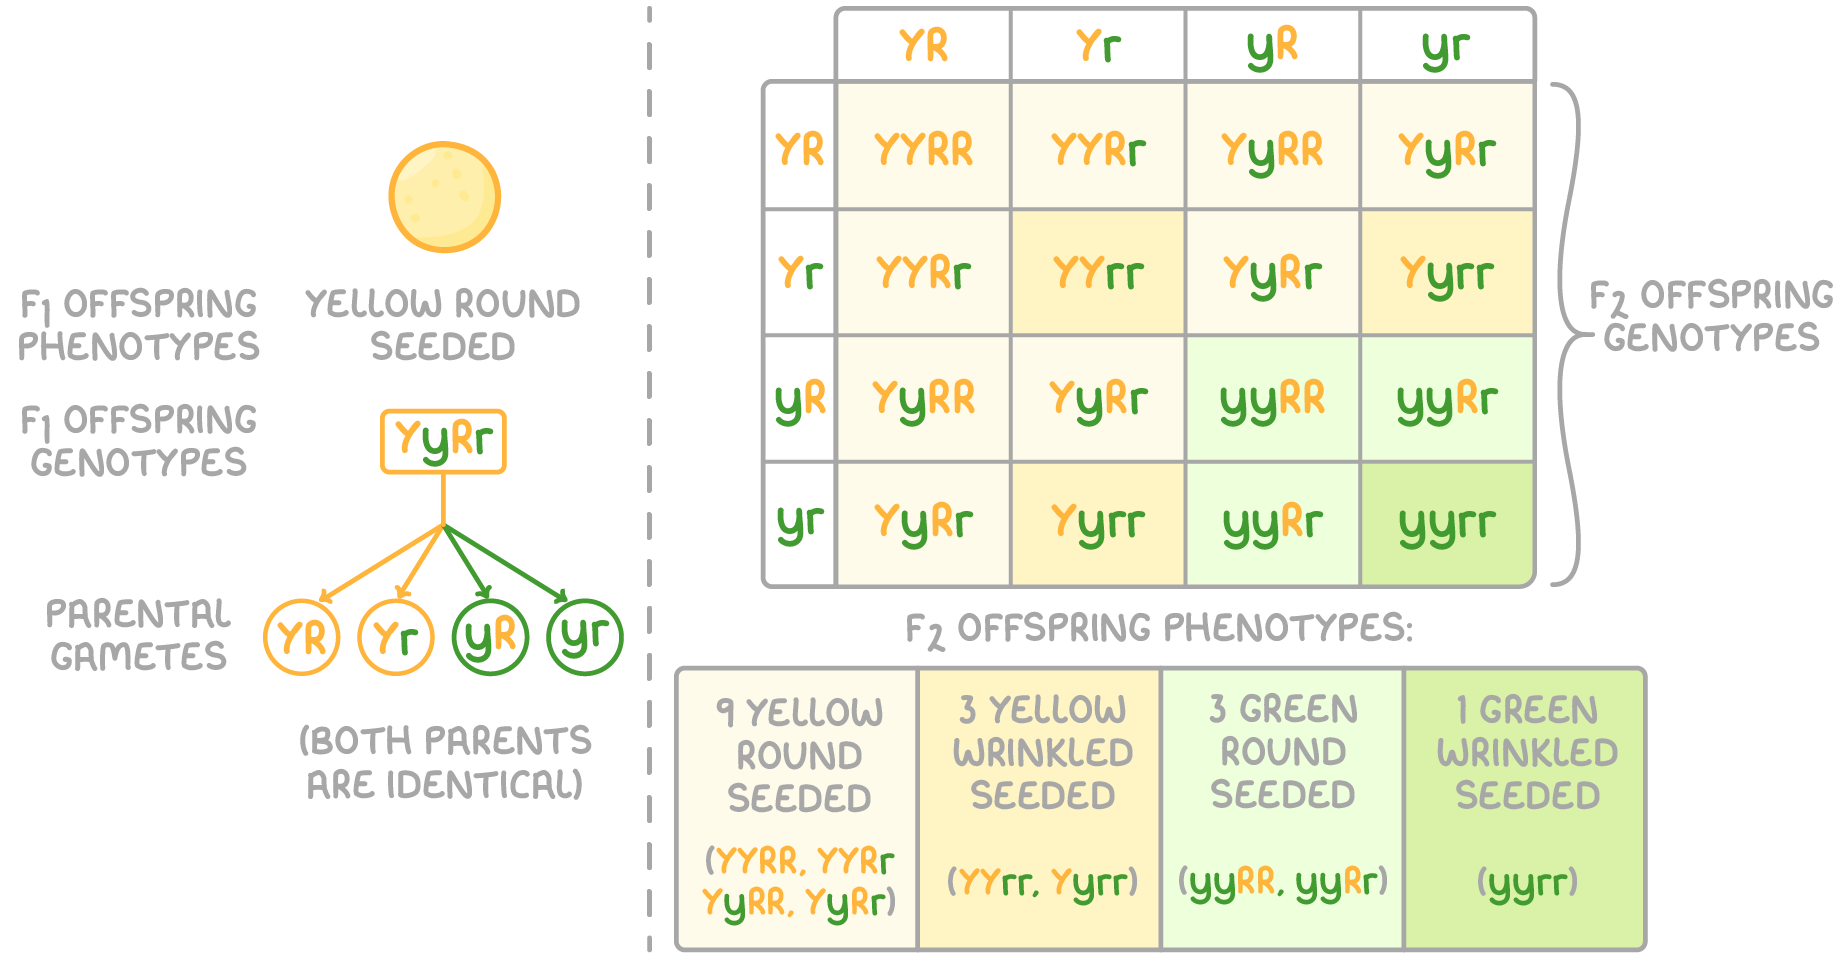
what is dihybrid inheritance?
inheritance involving 2 diff genes
what is the predicted ratio for a double heterozygous dihybrid cross?
9:3:3:1
what are autosomes?
all chromosomes that do not determine sex and instead regulate somatic characteristics of the body
what are sex chromosomes?
chromosomes which determine an organism’s sex by regulating sex linked traits
why are many sex-linked genetic disorders more likely to affect males than females?
sex linked alleles carried on X chromosome and are usually recessive
this means that males only need one allele for the trait to be expressed (as men have XY chromosomes)
females need 2 recessive alleles for the trait to be expressed (females have XX chromosomes)
give the 2 main ways of investigating populations:
using quadrats - random/transects
mark-release-recapture
summarise the process of mark-release-recapature to estimate a total pop:
capture/collect sample, mark and release
ensure marking is non harmful/does not affect survival (i.e. is non toxic)
allow sufficient time for organisms to randomly/evenly distribute before collecting a second sample
pop = no. in first sample x no. in second sample / no. of marked fish in second sample
when should the mark-release-recapture method be used?
when sampling motile organisms
give 5 assumptions that the mark-release-recapture method relies on?
proportion of marked : unmarked individuals in 2nd sample = proportion of marked : unmarked individuals in whole pop
marked individuals distribute evenly among rest of pop
pop remains constant w/o significant immigration/emigration/births/deaths
marks are non-toxic, permanent and don’t increase predation rates or change behaviour
pop has a definite boundary (i.e. confined to a set area)
give the formula for the mark-release-recapture method and state what each of the symbols mean:
M1 / N = M2 / N2 :
M1 = no, of ind marked on first day
N = total ind in pop
M2 = no. of marked ind found on second day
N2 = total no. of ind. found on second day (marked + unmarked)
why might mark-release-recapture produce unreliable results in large areas?
less chance of recapturing organisms
organisms less likely to distribute randomly/evenly
describe a method to determine the effect of a named environmental factor (sun/shade) on the distribution of a given species:
use a grid/divide sunny area into squares/coordinates
use a random number generator to generate random coordinates
count the number/frequency in a quadrat
take a large sample
calculate the mean no. per quadrat
multiply mean no. of plants per m2 by area of field
repeat for shady area
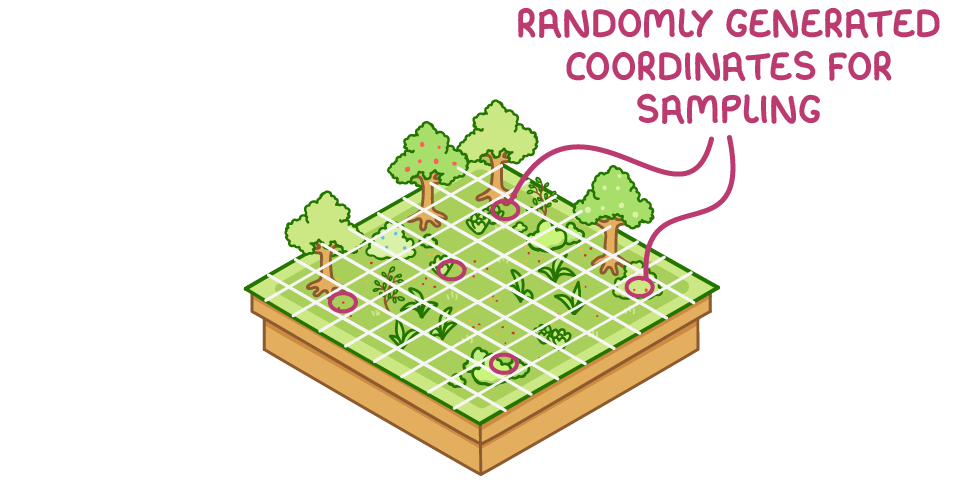
describe a method to determine the mean % cover of a given species:
use a grid/divide area into squares/coordinates
use a random number generator to generate random coordinates
count the number/frequency in a quadrat
take a large sample
divide total % by no. of quadrats

how can we determine a large enough sample size?
use a running mean - when the running mean becomes constant, the sample is sufficiently large
(if asked to estimate a number, 20+)
when should you use a quadrat?
for plants
for organisms that don’t move around very much
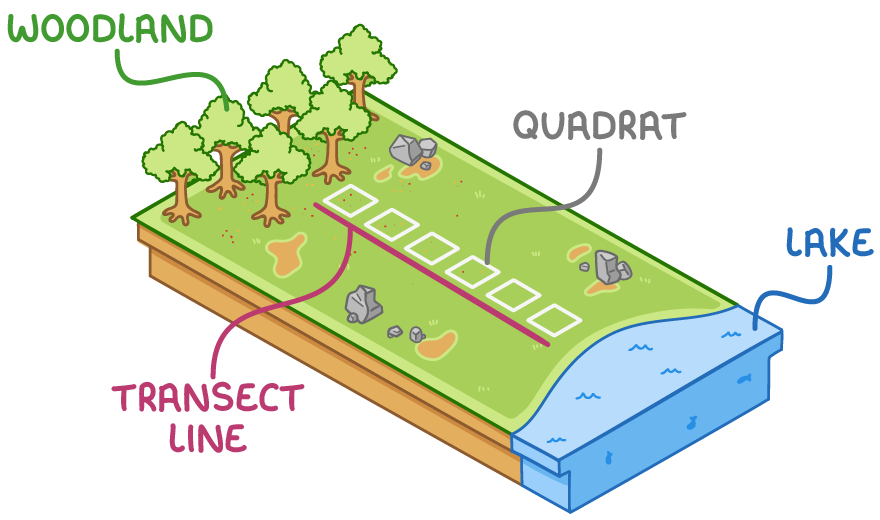
what is a transect? when should it be used?
systematic (non-random) sampling technique - different areas in a habitat are sampled at regular intervals (e.g. every nth interval
allows you to determine how the distribution of a species changes across different areas w/in a habitat e.g. from a woodland to a lake
what statistical test should be used when using quadrats and why?
t test - measures diff. between means
what is the typical p value used? what does this mean?
p = 0.05
there is a 5% probability that the results of a study are due to random chance