Statistics in Psychology Computations Final Exam Review
1/79
Earn XP
Description and Tags
Recommendation: when learning the cards, do fill-in-the-blank or flashcard. (Problems 1-51 go over chapters 1-8.)
Name | Mastery | Learn | Test | Matching | Spaced | Call with Kai |
|---|
No analytics yet
Send a link to your students to track their progress
80 Terms
16
What is the value of ΣX for the scores 7, 3, 6?
10
For the following scores, find the value of the sum of X, ΣX.

55
What is the value of ΣX2 for the scores 3, 3, 6, 1?
33
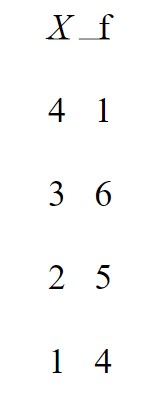
For the following scores, find the value of the sum of X squared, ΣX2.

121
For the following scores, find the value of the sum of X, squared, (ΣX)2.

22
For the following scores, find the value of the sum of X + 1, Σ(X+1).

36
For the data in the following table, what is the value of ΣX?
51
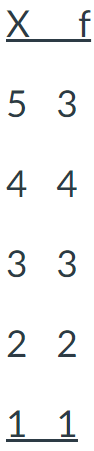
For the frequency distribution table below, please find the sum of X, or ΣX.
9
For the following frequency distribution of exam scores, how many students had scores lower than X = 85?
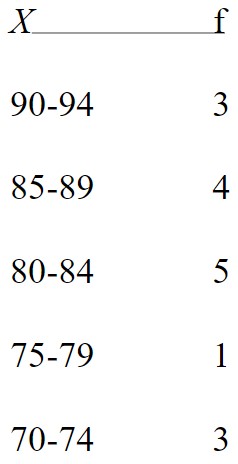
6
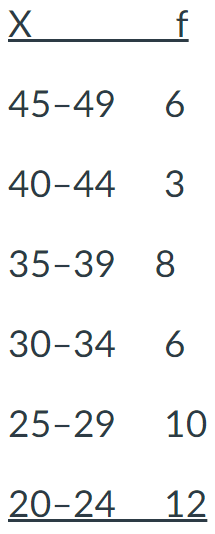
For the grouped frequency graph below, how many people have scores between 30-34?
Positively Skewed
The a graph of a population’s yearly income is presented to a mayor of a city. The graph shows that most of the population makes a lower income while a very few make a very high income. What is the most likely shape for the distribution of the population’s yearly income?
Negatively Skewed
What is the shape of the distribution for the following set of data?
20
For the following frequency distribution of quiz scores, how many individuals took the
quiz (n)?
13
For the frequency distribution table below, please find the number of scores in the sample, or n.
6
A population of N = 6 scores has ΣX = 36. What is the population mean?
5
For the following scores in this sample, what is the mean (M)?
(Scroll down on image for full table.)

3
One sample with n = 3 scores has a mean of ΣX = 14, and a second sample with n = 4 scores has a mean of ΣX = 7.
If the two samples are combined, what is the weighted mean for the two sets of scores?
3
For the following two sets of sample scores, what is the weighted mean?
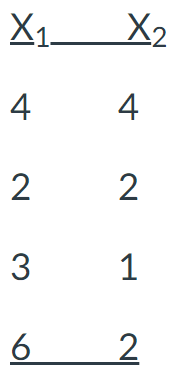
14
What is the value of the median for the following set of scores?
Scores: 1, 3, 4, 6, 8, 14, 15, 23, 25, 26, 30
6.5
For the following sample scores, what is the median?

2
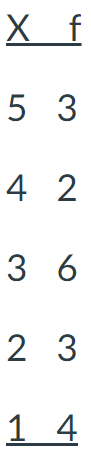
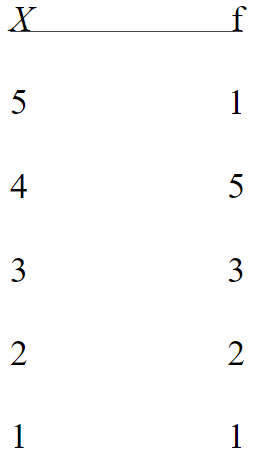
What is the mode for the population of scores shown in the frequency distribution table?
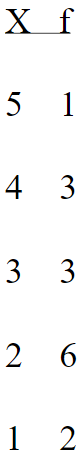
4
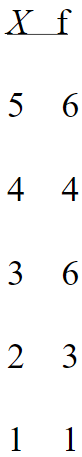
For the following scores in this frequency distribution table, what is the mode?
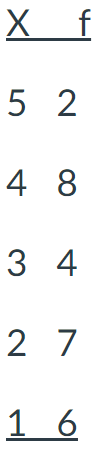
30
For a perfectly normal distribution with a median and mode of 30, what is the value of the mean?
40
A population of N = 60 scores has ΣX = 60 and ΣX2 = 100. For this population, what is the value of SS?
114.9
A population with a size of N = 10 scores has a ΣX2 = 363 and a (ΣX)2 = 2,481. Assume that this is for a very small population. What is the value of the sum of the squared deviation (SS)?
100
A population has a standard deviation of σ = 10. What is the population variance (σ2)?
3
If a population has a size of N = 20 and a sum of the squared deviations of SS = 60, what is the population’s variance (σ2)?
60
A sample of n = 8 scores has SS = 60. If these same scores were a population, then the
SS for the population would be _____.
70
The sum of the squared deviation scores is SS = 420 for a sample of n = 7 scores.
What is the variance for this sample (s2)?
+2.50
What z-score corresponds to a score that is 2.5 standard deviation units ABOVE the
mean?
z = -2.50
Which of the following z-score values represents the location farthest from the mean?
Scores: z = +1.20, z = +2.00, z = -2.50, z = -1.00
+2.50
For a population with 𝜇 = 75 and 𝜎 = 2, what is the z-score corresponding to X = 80?
-2.00
For a population with a mean of µ = 60 and a standard deviation of σ = 25, what is the z-score for X = 10?
+1.00
For a population with a mean of µ = 40 and a standard deviation of σ = 5, what is the z-score for x = 45?
Psychology
Suppose you are looking at scores for two of your classes.
In Psychology, you earned an exam score of X = 80 where the exam average was 𝜇 = 70 with a standard deviation of 𝜎 = 5.
In History, you earned an exam score of X = 95 where the exam average was 𝜇 = 85 with a standard deviation of 𝜎 = 10.
In which class did you score better compared to your classmates?
Calculus
Suppose that you are taking two classes and you recently took your midterm.
In Calculus, you have a midterm score of X = 90, and the class has an average midterm score of µ = 75 with a standard deviation of σ = 5.
In History, you have a midterm score of X = 90, and the class has an average midterm score of µ = 75 with a standard deviation of σ = 20.
In which class, Calculus or History, did you do BETTER compared to the rest of your classmates?
0.0067
Suppose you are doing a charity raffle ticket event for a student organization. Suppose there are 150 raffle tickets in the box. You draw a ticket and set it aside without putting it back in the box. What is the probability (p) of the next ticket to be drawn?
0.2
A jar contains 10 red marbles and 40 blue marbles. If you randomly select 1 marble from the jar, what is the probability (p) of obtaining a red marble?

0.3830
A normal distribution has a mean of 𝜇 = 100 with a standard deviation of 𝜎 = 40. If one score is randomly selected from this distribution, what is the probability (p) that the score will have a value between X = 80 and X = 120?
(Use Unit Normal Table)
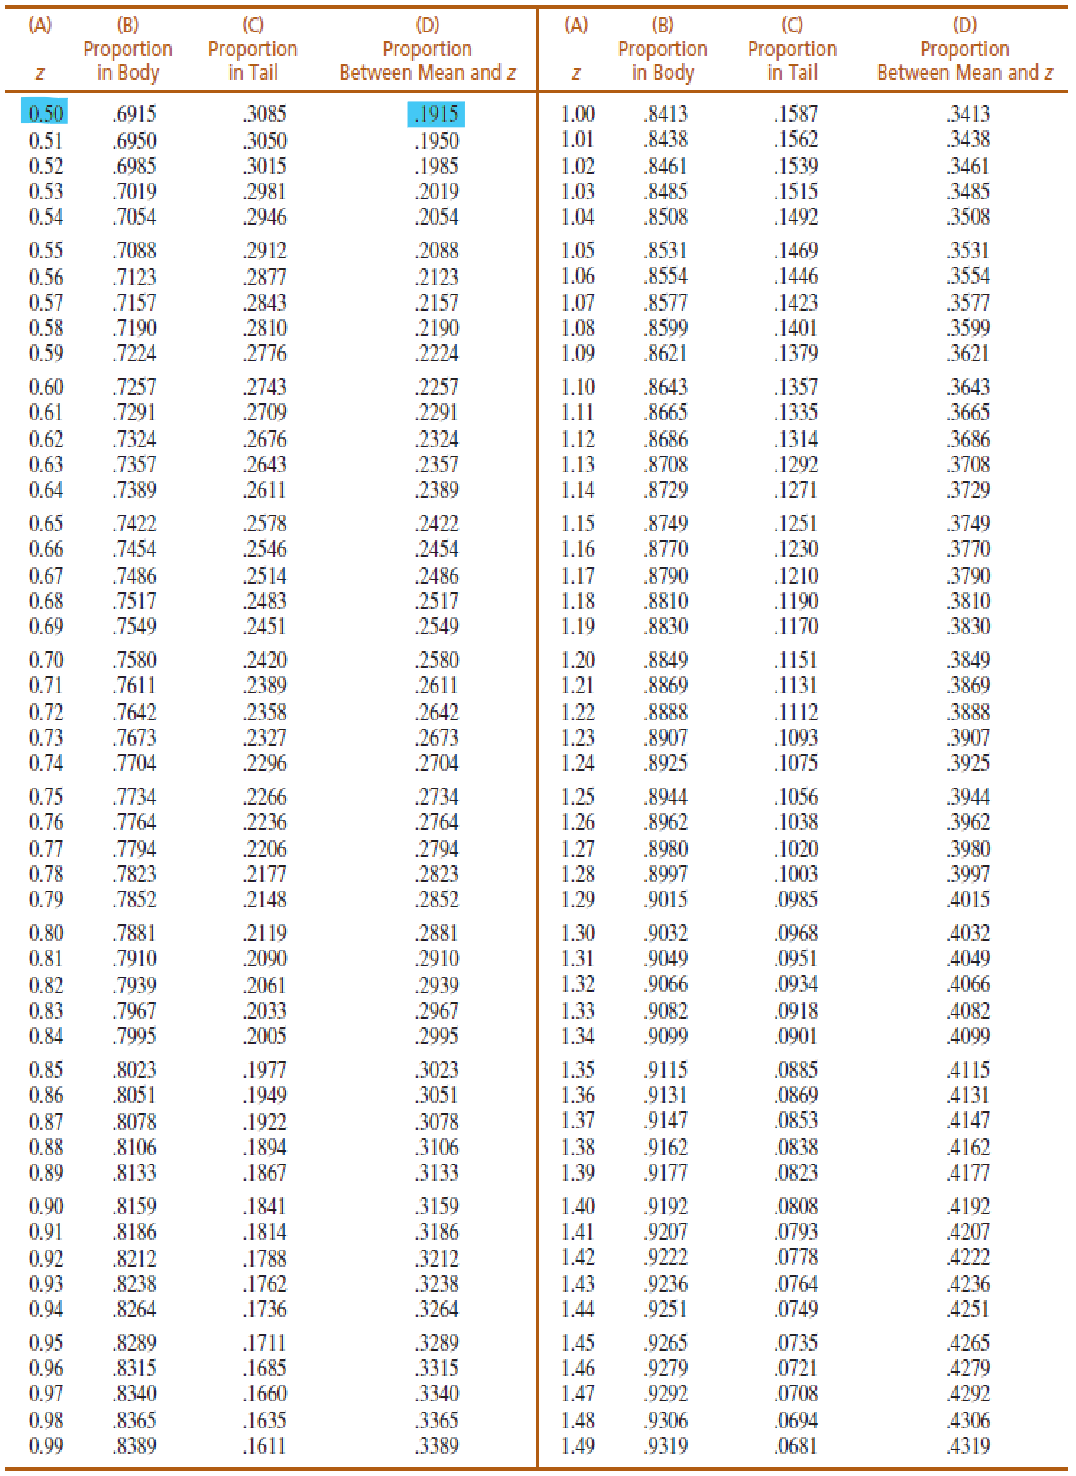
0.3830
What proportion of a normal distribution is located between the following z-score boundaries?
z = -0.50 and z = +0.50
(Use Unit Normal Table)
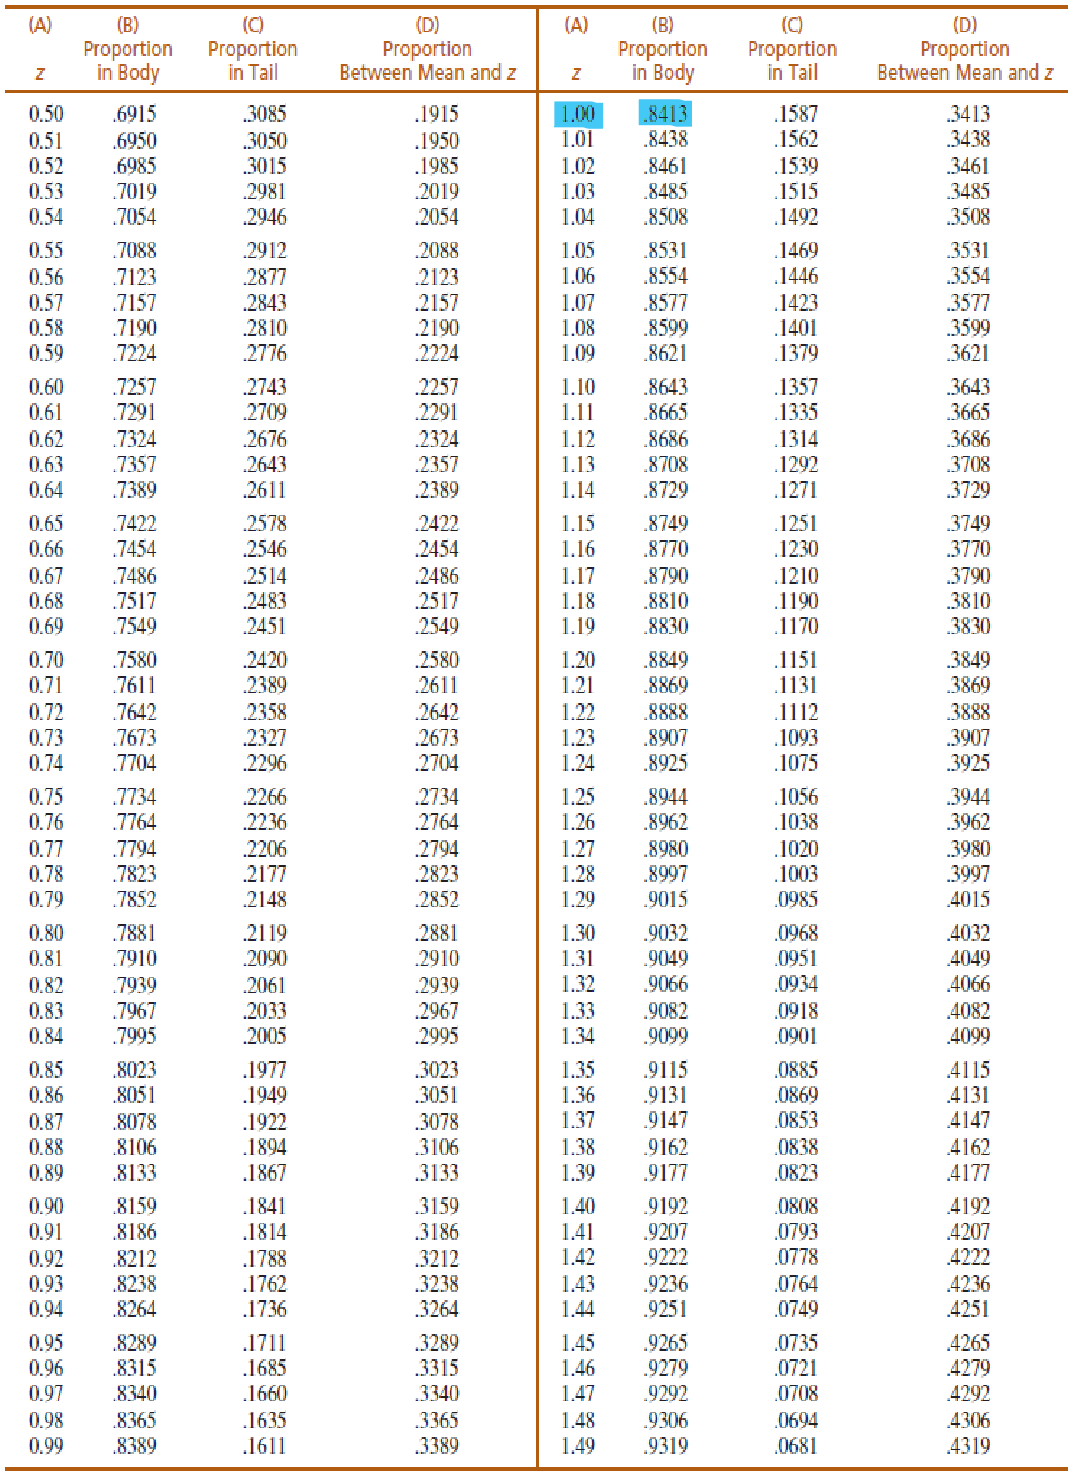
0.8413
What is the probability (p) of randomly selected a z-score greater than z = -1.00 from a normal distribution?
(Use Unit Normal Table)
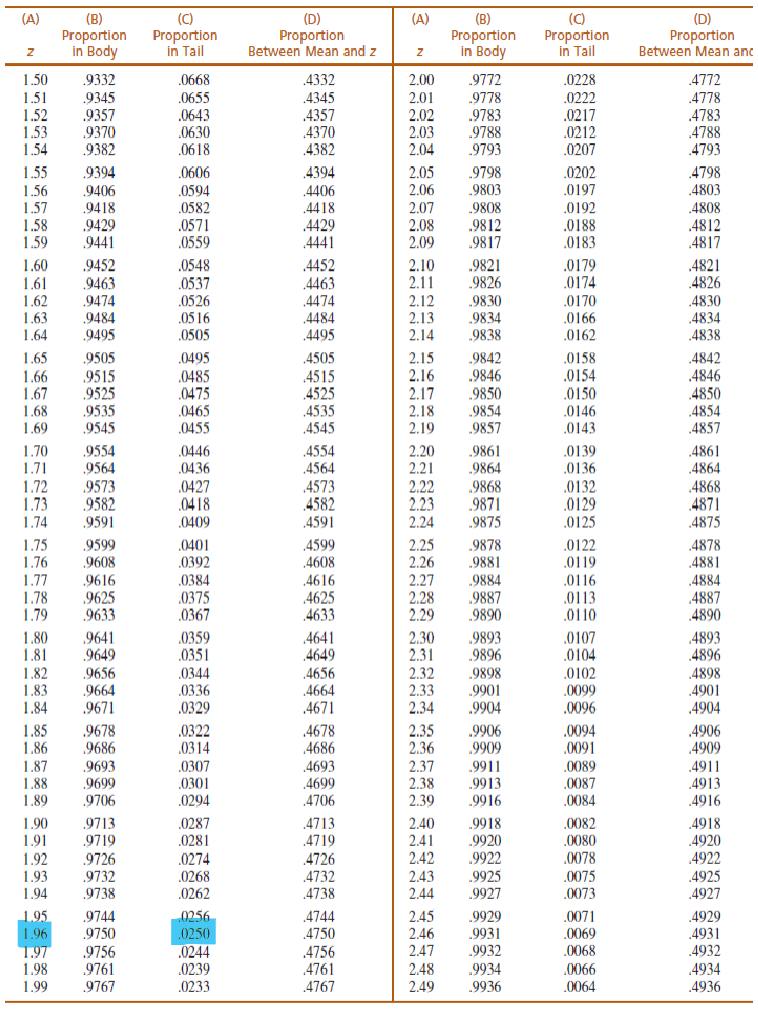
0.0250
What is the probability of obtaining a sample mean that produces a z-score GREATER than z = +1.96?
60, 6
For a population with μ = 60 and σ = 36, the distribution of sample means based on n = 36 will have an expected value of ____ and a standard error of ____. (Separate answers with a comma.)
40
If a population has a mean of µ = 40, what will be the value of the expected value of M (µM)?
5
A sample of n = 25 scores is selected from a population with μ = 80 with σ = 25. What is the standard error for these data?
20
A population of scores on the SAT forms a normal distribution with a mean µ = 700 and standard deviation of σ = 100. Suppose that you were to take a random sample of 25 students for a study involving SAT scores. What is the value of the standard error of M (σM)?
+2.00
A sample of n = 16 scores is selected from a population with μ = 50 and σ = 24. If the sample mean is M = 62, what is the z-score for this sample mean?
+3.00
Suppose that from a population, you obtain a mean of µ = 60 and standard error of σM = 5.
Suppose you then obtain a mean from a sample of M = 75. What is the z-score of this sample mean?
-2.00
What is the z-score for a sample mean of M = 60 for a random sample of n = 16 scores selected from a normal population with a mean of µ = 70 and a standard deviation of σ = 20?
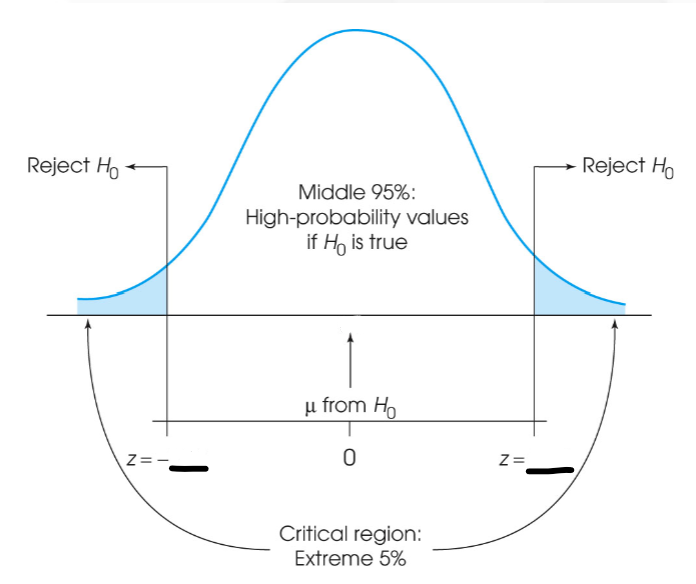
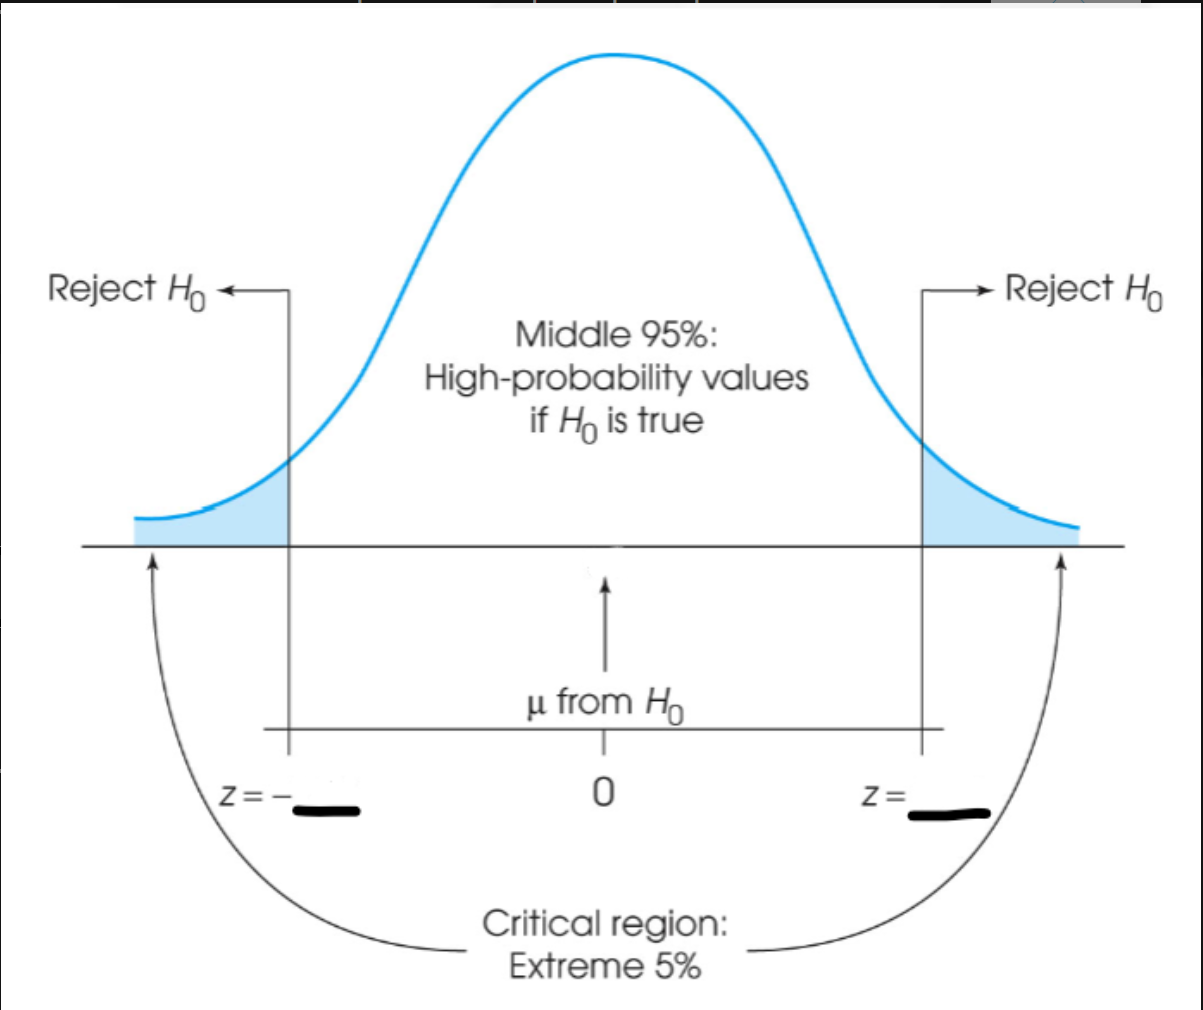
Fail to reject the null hypothesis.
The critical boundaries for a hypothesis test are z = +1.96 and -1.96. If the z-score for the sample data is z = -1.65, what is the correct statistical decision?

Fail to reject the null hypothesis.
Suppose you have a study that is two-tailed with alpha 0.01. If the result of the analysis is z = +2.40, what research decision regarding the null hypothesis should be made?

3
A sample of n = 4 scores has a variance of s = 6. What is the estimated standard error for the sample mean for the single-sample t-test?
1.50
A sample of n = 16 scores has a standard deviation of s = 6. What is the estimated standard error for the sample mean for the single-sample t-test?
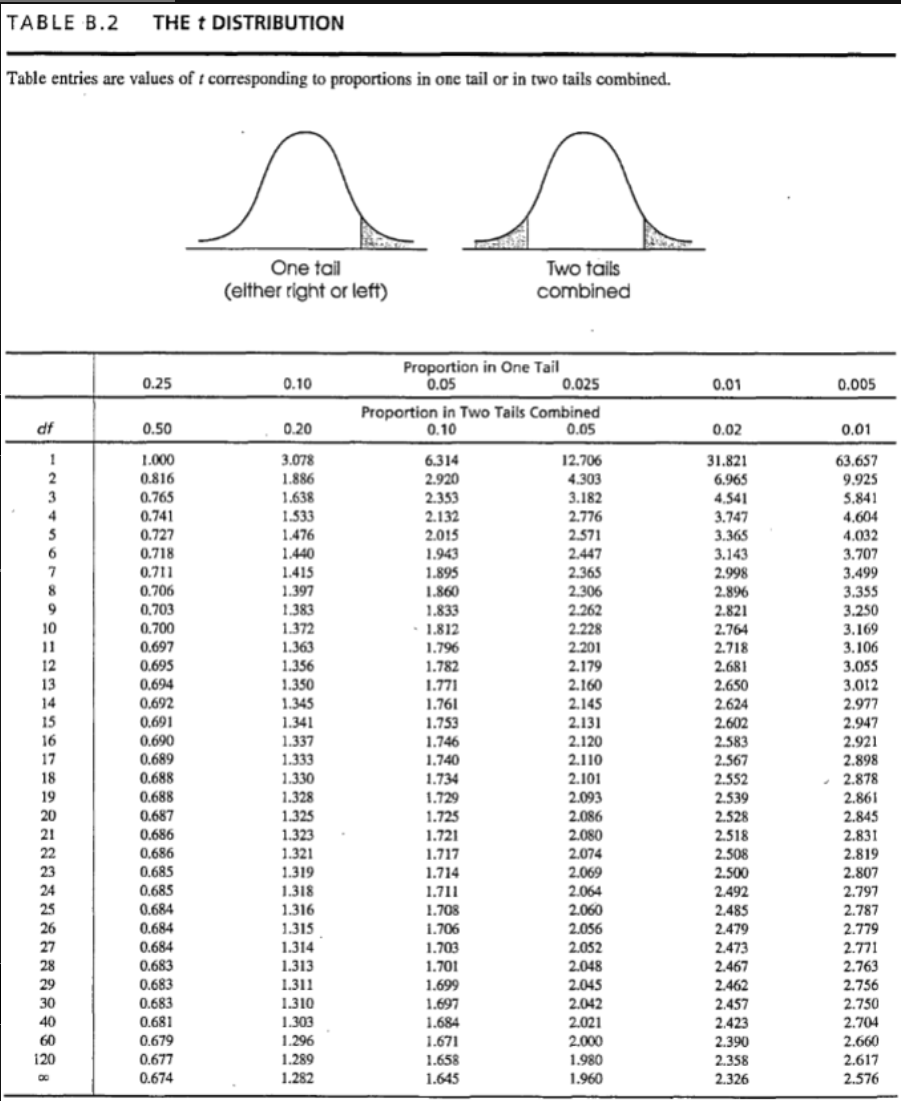
+/- 2.042
A researcher is using a two-tailed single-sample t-test hypothesis test with α = .05 to evaluate the effect of a treatment. There are n = 31 participants. What are the critical boundaries for this test?
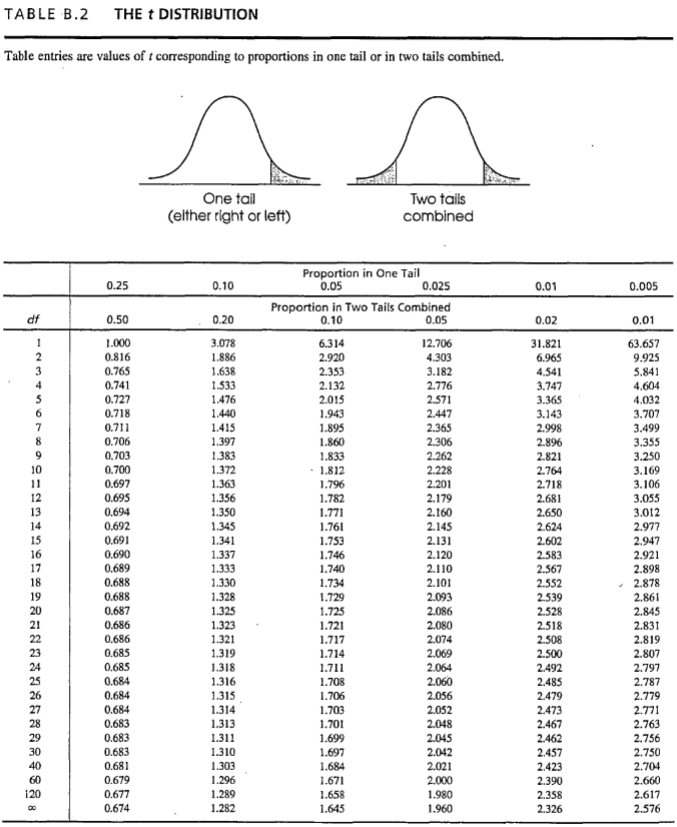
+/- 2.056
A researcher is using a two-tailed single-sample t-test hypothesis test with α = .05 to evaluate the effect of a treatment. There are n = 27 participants. What is the critical value for this test?
Reject the null hypothesis.
A sample of n = 26 participants produces a t statistic of t = 2.14. For a two-tailed hypothesis test with α = .05, what is the correct statistical decision for this sample?
Reject the null hypothesis.
Suppose you have a single-sample t-test study that is two-tailed, df = 24, with alpha 0.05.
If the result of the analysis is t = +2.07, what research decision regarding the null hypothesis should be made?
Hint: Find the critical region based on a two-tailed test at alpha .05!
0.4
A sample of n = 7 scores produces a t statistic of t = 2.00. If the sample is used to measure effect size with r2, what value will be obtained for r2?
0.72
A sample of n = 15 scores produces a t statistic of t = +6.00. If the sample is used to measure effect size with r2, what value will be obtained for r2?
There is no difference between the ratings of the new and current bubble gum formulas.
Look at the scenario in the attached image.
What does the null hypothesis say about the difference between the ratings of the new and current bubble gum formulas?

+/- 2.060
Look at the scenario in the attached image.
What is the critical value for this test? Note that this is a two-tailed test. (Hint: Find the degrees of freedom first!)

1.1767
Look at the scenario in the attached image.
Calculate the estimated standard error. Carry your answer to the fourth decimal place.
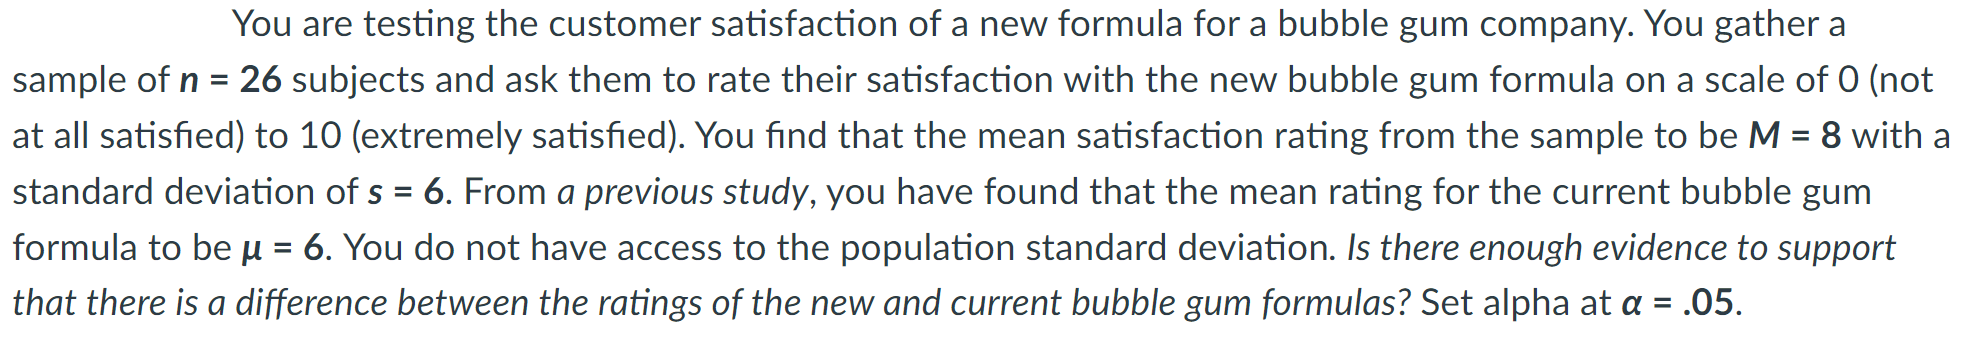
+1.70
Look at the scenario in the attached image.
Calculate the single-sample t-test. Round the answer to the second decimal place.

Fail to reject the null hypothesis.
Look at the scenario in the attached image.
Based on your answer to the previous question in which you calculated the single-sample t-test, and also based on your answer for the critical value for this scenario, what decision regarding the null hypothesis should be made?

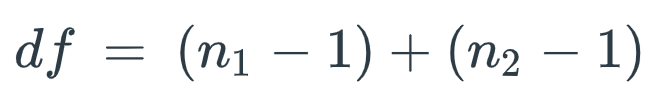
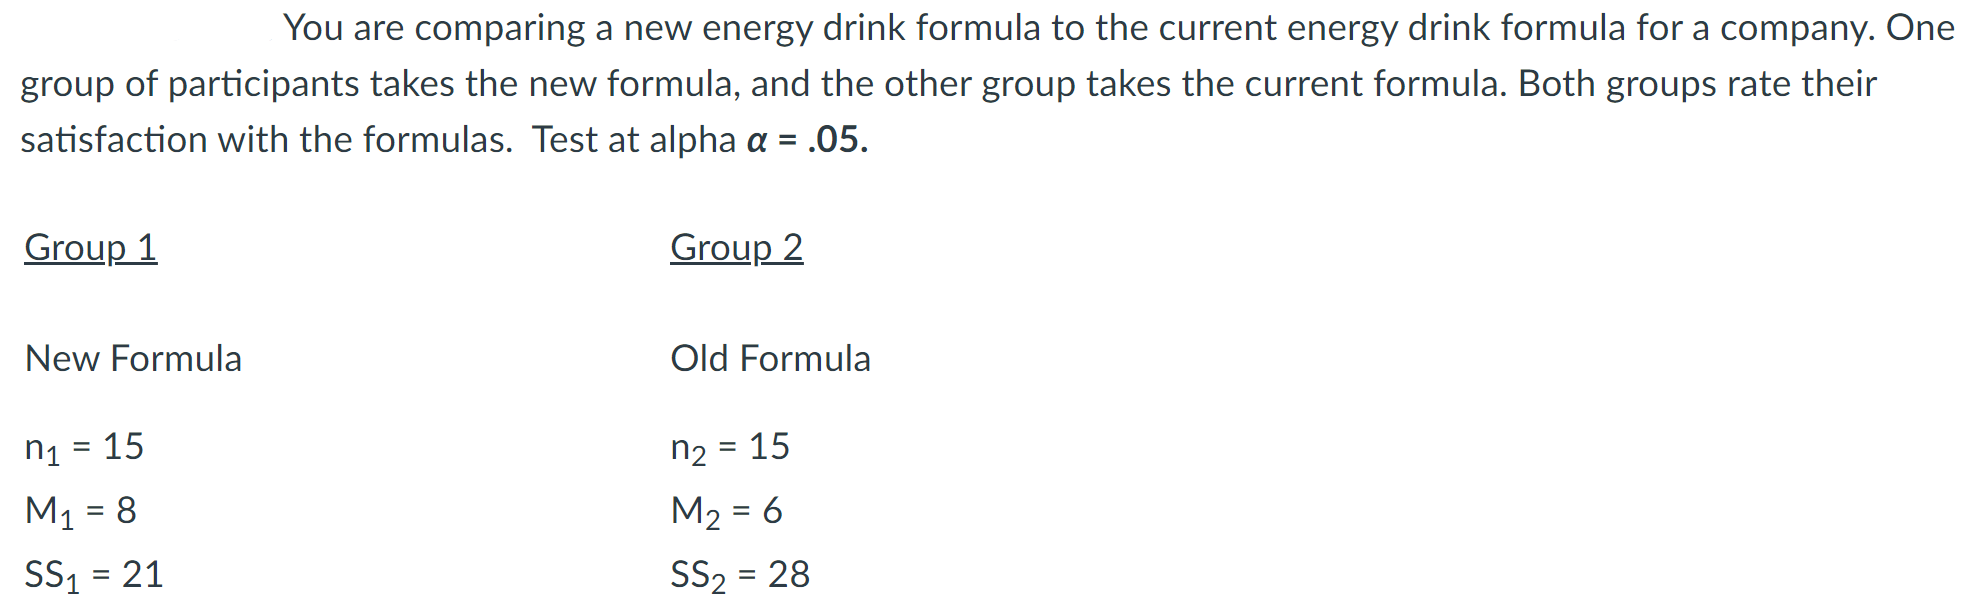
27
Suppose a study has two independent samples. One sample, Sample 1, has n = 11 participants, and the other sample, Sample 2, has n = 18 participants.
What is the degrees of freedom (df) for this study?
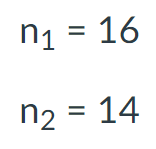
+/- 2.048
For a study with two independent samples, here are the sample sizes (check attached image):
Suppose that these two samples are used in a two-tailed, independent measures t-test with an alpha level of α = 0.05.
What is the critical value for this study? Find the degrees of freedom to find the critical value.
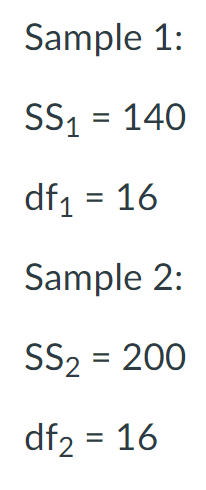
10.63
For an independent measures study, you have two samples with the following data (look at attached image):
What is the pooled variance? Carry your answer to the second decimal place.
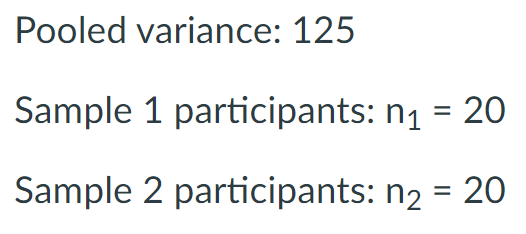
3.54
Suppose that for an independent-measures study, you have the following data (look at attached image).
What is the estimated standard error for the independent-measures t-test? Carry your answer to the second decimal place.
+1.50
Suppose for an independent-measures study, you have obtained the following data (look at attached image).
What is the result of the independent-measures t-statistic? Carry your answer to the second decimal place.
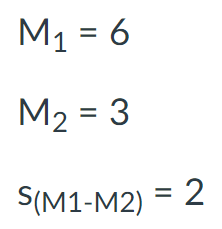
28
Look at the scenario in the attached image.
Find the degrees of freedom (df) for this study.
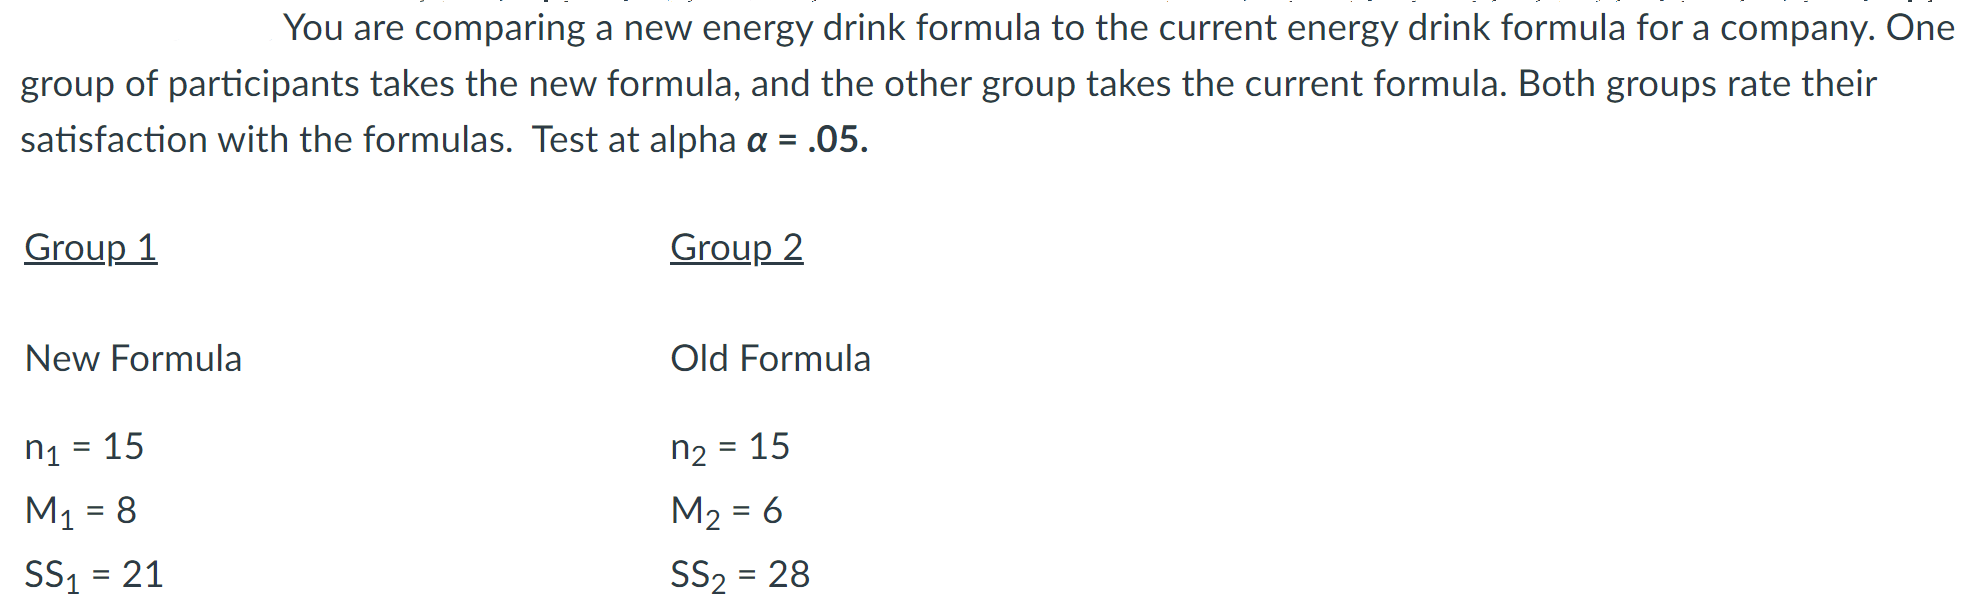
1.75
Look at the scenario in the attached image.
Calculate the pooled variance and carry the answer to the fourth decimal place.

0.4831
Look at the scenario in the attached image.
Calculate the estimated standard error for the independent-measures t-test. Carry the answer to the fourth decimal place.

+4.14
Look at the scenario in the attached image.
Calculate the independent measures t-test. Be sure to find the estimated standard error for the independent measures t-test first. Carry the t-test result to the second decimal place.

Reject the null hypothesis.
Look at the scenario in the attached image.
Based on your answer in the previous question, what decision should be made regarding to the null hypothesis? Check the degrees of freedom and the critical value for this test first.
2.00
In a research study comparing three treatments, MSwithin = 40 and MSbetween = 80. What is the
value of the F-ratio?
Reject the null hypothesis; there is a difference among the three website designs.
A researcher is doing a study on different website designs and user satisfaction. The
researcher uses three treatment groups, each with a different website design.
The researcher ascertains a result of F = 4.35 with df = 2.18 at alpha 0.05.
Based on this information, what decision should be made regarding the null hypothesis?

+0.67
You are calculating a correlation coefficient. Your SP = 20, your SSX = 30, and your SSY = 30. What is the value for your Pearson Correlation, or r?
54
In the context of regression, if X = 15, what is the predicted value of Y? Assume that the slope is b = 4 and the constant is a = -6.
11
Suppose you are performing a Chi Square Goodness-of-Fit test to see what brand of soda college students at HCC prefer, and you have gathered the following data (see below). What would be the expected frequency of each category for this data if the null hypothesis were true?

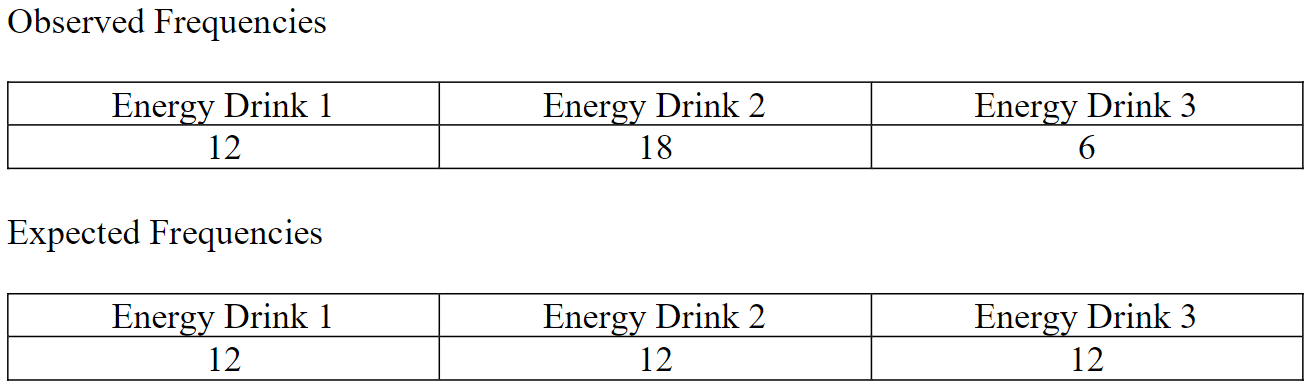
6.00
Suppose you are performing a Chi Square Goodness-of-Fit test to see which brand of
energy drink students would prefer to see offered at the HCC bookstore, and you have
gathered the following data.
What is the value for the Chi Square Goodness-of-Fit for this data?