Organic Analysis - Chapter 12, 13 and 14
1/110
There's no tags or description
Looks like no tags are added yet.
Name | Mastery | Learn | Test | Matching | Spaced | Call with Kai |
|---|
No analytics yet
Send a link to your students to track their progress
111 Terms
Spectroscopy:
The interaction of atoms with electromagentic radiation
Qualitative:
-Identifying the sample (Bonds, structure, components)
Quantitative:
-Identifying the concentration of the sample.
Decreased wavelength =
increased frequency + increased energy
What do IR waves do to molecules?
-IR waves are too low energy to promote electrons to higher shells so it causes changes to the vibrational energy of covalent bonds, where specific I.R. wavenumbers are absorbed by certain bonds to promote the bond from a ground to an excited vibrational state.
H closer to O =
More chemically shifted due to higher electronegativity of O
Weak acid + strong base:
Equivalence point above 7
The weak acid forms a weak base which accepts protons from the environment, increasing the pH.
Concordant results:
When all 3 titres are within 0.1ml of each other.
These are used to determine the mean
What are the different bond vibrations?
They can stretch, bend and scissor.
Wavenumbers =
1/wavelength - inverse of wavelength
cm^-1
Factors that affect required IR wavenumber to promote vibrational energy state:
-The mass of the atoms in the covalent bond (Heavier atoms vibrate more slowly than lighter ones so less energy is required)
-Strength of bond (increased strength = increase energy required)
How is IR used:
Each specific bond absorbs a specific wave number to promote the vibrational energy state to an excited state. The wavenumbers that don't pass through a molecule are measured by a computer, indicating which wavenumbers were absorbed and thus, what bonds were present in the molecule.
Absorbance dips in IR spectra:
Wavenumbers that were absorbed by the molecule
How to determine bonds in molecule:
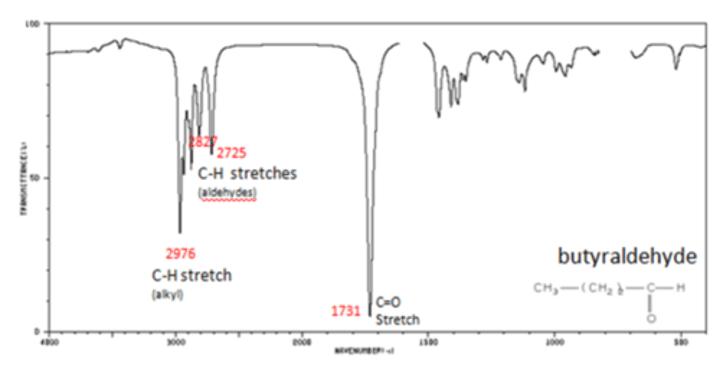
1. Look in 3200 - 3400 cm^-1 wavenumber region:
-Wide, double step: Hydroxyl group alcohol
-2 sharp vampire fangs: primary amine
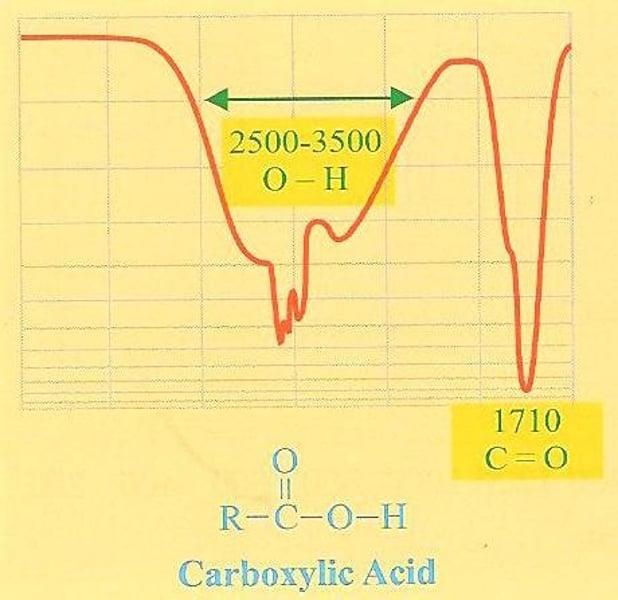
-Wide hairy beard: Carboxyl group
2. Look in 1600-1700cm^-1 region:
Find absorbance band that matches in data book, typically carbonyl group
*NORMALLY SHOULD BE ENOUGH AFTER THESE STEPS BUT IF NOT, CONTINUE
How to distinguish betwen carboxylic acid and alcohol:
-Carboxylic acid has a wide band at around 3000cm^1 which hides the CH band
-Alcohol has a wide band at around 3500cm^-1 which doesn't hide CH band so there is a double dip
What are wavenumber absorbance bands below 1000cm^-1 referring to:
The fingerprint region which is due to the bending and stretching of the entire molecule absorbing IR.
How can fingerprint region be used?
The fingerprint region is unique to a molecule so the fingerprint region of a molecule can be scanned against a library of fingerprint regions to:
-Verify a molecule
-Distinguish a molecule from another which have the same absorbance bands after 1000cm^1.
-Determine purity of molecule: Depending on how different fingerprint region of sample is to scanned library can determine purity.
Qualitative/Quantitative:
Qualitative
Qualitative information:
-Absorbance bands: Bonds and functional groups present
-Fingerprint region: The complete structure of a molecule if compared to a library of fingerprint regions.
What do radio waves do?
-Energy is too low to cause electronic, vibrational or rotational transitions.
-Cause a change in the spin of the particles in the nucleus (Nucleons)
Odd vs even nucleons in a nucleus:
-Nucelons spin on their axes (Up or Down) where an even number of nucleons cancel each other out so there is no spin. However, an odd number of nucleons has one unpaired nucleon, causing a net spin. This spin is net spin is what is used during NMR.
How does it work:
-Nuclei with an odd number of nucleons have an external magnetic field applied, causing the nuclei to line up parallel with the magnetic field. When radio waves are applied, a specific radio wave is absorbed by each nuclei depending on its chemical environment, causing the nuclei to be promoted from its ground state (parallel to field) to its excited state (spinning antiparallel to field). Since this is unstable, the nuclei goes back into its ground state, releasing a radiowave equal to what was absorbed which is measured and analysed on an NMR spectrum, providing information one the nuclei's chemical environment.
Factors affecting amount of radio wave absorbed:
-Type of nuclei (H, C or others)
-The effect of the other atoms surrounding the nuclei
How is chemical shift measured:
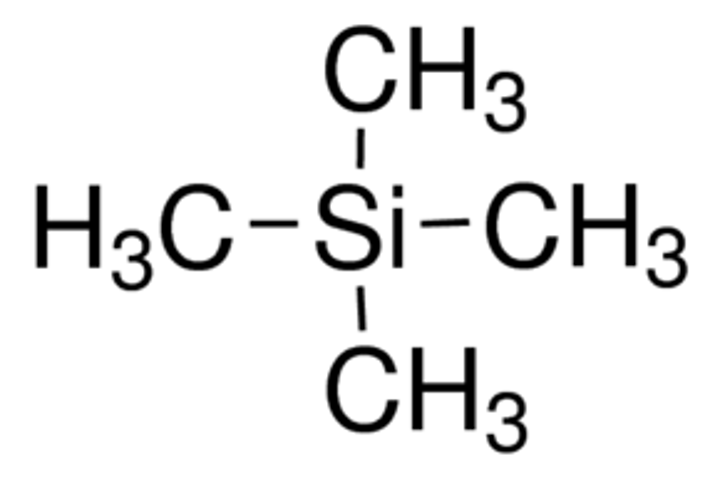
The specific radio wave absorbed by a H nuclei is compared to the energy absorbed by the H in tetramethylsilane Si(CH3)4 where the difference between the energy required to change the spin state between a H nuclei and TMS is called the chemical shift.
Chemical shift unit:
ppm
Why is TMS used:
-TMS is chemically inert so can be added to a sample without causing a chemical reaction.
-Has only one chemical environment with many H so produces single, large peak.
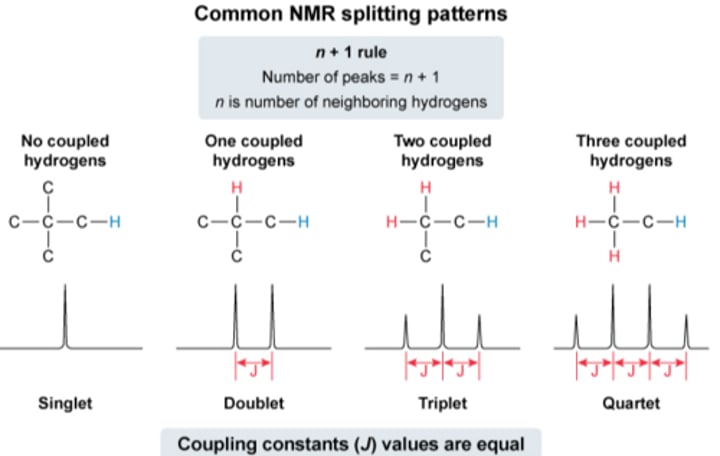
What is spin-spin splitting:
Electrons in adjacent H atoms shielding the nuclei from the external magnetic field, causing the peaks to split in the high resolution NMR.
Rule for determing number of splits:
Number of splits = n + 1
n - number of nearest neighbouring protons (All the H attached to the C/Cs which is/are directly attached to the C attached to the H of interest)
Pitfalls with peak splitting:
IF THE NEIGHBOURING H ARE IN THE SAME ENVIRONMENT THEY DO NOT SPLIT EACH OTHER.
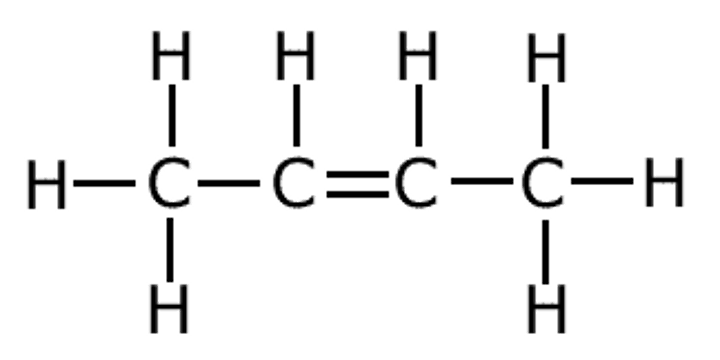
E.G. MIDDLE TWO Cs in BUT-2-ENE
IF THERE ARE TWO INSTANCES OF THE SAME CHEMICAL ENVIRONMENT, COUNT THE NEIGHBOURING H OF ONE OF THEM, DON'T DOUBLE IT.
E.G. MIDDLE TWO Cs in BUT-2-ENE
How to analyse HNMR spectrum:
1. Number of peak sets = number of environments (Draw potential isotopes of chemical formula)
2. Peak splitting = number of adjacent H atoms according to n+1 rule.
3. Relative peak area = relative number of hydrogens in each environment.
4. Chemical shift = type of H environment (Use data book)
C13 NMR:
-Signal
Mass Spectrometry:
A technique that used the difference in mass-to-charge ratios (m/z) of ionised atoms and molecules to separate them from each other and create a mass spectra.
How does it work?
A sample is vaporised. In the ionisation chamber, the sample is ionised, forming a positive molecular ion/parent ion (M+). This molecular ion is unstable and bombarded by electrons, causing it to break down into smaller fragments. The fragmented ions are accelerated through a magnetic field and are collected and measured by a detector.
What is the typical mass to charge ratio:
Molar mass/1 = Molar mass
-Charge is typically just +1
How do the peaks relate to the molecular mass of a molecule.
-The peaks have a charge of +1, hence the m/z ratio of molecules are the molar mass of the ion.
-Thus, the parent ion peaks to the right are the isotopes of the molecule with the molar mass the same as their m/z ratio.
-Hence, the relative abundance of each isotope and molar mass can be calculated based on the height of the peak, allowing a weighted average of the molar mass to be calculated.
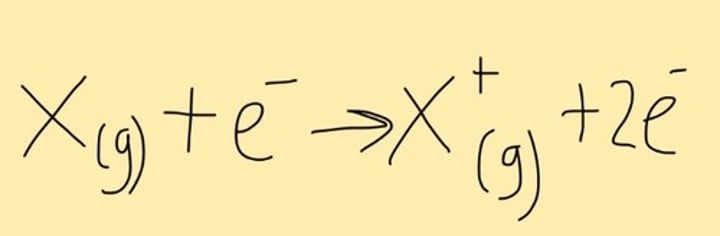
Write equation for ionisation of parent molecule
*ALWAYS WRITE STATES IN GAS (VAPORISED)
Molecule + e- -----> Molecule+ + 2e-
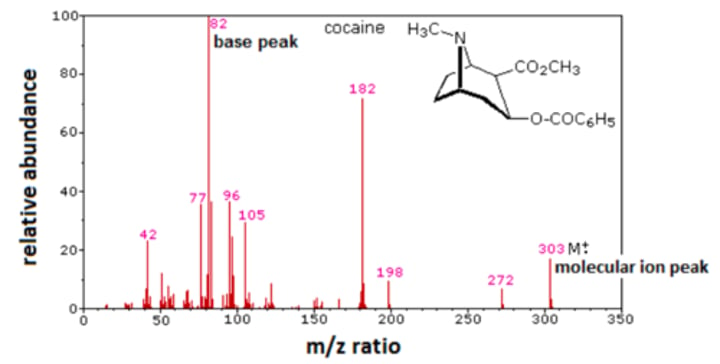
Greatest molecular mass peak (Furthest to the right) =
parent ion which provides molar mass of original molecule.
Information to analyse on spectra:
Molecular ion peak - Right most peak provides molar mass of original molecule
Base peak - Indicates which fragment had the highest abundance.
Why might there be two parent ion peaks?
There might be two isotopes of one of the atoms, such as C13 and C12 creating 2 parent ion peaks.
Chromatography:
-A separation technique that relies on the affinity of components of a mixture to a mobile phase and a stationary phase.
List the chromatography techniques:
-Paper chromatography
-Thin layer chromatography
-High performance liquid chromatography (HPLC)
-Gas chromatography
Mobile Phase:
The phase that is a carrier for the components as they travel through the stationary phase.
Stationary phase:
The phase that remains immobile where the mobile phase carries sample components through it.
Adsorption:
The process where a substance adheres to a surface of the phase.
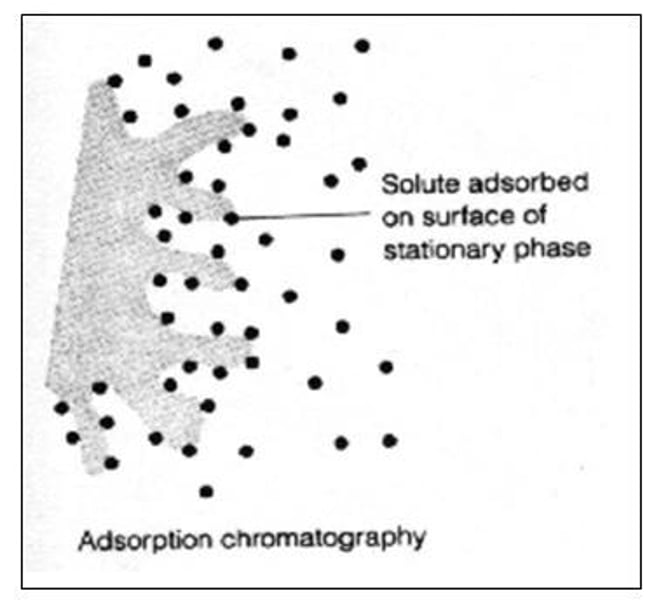
What happens to components during chromatography:
They undergo continual adsorption onto the stationary phase and desorption back into the mobile phase. It's affinity to the mobile and stationary phase will determine the rate at which it adsorbs and desorbs, influencing how far it travels along the stationary phase.
Paper chromatography (Incl SP and MP):
-Basic technique
SP: paper
MP: usually water
-Limited types of mobile phases = limited compounds that can be separated.
Thin Layer chromatography (Incl SP and MP):
-Improvement on paper technique
SP: silicia or alumina based
MP: Solvent (varied polarities). Ethanol, methanol, hexane, water, e.t.c.
How can components be detected?
UV light, chemical spray, iodine tank.
Brief setup for paper and thin layer chromatography:
-Draw origin line with pencil on stationary phase
-Place small dot of sample on line and of standard (if required)
-Place the stationary phase in solvent (mobile phase) so that solvent line is below origin line.
-Remove plate when solvent when separation is complete.
-Mark solvent and component lines
-Allow to dry.
What happens if solvent line is above origin line?
The solvent will dissolve the sample, preventing it from being separated and analysed.
How can components be identified in these techniques?
1. Standards
2. Retardation factor (Rf)
Standards:
Standards of known chemicals can be placed on the same chromatogram and if they have the same position, they can be classified as the same chemical.
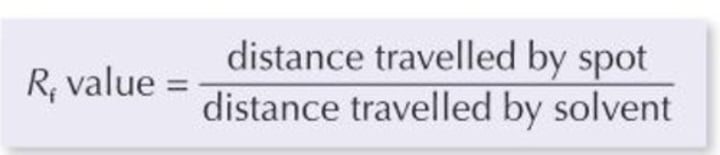
How is Rf calculated:
Distance travelled by component / distance travelled by mobile phase.
Rf always
What does Rf value show:
If Rf value is calculated and compared to table of Rf values under SAME CONDITIONS, same Rf values correspond to the same chemical.
Advantages of paper chromatography:
-Cheap
-Little preparation required
Disadvantages:
-Limited types of mobile phases can be used, so limited number of molecules can be separated
-Slower than TLC
TLC advantages:
-Detects smaller amounts than paper chromatography
-Wider range of solvents can be used allowing better selection to separate more molecules.
-Faster than paper chromatography
Is silica polar or non polar
polar
How to choose mobile phase:
Polarity of mobile phase should be different enough from that of SP so components can adsorb and desorb off the SP at different rates to be separated.
*Most likely ignore this, only for potential hard question
Discussing affinity to stationary phase/mobile phase:
Discuss the attraction of intermolecular forces to attribute the affinity:
E.g. The polar nature of the sample allows it to form strong dipole - dipole bonds with the stationary phase whereas it can't with the MP. Thus, it has a greater attraction to the SP, decreasing the rate at which it desorbs onto the MP, decreasing the distance it travels.
Column chromatography:
Washing a compound through a column using a solvent
SP: Polar
MP: Non polar
Eluent:
The solvent that is washed through a column during column chromatography
HPLC:
-Column chromtography technique
MP: solvents, water, mixes (Non polar)
SP: silicia based in beads, e.t.c. (Polar)
Components detected by UV
Reversed-phase HPLC
A form of HPLC
SP: Non polar
MP: Polar
How is the silica made non polar:
It is treated with long hydrocarbon chains
Retention time (Rt):
-The time taken for a component to pass through a column
-Analgous to Rf
High Rt:
High affinity to SP
Low Rt:
High affinity to MP
Factors that affect Rt:
Column length - Longer the column, the longer it takes for components to leave.
Pressure used
Type of mobile phase used
Type of stationary phase used
Temperature - Higher temperature = higher rate of adsorption and desorption due to higher kinetic energy
How can errors be reduced in HPLC:
Do anything that increases retention time.
-This creates better separation of components and peak area, decreasing the random area for estimating overlapping and close peaks, increacy accuracy.
What does the peak area in chromatograms represent:
Provides the relative concentration of each component, NOT EXACT
What is a calibration curve:
-Using standard solutions (Known concentration) of a chemical and running it through HPLC, to find the peak area at various concentrations of a chemical.
-This allows a graph to be constrcuted, showing the relationship between peak area and concentration for a chemical.
How can it be used for quantitative analysis:
-The peak area of an unknown sample can be compared to the calibration curve to determine the concentration of the unknown sample.
Volumetric analysis:
a process involving titration of one solution with another to determine the concentration of a sample.
Concentration formulas used:
c = n/v
n = m/M
C1V1=C2V2
What are the units of %m/v
grams per 100ml * 100
Standard solution:
Solution with an accurately known concentration
How can a standard solution be made:
-Using a primary standard
-Using a titration to find concentration of a solution which can become the standard.
What constituets a primary standard:
-Be available in pure form
-Have a known formula
-Not deteriorate or react with the atmosphere
-Have a relatively high molar mass
Titration:
An analytical method in which a standard solution is used to determine the concentration of an unknown solution.
Titrant:
Solution in burette
Aliquot:
Solution in titration flask
Equipment:
-Burette
-Conical flask
-Safety pipette filler
-Pipette
Acids:
proton donors
Bases:
proton acceptors
pH=
-log[H+]
BASE 10
pOH=
-log[OH-]
Base 10
pH + pOH =
14
[H+][OH-] =
10^-14
Equivalence point:
The point during the titration when the solutions have been mixed in the mole ratio.
End point:
The point at which the indicator changes colour and should closely match the equivalence point.
From acid to base titration for indicators:
The indicator first changes colour from the lower range of the pH
From base to acid titration for indicators:
The indicator first changes colour from the higher range of the pH
pH curve:
pH against the volume delivered by a burette.
Strong acid + strong base:
Equivalence point at 7.
The products of the reaction don't change the pH.
Strong acid + weak base:
Equivalence point below 7
The weak base forms a weak acid at the equivalence point, which donates H+ to decrease pH.
Weak acid + weak base:
No clear end point as there is no sharp pH change.
They do not completely react because they are weak.
Rinsing water left in the burette with sample in burette:
UNDERESTIMATES
-Dilutes the sample
-More sample is required to neutralise standard = weaker than it actually is
Rinsing water left in the burette with sample in flask:
OVERESTIMATES
-Dilutes standard
-More standard required to neutralise sample = makes sample look stronger.
Rinsing water left in the pipette with sample in burette:
OVERESTIMATES
-Dilutes standard
-Less sample required to neutralise standard = makes sample look stronger.