Quality
the ability of a product or service to meet customer needs
4 Categories of Cost of Quality
Prevention costs
Appraisal costs
Internal failure
External costs
Prevention costs
reducing the potential for defects (training)
Appraisal costs
evaluating products, parts and services (testing, inspection)
Internal failure
producing defective parts or service before delivery (rework, scrap, downtime)
External costs
costs that occur after delivery of defective parts or services (returned goods, liability, costs to society)
ISO 9000
A set of quality standards developed by the International Organization for Standardization (ISO). Focus is to establish quality management procedures through leadership, detailed documentation, work instructions and record keeping.
ISO 14000
A series of environmental management standards that contain 5 core elements: environment management, auditing, performance evaluation, labelling and life cycle assessment
Total Quality Management (TQM)
management of an entire organization so that it excels in all aspects of products and services that are important to the customer
Deming's 14 points for implementing quality improvement
create consistency of purpose
lead to promote change
build quality into the product
build long-term relationships based on performance
continuously improve product, quality and service
start training
emphasize leadership
drive out fear
break down barriers between departments
stop haranguing (lecture) workers
support, help, improve
remove barriers to pride in work
institute a vigorous program of education and self-improvement
put everybody in the company to work on the transformation
7 Concepts of TQM
continuous improvement
six stigma
employee empowerment
benchmarking
just-in-time (JIT)
taguchi concepts
knowledge of TQM tools
PDCA
a continuous improvement model that involves 4 stages: plan, do, check, act
Six Stigma
a program to save time, improve quality and lower cots (process with 99.9997% capability). Developed by Motorola in 1980s
DMAIC
Six stigma improvement model:
define (critical outputs and identify gaps for improvement)
measure (the work and collect process data)
analyze (the data)
improve (the process)
control (the new processes to make sure new performance is maintained)
Employee Empowerment
enlarging employee jobs so that the added responsibility and authority is moved to the lowers level possible in the organization
Quality circle
a group of employees meeting regularly with a facilitator to solve work-related problems in their work area
Benchmarking
selecting demonstrated standard of performance that represents the very best performance for a process or an activity
Steps to developing benchmarks
determine what to benchmark
form a benchmark team
identify benchmarking partners
collect and analyze benchmarking information
take action to match or exceed the benchmark
3 ways JIT is related to quality
JIT cuts the cost of quality
JIT improves quality
better quality means less inventory and a better, easier-to-employ JIT system
Taguchi concepts
3 concepts aimed at improving both product and process quality: -quality robust -quality loss function (QLF) -target-oriented quality
Quality Robust
products that are consistently built to meet customer needs in spite of adverse conditions in the production process
Quality Loss function (QLF)
a mathematical function that identifies all costs connected with poor quality and shows how these costs increase as product quality moves from what the customer wants
Target-oriented quality
a philosophy of continuous improvement to bring a product exactly on target
TQM Tools for generating ideas
-check sheets -scatter diagrams -cause-and-effect diagram
TQM Tools for organizing data
-Pareto charts -flowcharts
TQM Tools for identifying problems
-histogram -statistical process control chart
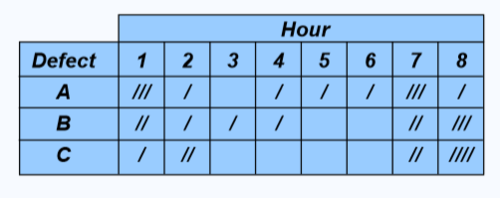
Check sheet
an organized method of collecting data
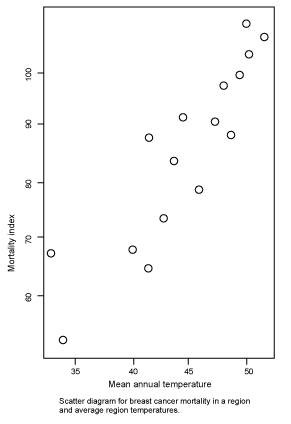
Scatter diagrams
a graph of the value of one variable vs. another
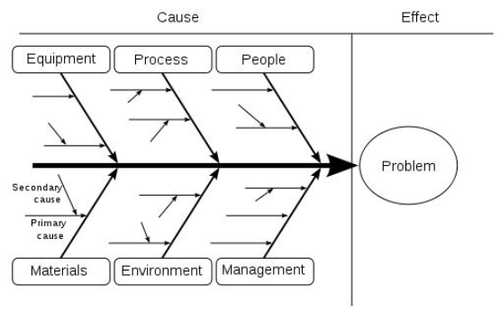
cause-and-effect diagram
tool that identifies process elements (cause) that might effect an outcome (fish-bone diagram)
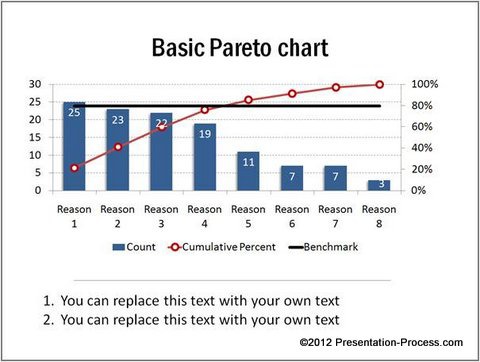
Pareto chart
a graph to identify and plot problems or defects in descending order of frequency
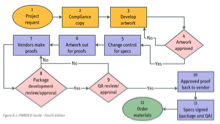
Flowchart
a chart that describes the steps in a process
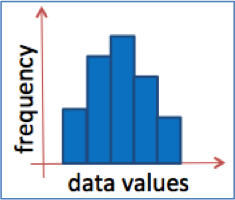
Histograms
a distribution showing the frequency of occurrences of a variable
Statistical Process Control (SPC)
a process used to monitor standards, make measurements, and take corrective actions as product or service is being produced
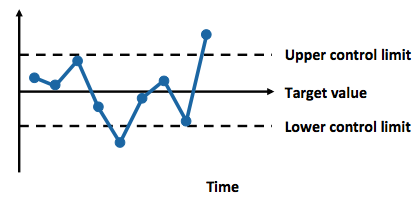
Control Charts
graphic presentations of process data over time, with predetermined control limits (distinguish between natural variations and assignable variations)
Inspection
a means of ensuring that an operation is producing at a quality level expected
Inspection Issues
-when to inspect -where in process to inspect -worker fatigue -measurement error -process variability -cannot inspect quality into a product -robust design, empowered employees and sound processes are better solutions
When & Where to inspect
at the supplier's plant while the supplier is producing
at your facility upon receipt of goods from supplier
before costly or irreversible processes
during the step-by-step production process
when production or service is complete
before delivery to your customer
at the point of customer contact
Source Inspection
controlling or monitoring at the point of production or purchase- at the source
poka-yoke
foolproof devices or techniques designed to pass only acceptable product
Attribute inspection
an inspection that classifies items as being either good or defective
Variable inspection
classifications of inspected items as falling on a continuum scale, such as dimension or strength
Reliability
determinant of service quality: consistency of performance and dependability
Responsiveness
determinant of service quality: willingness or readiness of employees
Competence
determinant of service quality: required skills and knowledge
Access
determinant of service quality: approachability and ease of contact
Courtesy
determinant of service quality: politeness, respect, consideration, friendliness
Communication
determinant of service quality: keeping customers informed
Credibility
determinant of service quality: trustworthiness, believability, honesty
Security
determinant of service quality: freedom from danger, risk or doubt
understanding/knowing customer
determinant of service quality: understand customer's needs
tangible
determinant of service quality: physical evidence of a service
Marriot Hotel Service Recovery Strategy: LEARN
Listen Emphasize Apologize React Notify (system so it wont happen again)
Natural variation
variability that affects every production process to some degree and is to be expected (common cause)
Assignable variation
variation in a production process that can be traced to specific cause
x-chart
a quality control chart for variables that indicates when changes occur in the central tendency of a production process
R-chart
a control chart that tracks the "range" within a sample; it indicates that a gain or loss in uniformity has occurred in dispersion of a production process
3 Types of Process Outputs
in statistical control and capable of producing within control limits
in statistical control but not capable of producing within control limits
out of control
Central Limit Theorem
regardless of the distribution of the population, the distribution of sample means drawn from the population will tend to follow a normal curve
Central Limit Theorem 2 points
the mean of the sampling distribution will be the same as the population mean
The standard deviation of the sampling distribution will equal the population deviation divided by the square root of the sample size
p-chart
a quality control chart that is used to control attributes - measure the percent defective
variables
characteristics that can take any real value, whole or fractions
attributes
defect-related characteristics, classify products as either good or bad, categorical variables
c-chart
a quality control chart used to control the number of defects per unit of output
C-chart, p-chart vs x-chart, R-chart
X-chart & R-chart: variable data (length or width)
C-chart: observations are attributes (defects per unit of output can be counted)
P-chart: observations are attributes (categorized into 2 states...good/bad, pass/fail)
Managerial Issues and Control Charts
select points in the processes that need SPC
determine the appropriate charting technique
set clear policies and procedures
Run test
a test used to examine the points in a control chart to see if nonrandom variation is present
Process Capability
the ability to meet design specifications
Process Capability ratio
ratio for determining whether a process meets design specifications; a ratio of the specification to the process variation (capable process has ratio of at least 1)
Process Capability Index
a proportion of variation between the centre of the process and the nearest specification limit (capable process must have at least 1)
acceptance sampling
form of quality testing used for incoming materials or finished goods (takes samples at random from a lot , decide whether to accept whole lot based on sample)
Operating characteristic curve
shows how well a sampling plan discriminates between goods and bad lots
Acceptable Quality Level (AQL)
poorest level of quality we are willing to accept
Lot Tolerance Percentage Defective (LTPD)
quality level that company considers bad
Average Outgoing Quality (AOQ)
average percent defective, can be computed if: -a sampling plan replaces all defectives -we know the incoming percent defective for the lot
Average Outgoing Quality Level (AOQL)
the maximum AOQ, the highest percentage defective or the lowest average quality
Inventory Management Objective
to strike a balance between inventory investment and customer service
Functions of Inventory
to decouple/separate various parts of the production process
to decouple the firm from fluctuations in demand and provide a stock of goods that will provide a selection for customers
to take advantage of quantity discounts
to hedge against inflation (oil)
4 Types of Inventory
Raw material (not processed)
Work-in-process (WIP, change but not complete)
Maintenance, Repair, Operation (MRO)
Finished goods (complete, waiting shipment)
ABC analysis
a method for dividing on-hand inventory into 3 classifications based on annual dollar value
Cycle Counting
items are counted and records updated on a periodic basis
Cycle Counting Advantages
-eliminates shutdowns and interruptions -eliminates annual inventory adjustments -trained personnel audit accuracy of inventory -allows causes of errors to be identified and corrected -maintains accurate inventory records
shrinkage
retail inventory that is unaccounted for between receipt and sale
pilferage
a small amount of theft
Control of service inventories techniques
good personnel selection training and discipline
tight control on incoming shipments
effective control on all goods leaving facility
Independent demand
the demand for an item is independent of the demand for any other item in the inventory
dependent demand
the demand for item is dependent upon the demand for some other item in the inventory (mostly complimentary goods)
holding costs
the cost to keep or carry inventory in stock (obsolescence, storage)
ordering costs
the cost of the order process (forms, order processing)
setup costs
the cost to prepare a machine or process for production (time and labour to clean/change tools)
setup time
the time required to prepare a machine or process for production
3 Inventory Models for Independent Demand
Basic Economic order quantity (EOQ) model
Production order quantity model (POQ)
Quantity discount model
Basic Economic Order Quantity (EOQ) Model
an inventory-control technique that minimizes the total ordering and holding costs (robust)
EOQ Assumptions
1.demand is known, constant, independent 2. lead time is known and constant 3. receipt of inventory is instantaneous and complete 4. quantity discounts are not possible 5. only variable costs are setup and holding 6. stockouts (shortages) can be completely avoided
robust
giving satisfactory answers even with substantial variation in the parameters
Lead time
in purchasing systems, the time between placing an order and receiving it; in production systems, the wait, move queue, setup and run times for each component produced
Reorder Points (ROP)
the inventory level (point) at which action is taken to replenish the stocked item
safety stock
extra stock to allow for uneven demand (a buffer)
Production Order Quantity model (POQ)
an economic order quantity technique applied to production orders, used when inventory builds up over a period of time after an order is placed
Quantity Discount Model
a reduced price for items purchased in large quantities
Probabilistic model
a statistical model applicable when product demand or any other variable is not known but can be specified by means of a probability distribution