All Unit 3 type shizzle. Business Management HL IB DP COURSE 2023 - 2025 🤬🤬🤬
1/42
Earn XP
Description and Tags
money making MACHINE FYI: the acronym "PIE" in the flashcards will always mean "Provided in Exam".
Name | Mastery | Learn | Test | Matching | Spaced |
|---|
No study sessions yet.
43 Terms
Capital Expenditure
Money spent on fixed assets and shi
Revenue Expenditure
Money spent on costs to maintain the daily running of a business
Expenditure
the action of spending funds (google def)
Internal Source of Foinance
Sources of foinance that a firm gets from their own assets and profits to fund or sustain projects and investments
External Source of Foinance
Sources of foinance that a firm obtains oustide of their own business. Like loans, bank overdrafts, or if they are extremely lucky… Shark Tank (Business Angels).

CAPITAL
anything that confers value or benefit to its owners, such as a factory and its machinery, intellectual property like patents, or the financial assets of a business or an individual.
Revenue
Price x Units Sold
Gross Profit
Sales Revenue - Cost of Sales
Cost of Sales (COGS)
opening stock + purchases - closing stocks
Net (Profit)
Gross Profit - Expenses
Expenses
BOTH direct costs and indirect costsinvolved in production
Assets
Items that re owned by a business that are valuable
Current Assets
cash or liquidiable (money makeable) asset that can be turned into cash within 12 months
Non - Current Assets
Assets that are bought for business use. Like copy rights, brands, trademars, machinery, property etc. Medium to Long term ish
Liabilities 😒
Money owed by a business
Current Liabilities
Debts that must be settled within a year
Non - Current liabilities
Debts that can or are due repaid after one year
Net Assets
TWO FORMULAS:
1. Net Assets = (Non Current assets + Current Assets) - (Non Current liabilities + Current Liabilities).
OR
2. Net Assets = Total Assets - Total Liabilities (preferred formula 😀)
Equity
The amount of money that goes to the shareholders after all costs are calculated.
Balancing
Net Assets = Total Equity.
THEY BOTH SHOULD BE THE SAME AND BALANCED OR ELSE YOU DID SOMETHING WRONG
Appreciation 😁
Increasing in value over time.
Depreciation 😟
Decreasing in value over time
Straight Line Method (Depreciation formula nomor 1)
Annual Depreciation = Purchase Cost - Salvage Value/Lifespan of Use
Residual Value
Estimated value of the asset at the end of its use
Units of Production Method
1st: Calculate Units of Production rate
Units of Production rate = (Cost of asset - Salvage value) / Estimated units of production
2nd: calculate depreciation expense
Depreciation Expense = Units of Production rate x Actual units produced
Profitability
An organizations profit making ability
Gross Profit Margin (PIE)
Gross Profit / Sales Revenue x 100
the percentage is then compared to other firms to determine the profitability
Profit Margin (PIE)
Profit before interest and tax / Sales revenue x 100
The profit margin is a profitability ratio that measures a firm’s overall profit (after all costs of production have been deducted) as a percentage of its sales revenue.
Liquidity
Liquidity in IB DP Business Management HL refers to the ease with which an asset or security can be converted into cash without causing a significant impact on its market price. It is a measure of how quickly and easily an asset can be bought or sold in the market. High liquidity implies that an asset can be easily converted into cash, while low liquidity suggests that it may be difficult to sell the asset quickly without affecting its value. (AI definition 🤖)
Current Ratio
Current Assets / Current Liabilities
Favorable Ratio for Current Ratio
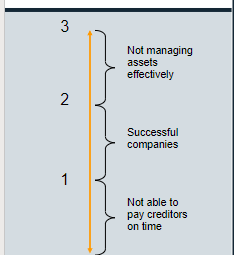
A Ratio of around 1.5 to 2.0 would be favorable. If the ratio is 1 or below, the short term debt of the business is larger than its liquid assets. Whereas a higher current ratio would suggest that there is too much cash, debtors, or inventory.

Methods of improving Current Ratio
Increase current assets by selling non - current assets for cash
Decrease current liabilities by using long - term Sources of Finance instead of Short term

Acid Test Ratio
Current Assets - Stock / Current Liabilities
Favorable Ratio for Acid Test
1:1. Anything less than 1:1 means the firm is experiencing working capital difficulties, and could risk having a liquidity crisis. (Meaning the firm is unable to pay its short term debts.)
Methods of improving Acid Test
Basically same thing as current ratio, decrease current liabilities, increase current assets etc etc etc
Working Capital
Also known as Net Current Assets. The cash or assets that are availabl to a business for daily operations.
Cash Inflow
All the revenue sources coming into the business
Cash Outflow
All potential costs going out of the business
Net Cash Flow
Cash inflows - Cash outflows. A negative net cash flow would mean there is a liquidity problem. Its preferred to have a positive number on the cash flow forecast.
Investment Appraisal
Evaluating the profitability of an investment project,
Payback Period (NOT ON FORMULA SHEET)
Length of time taken to repay the initial capital cost.
1st: Initial Investment cost / Contribution per month
2nd: Additional cash inflow needed / Annual Cash flow in the next year x12 months
Average Rate of Return or ARR (PIE)
Calculates the average Annual Profit of an investment project in a percentage of the initial amount of money invested in the project.
(Total returns - capital cost)/years of use / capital cost x 100
or
average annual profit/initial investment cost x 100
Higher = Better
NPV Net present value (PIE)
Sum of present value - cost of investment