Lecture 3: Table & Graphs
1/16
There's no tags or description
Looks like no tags are added yet.
Name | Mastery | Learn | Test | Matching | Spaced | Call with Kai |
|---|
No analytics yet
Send a link to your students to track their progress
17 Terms
data
measurement/observations of variables of interest
datasets
sets of info collected from multiple research participants
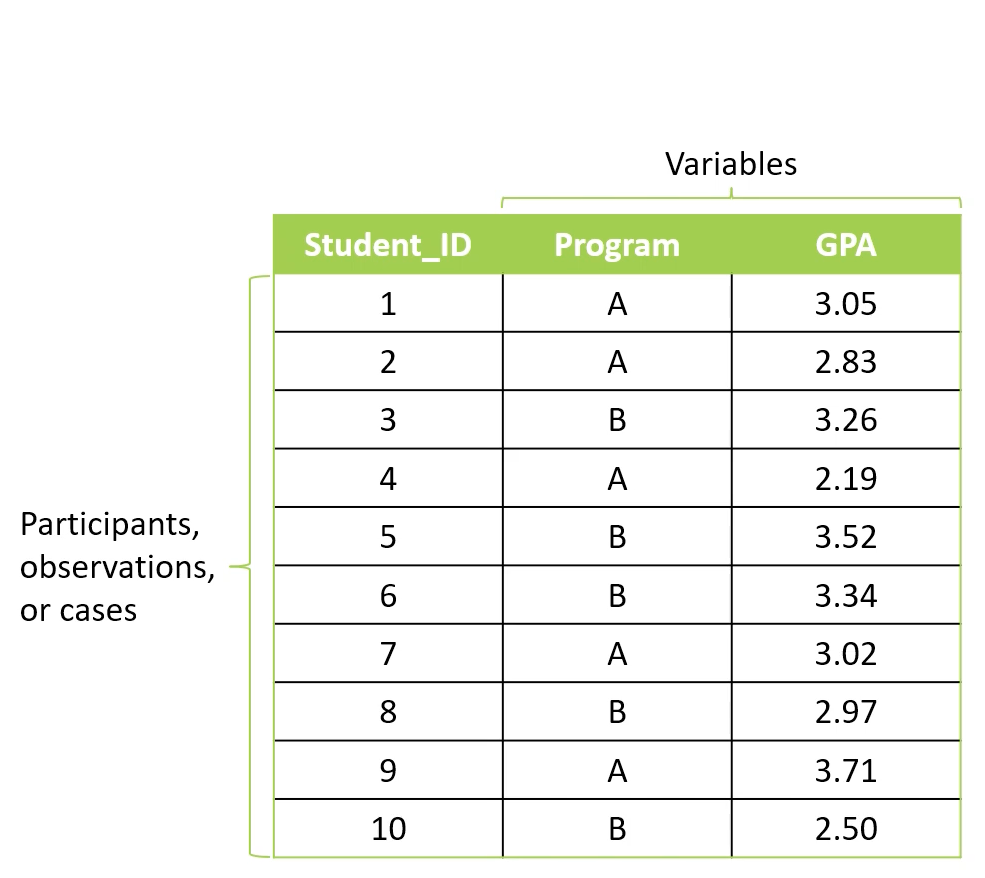
set up in data matrix
data matrix
rows = participants
column = variable measurements
Student ID = observations/participants
program + GPA = variables
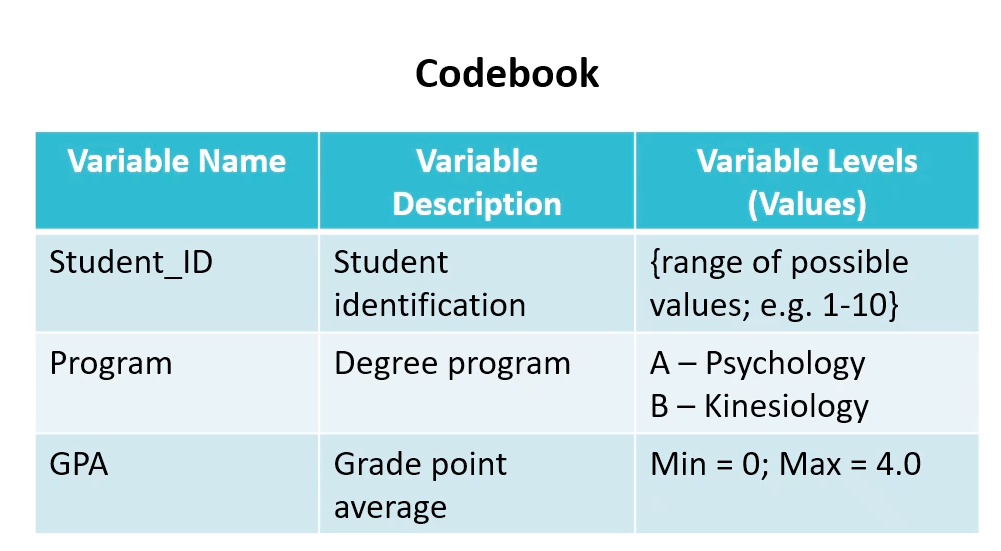
codebook
detailed info re each variable in dataset or distribution
variable levels = list all POSSIBLE values
why we should examine data
gain initial sense of data as whole
detect data coding/entry errors
values recorded accurately? impossible values?
ID outliers (unusual, rare, extreme values)
evaluate research methodology
were methods effective in measuring variables
determine whether data meets statistical criteria/assumptions
shape distribution of measurements in data?
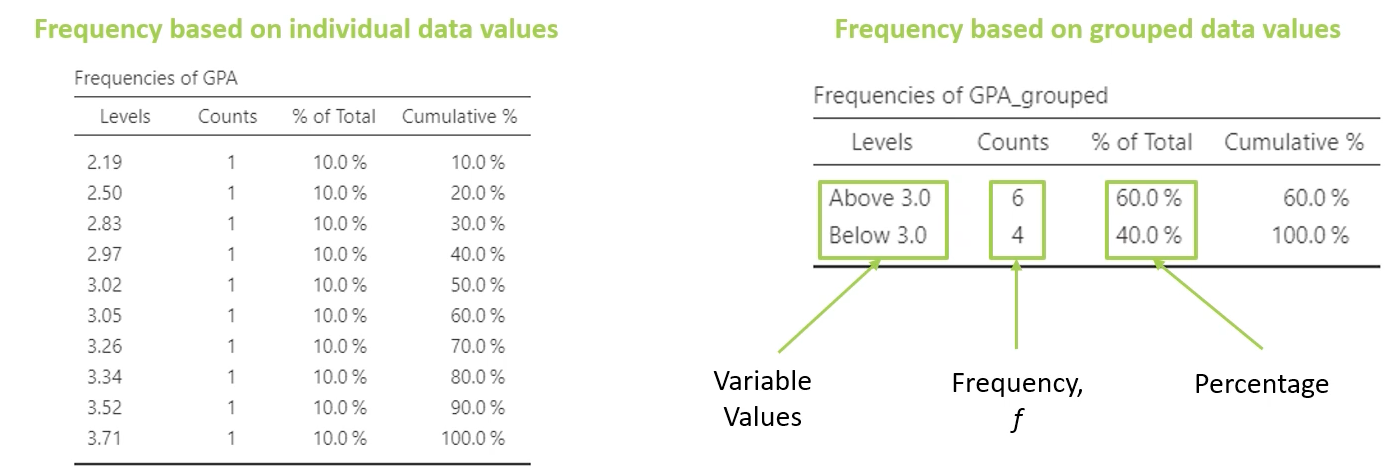
frequency distribution table
summarizes the #/ and % of participants for each given level of a variable
for nominal, ordinal scales of measurement because fewer values posible
variable values
frequency (f)
percentage
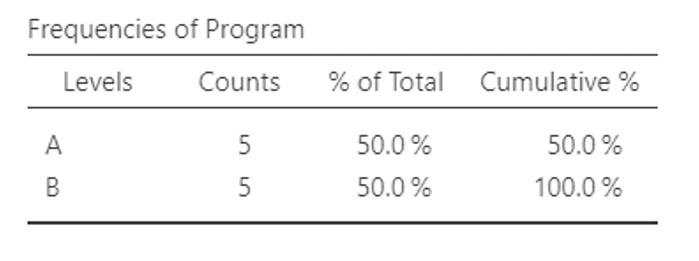
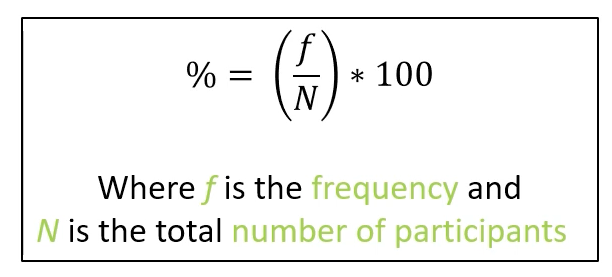
% total formula
% = (f/N) x 100
f = frequency
N = total number of participants
group frequency distribution table
summarizes LARGER sets of data into SMALLER intervals/grouped values
useful for interval/ratio scales of measurement (many possible values)
variable values
frequency (f)
percentage
x-axis
variable values/levels (horizontal)
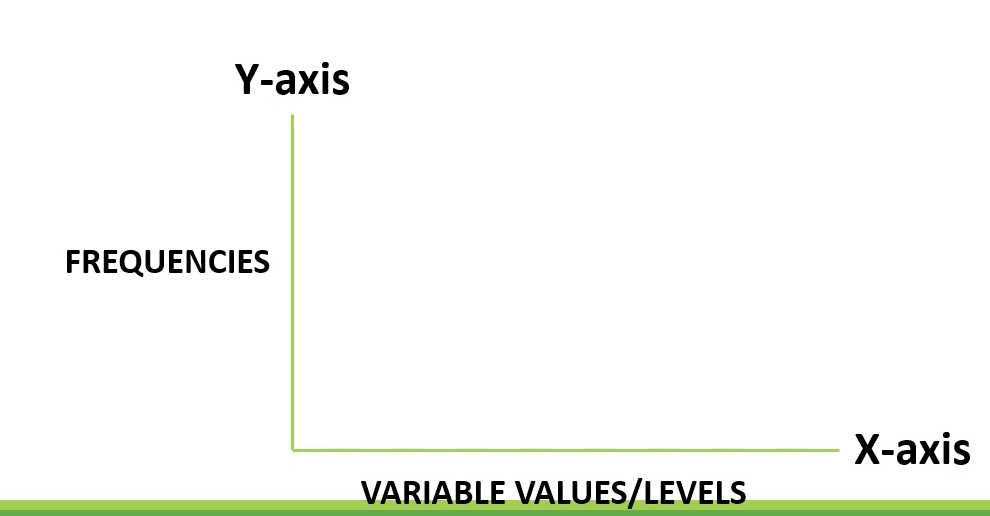
y-axis
frequencies (vertical)

bar graph
categorical/discrete data
nominal or ordinal
interval/ratio ONLY if created broader grouping categories
bars do not touch = distinct categories
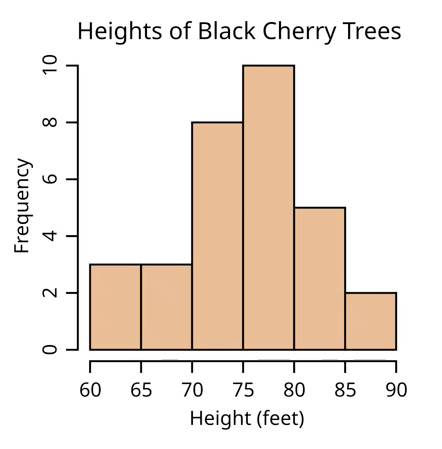
histogram
continuous data
interval or ratio
bars TOUCH to represent numerical continuity
smooth curve
theoretical distribution
height of curve = relative frequencies of variable levels
peak = highest relative frequency
tails = lower/decreasing relative frequency
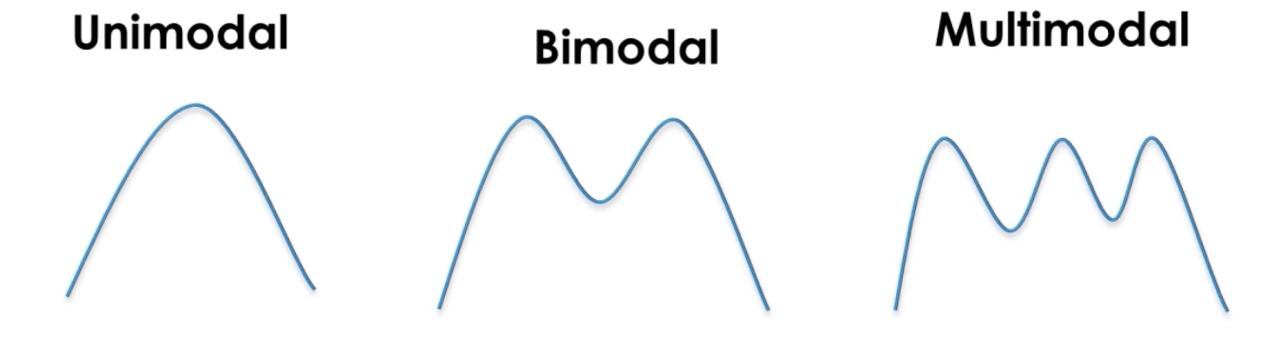
modality - describing shape of distribution
what is the most frequent value
1 peak = unimodal
2 peaks = bimodal
3+ peaks = multimodal
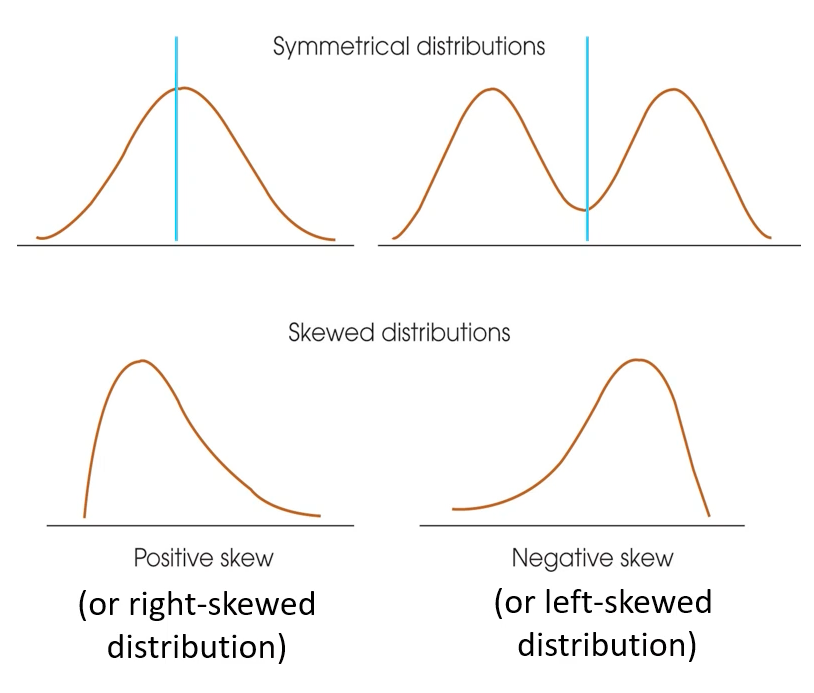
symmetry - describing shape of distribution
is it symmetrical or asymmetrical
symmetrical
possible to draw vertical line through middle so sides mirror images
assymetrical/skewed
values pile up toward one end = taper off at tail of distribution
+ skew = tail RHS
higher values occur LESS frequently, lower values occur more frequently
- skew = tail LHS
higher values occur more frequently and lower values occur less frequently
what does symmetry tell us?
where MOST of the values lie (what type of distribution)
require assumptions to be met
distribution is roughly symmetrical
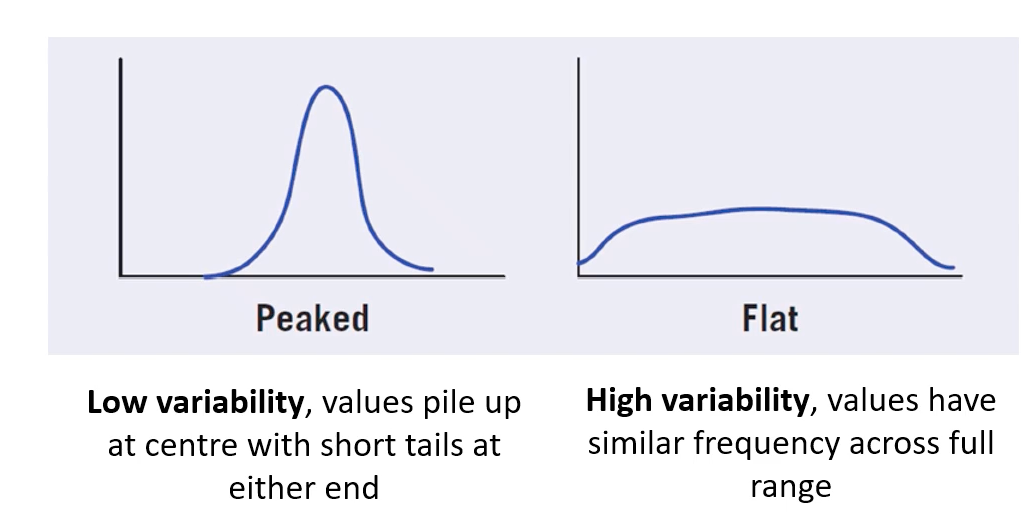
variability - describing shape of distribution
how spread out are the data
low
values pile at center = short tails at either end
high
values have similar frequencies across full range