Biostatistics
1/300
There's no tags or description
Looks like no tags are added yet.
Name | Mastery | Learn | Test | Matching | Spaced |
|---|
No study sessions yet.
301 Terms
What are 2 broad areas into which statistical methods fall?
descriptive statistics
inferential statistics
what is the purpose of descriptive statistics?
describe, organize, or summarize data:
refer only to the actual data available
what is an example of descriptive statistics?
mean blood pressure of a group
success rate of a surgical procedure
what is the purpose of inferential statistics?
making inferences that go bayond the actual data:
usually involve inductive reasoning
what is an example of inferential statistics?
- mean blood pressure of all Americans
- expected success rate of a surgical pocedure in patients who have not yet undergone the operation
what is a population?
the universe about which an investigator wishes to draw conclusions
does a population need to consist of people?
no
what is a sample
subset of the population- the part that is being observed or studied
what is an element?
a single observation, denoted by X
the number of elements in a population is denoted by what?
N
the number of elements in a sample is denoted by what?
n
what does a population consist of?
all elements from X1 to XN
what does a sample consist of?
n of N elements
most samples used in biomedical research are what?
probability samples
what are probability samples?
samples in which the researcher can specify the probability of any one element in the population being included
probability samples permit the use of what type of statistics?
inferential statistics
nonprobability samples allow what type of statistics to be used?
descriptive statistics only
what are the four basic kinds of probability samples?
1. simple random samples
2. stratified random samples
3. cluster samples
4. systematic samples
what is the simplest kind of probability sample?
simple random sample
how is a simple random sample drawn?
in such a way that every element in the population has an equal probability of being included
a random sample is defined by what?
the method of drawing the sample, not by the outcome
when is a sample representative?
if it closely resembles the population from which it is drawn
when does a sample or result demonstrate bias?
if it consistently errs in a particular direction
are biased samples representative?
no, they are unrepresentative. true randomization is proof against bias
what happens in a stratified random sample?
the population is first divided into relatively internally homogenous groups, or strata, from which random samples are then drawn.
when are cluster samples used?
when it is too expensive or laborious to draw a simple random sample or stratified random sample
how is a cluster sample drawn?
an investigator starts by selecting a random set of clusters and then selecting a subset of each.
how are systematic samples drawn?
selecting elements in a systematic way (i.e. every 5th one)
what advantage do systematic samples provide?
the equivalent of a simple random sample without actually using randomization
what is a common sampling problem in clinical research?
self-selection
what is internal validity?
when a study is valid as far as a subset of patients are concerned
what is external validity?
being valid to generalize a study to an entire population extrapolated from a sample
the probability of an event is denoted by what?
p
how are probabilities expressed?
decimal fractions between 0-1
can the probability of an event be negative?
no
the probability of an event not occurring is equal to what?
q=1-p
what is the addition rule of probability?
the probability of any one of several particular events occurring is equal to the sum of their individual probabilities, provided the events are mutually exclusive
what is the multiplication rule of probability?
the probability of two or more statistically independent events all occurring is equal to the product of their individual probabilities
the probability that a specific combination of mutually exclusive independent evens will occur can be determined by what?
binomial distribution
what is a binomial distribution?
one in which there are only two possibilities, such as yes/no. the binomial distribution gives the probability of obtaining an exact number of successes in a series of independent trials.
what is a typical medical use of the binomial distribution?
genetic counseling
what are the four scales of measurement?
nominal
ordinal
interval
ratio
what are nominal scale data?
data divided into qualitative categories or groups
is there implication of order or ratio for nominal scale data?
no
what are nominal data that fall into only two groups called?
dichotomous data
what are ordinal scale data?
data that can be placed in a meaningful order, but lacks information about the size of the interval
what are interval scale data?
data that can be placed in a meaningful order and have meaningful intervals between items, which are usually measured quantities.
what are ratio scale data?
data with meaningful order, meaningful intervals, and absolute zero.
do interval scale data have absolute zero?
no
what are discrete variables?
variables that can take only certain values and none in between
what are continuous variables?
variables that may take any value
what is a frequency distribution?
list of all the possible values between the highest and the lowest in order, recording the frequency with which each score occurs
what is a grouped frequency distribution?
a frequency distribution where individual scores are grouped, and each group encompasses an equal class interval
what is a relative frequency distribution?
a grouped frequency distribution which shows the percentage of all the elements that fall within each class interval
What is a cumulative frequency distribution?
it shows the percentage of elements lying within and below each class interval
what is a centile rank?
states the percentage of observations that fall below any particular score
what are quantiles?
divide distributions into a number of equal parts
what are asymmetrical frequency distributions called?
skewed distributions
what are the measures of central tendency?
mean
median
mode
what is a bimodal distribution?
when 2 scores both occur with the greatest frequency
is the mode influenced by small numbers of extreme scores?
totally uninfluenced
is the median sensitive to small numbers of extreme scores?
no, insensitive
is the median useful for highly skewed distributions?
yes
what symbolizes the median in a population?
μ
what symbolizes the median in a sample?
X-bar
_
X
is the median sensitive to extreme scores?
very
what is the measure of central tendency that best resists the influence of fluctuation between different samples?
the mean
what is variability?
the extent to which scores are clustered together or scattered about
what are the 3 important measures of variability?
range
variance
standard deviation
how do you find the deviation score of an element?
subtracting the distribution's mean from the element
how can you verify the results of calculating the deviation scores for all the elements in a distribution?
checking that the sum of the deviation scores for all the elements is 0
what is the variance of a distribution?
the mean of the squares of all the deviation scores in the distribution
how is variance symbolized?
σ^2 for a population
S^2 for a sample
variance is sometimes known as what?
mean square
what standard deviation?
the square root of the variance
what are the symbols for standard deviation?
σ in a population
S in a sample
or SD
why is the standard deviation particularly useful in normal distributions?
the proportion of elements in the normal distribution is a constant for a given number of standard deviations above or below the mean of the distribution
how much of the population falls within +/- 1 SD of the mean?
68%
how much of the distribution falls within +/-2 SD of the mean?
95%
how much of the distribution falls between +/-3 SD of the mean?
99.7%
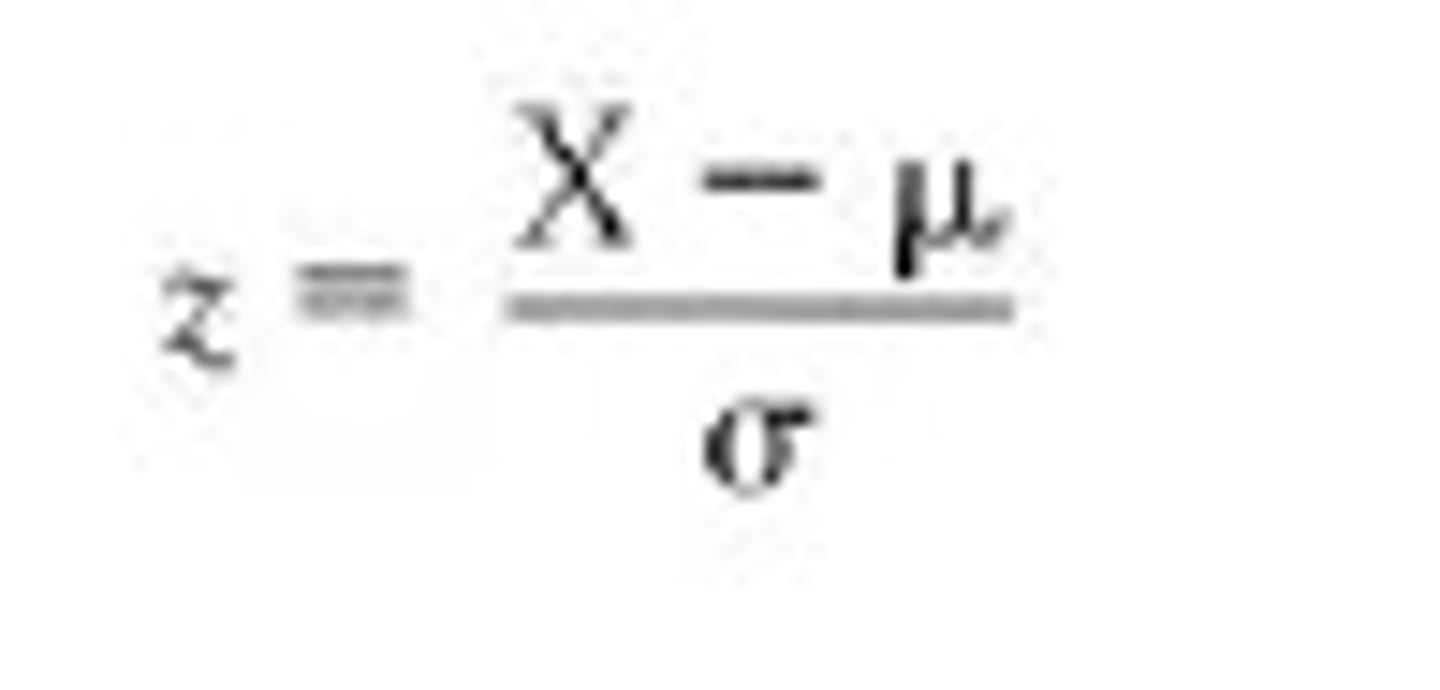
what is the Z score of an element?
the location of any element in a normal distribution expressed in terms of how many standard deviations it lies above or below the mean of the distribution
what is the formula for a z score?

what are population parameters?
the population mean and standard deviation
what are the sample mean and standard deviation called?
sample statistics
inferential statistics involves what?
using a statistic to estimate a parameter
what is sampling error?
natural, expected random variation that will cause the sample statistic to differ from the population parameter
if you plot all the means of a sample on a frequency distribution, the sample means form a distribution called what?
random sampling distribution of means
what is the central limit theorem?
1. the random sampling distribution of means will always tend to be normal, irrespective of the shape of the population distribution from which the samples were drawn.
2. The random sampling distribution of means will become closer to normal as the size of the sample increases
3. the mean of the random sampling distribution of means is equal to the mean of the original population
what is standard error (of the mean)?
the standard deviation of the random sampling distribution of means
SE or SEM
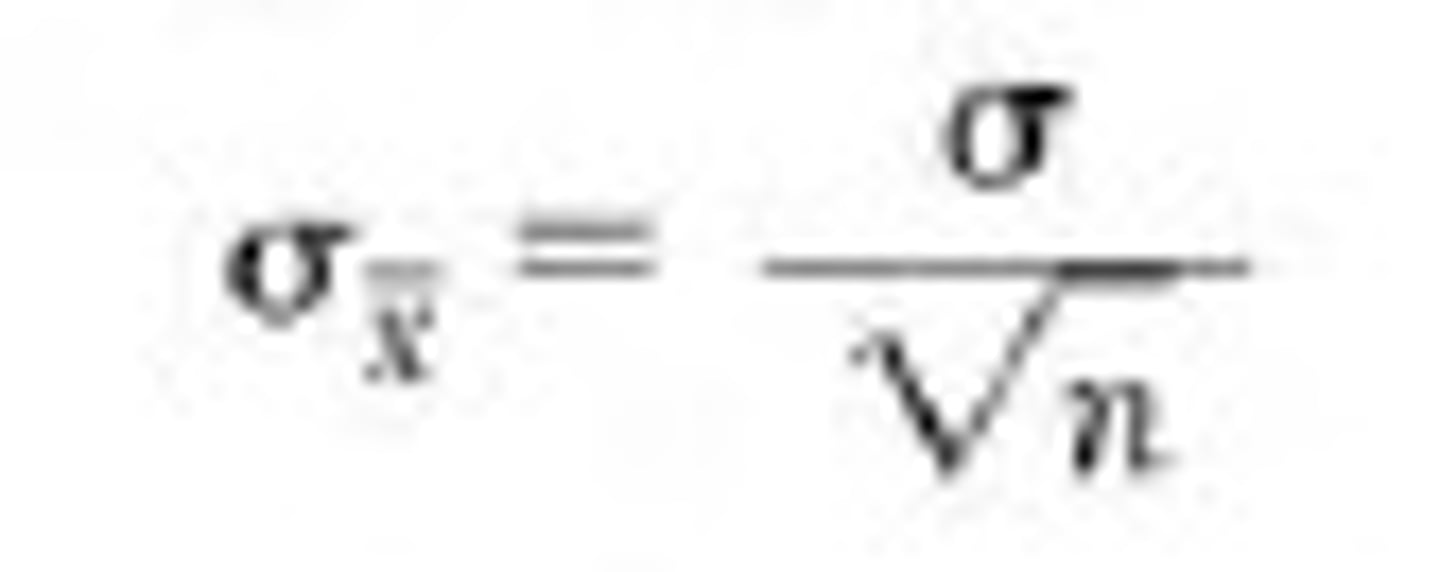
how is the standard error calculated?
the population standard deviation divided by the square root of the size of the samples
what is the formula for standard error?
standard error is inversely related to what?
square root of the sample size
what is the formula for calculating a z score from a standard error?
what are the steps for determining the probability that a random sample of n will have a mean above X?
1. calculate the standard error
2. calculate the z score of the sample mean
3. find the proportion of the normal distribution that lies beyond that z score
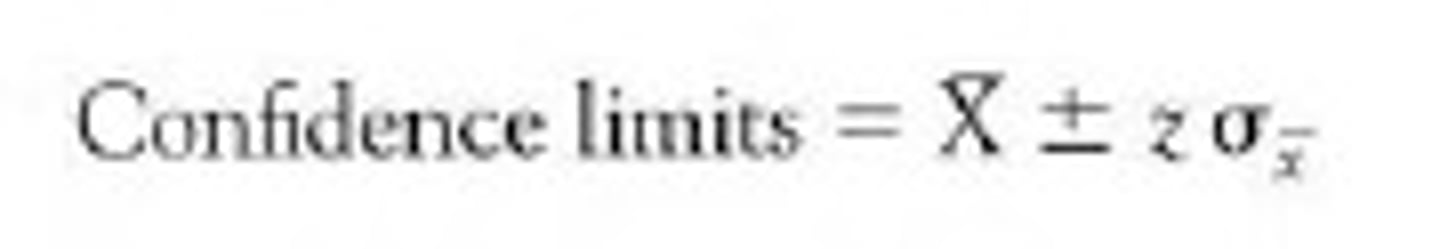
what are confidence limits equal to?
the sample mean +/- the z scores obtained from the table multiplied by the standard error
what is the formula for confidence limits?
95% confidence limits are approximately equal to what?
the sample mean plus or minus two standard errors
what is the difference between the upper and lower confidence limits called?
the confidence interval
CI
what must be done to the sample size to halve the confidence interval?
must be increased 4 fold
the standard error will decrease only in proportion to what?
square root of the sample size