Operations Management Final
0.0(0)
Studied by 1 personCard Sorting
1/110
There's no tags or description
Looks like no tags are added yet.
Last updated 2:38 PM on 4/27/23
Name | Mastery | Learn | Test | Matching | Spaced | Call with Kai |
|---|
No analytics yet
Send a link to your students to track their progress
111 Terms
1
New cards
Critical Path
longest path from start to finish
2
New cards
ES
Earliest start time = max\[EF times of all activities immediately preceding activity\]
3
New cards
LS
Latest start time = LF – t
4
New cards
EF
Earliest finish time = ES + t
5
New cards
LF
Latest finish time = min\[LS times of all activities immediately following activity\]
6
New cards
Slack
subtraction of either LatestStart - EarliestStart or LatestFinish - EarliestFinish
7
New cards
Process
turning inputs into outputs
8
New cards
Backward integration
owning and controlling entities upstream (earlier on in the chain → strawberry farms, dairy farms)
9
New cards
Forward Integration
owning and controlling entities downstream (closer to the consumer → food trucks, deli restaurants)
10
New cards
4 Costs of Quality
External failure, Internal failure, Appraisal, Prevention
11
New cards
Causes of Variation: Common Causes
(completely unavoidable)
* purely random; unidentifiable factors
* e.g. diameter varies by 0.0001 in.
* purely random; unidentifiable factors
* e.g. diameter varies by 0.0001 in.
12
New cards
Causes of Variation: Assignable Causes
(the real reason why; to investigate)
* Variation-causing factors that can be identified
* e.g. poorly trained employee
* Variation-causing factors that can be identified
* e.g. poorly trained employee
13
New cards
Types of Variable Charts (continuous numerical data)
R-charts, xbar-charts
14
New cards
Types of Attribute Charts (discrete numerical data)
p-charts, c-charts
15
New cards
Variables (to measure performance)
weight, length, volume, or time
16
New cards
Variable Data Examples
How long did the customer wait? What was diameter of the pizza? Temp of food? Weight of chicken?
17
New cards
Attributes (to measure performance)
yes-no counts (yes, defect or no defect)
18
New cards
Attribute Data Examples
Food sent back to kitchen? Bill correct or not? Did food leave the kitchen < 147 degrees? Was the pizza larger than 12 in?
19
New cards
SPC
Statistical Process Control
20
New cards
Step 1: Calculating X-bar & R-Chart UCL & LCL
within each sample (will either be by row or by column), calculate the range and the average
21
New cards
Step 2: Calculating X-bar & R-Chart UCL & LCL
then calculate the average of all sample ranges and averages to compute x-bar and R-bar
22
New cards
Step 3: Calculating X-bar & R-Chart UCL & LCL
based on n (aka sample size), identify A2, D3, D4 values on the chart to be used in the formulas
23
New cards
What makes a process out of control
* run = is when you have 5 consecutive sample points either to the upperside or lowerside of your nominal value
* reached past UCL or LCL
* reached past UCL or LCL
24
New cards
Using Control Charts for Process Improvement
Sample the process
Find the assignable cause
Eliminate the problem
Repeat the cycle
Find the assignable cause
Eliminate the problem
Repeat the cycle
25
New cards
Variable charts involve ____ measurements
precise
26
New cards
Attribute charts involve measuring by ____
counting the # of defects
27
New cards
R-bar & X-bar charts _____
have to be done together
28
New cards
p-charts & c-charts _____
are less expensive $$$ than other charts
29
New cards
p-bar =
total defectives / total observations
30
New cards
c-chart UCL & LCL steps
1. calculate average number of defects per item (total defects observed / total # of observed items) = c-bar
2. take c-bar + z (whatever sigma, ex 3) \* sqrt c-bar = UCL
3. take c-bar - z (whatever sigma, ex 3) \* sqrt c-bar = LCL
31
New cards
What makes c-Charts different?
c-Charts: defects on __**one unit**__ (e.g. how many scratches are on one piece of plexiglass (c = 4)
32
New cards
Six Sigma Quality: DMAIC Cycle
D - Define
M - Measure
A - Analyze
I - Improve
C - Control
\
M - Measure
A - Analyze
I - Improve
C - Control
\
33
New cards
WBS stands for ____
Work Breakdown Structure
34
New cards
5 Steps to Planning Projects
1. Define work breakdown structure
2. Diagram the network
3. Develop the schedule
4. Analyze cost-time trade-offs
5. Assess risks
35
New cards
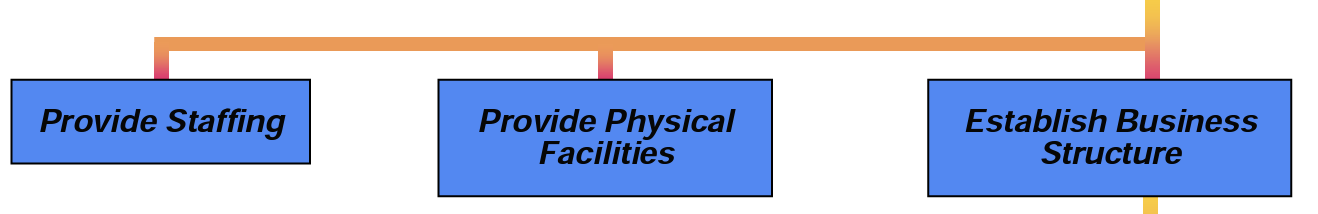
WBS First Level (after starting a business)
\

36
New cards
WBS Second Level
37
New cards
WBS Third Level

38
New cards
AON stands for
Activity-on-Node
39
New cards
EOQ (an Inventory Model) stands for ____
Economic Order Quantity
40
New cards
The Q System (an Inventory Model) is the _____
Continuous Review System
41
New cards
Aspects of the Continuous Review (Q) System
* constant lead times introduced now
* two models
* certain demand and uncertain demand
* Inventory position (IP) = OH (on hand inventory) + SR (scheduled receipts) - BO (backorders)
* two models
* certain demand and uncertain demand
* Inventory position (IP) = OH (on hand inventory) + SR (scheduled receipts) - BO (backorders)
42
New cards
Continuous Review → continuously checking IP after every withdrawal….
Rule:
* if IP > R do not place an order
* if IP
* if IP > R do not place an order
* if IP
43
New cards
The P System (an Inventory Model) is the _____
Periodic Review System
44
New cards
Aspects of Periodic Review (P) Systems
* Fixed interval reorder system (order once a week or month)
* Q may vary with each order
* IP reviewed periodically instead of continuously, new order after every review
* TBO (Time Between Orders) fixed at P
* Q may vary with each order
* IP reviewed periodically instead of continuously, new order after every review
* TBO (Time Between Orders) fixed at P
45
New cards
Periodic Review → Only check your inventory position after every P time periods…
Always place an order of size Qt = T - IPt
46
New cards
Comparatively, P Systems (single-bin system)
* convenient to administer
* orders may be combined
* IP only required at review
* orders may be combined
* IP only required at review
47
New cards
Comparatively, Q Systems (two-bin system)
* individual review frequencies
* possible quantity discounts
* lower, less-expensive safety stocks
* possible quantity discounts
* lower, less-expensive safety stocks
48
New cards
What is the average cost of inventory?
30-35% of product’s value (about 1/3)
49
New cards
Examples of Pressures for High Inventory
Customer Service/On-Time delivery, Quantity discounts, Transportation costs, Setup & Ordering costs, Supplier’s prices about to increase
50
New cards
Examples of Pressures for Low Inventory
Pilferage (stealing), Storage and handling costs, Obsolescence (becomes obsolete soon, short product lifetime), Interest or opportunity cost, Insurance on assets, End of year taxes
51
New cards
Is inventory bad?
Not necessarily
52
New cards
Physical Inventory
Raw materials, component parts, work in process (WIP), finished goods
53
New cards
Conceptual Inventory
1. Cycle Inventory
2. Safety Stock Inventory
3. Anticipation Inventory
4. Pipeline Inventory
54
New cards
EOQ Assumption: Demand rate is ____
constant
55
New cards
EOQ Assumption: No constraints on ____
lot size (Q) --- any size Q is possible!
56
New cards
EOQ Assumption: Only costs are _____
holding (storing an item) and ordering (administrative costs)
57
New cards
EOQ Assumption: Decisions for items are _____
independent (no correlation between different products; we’re just ordering final products)
58
New cards
EOQ Assumption: No uncertainty in _____
lead time or supply
59
New cards
Lead Time =
Time between placing an order and receiving it
60
New cards
Lot sizing
Two Decisions:
1. When to order?
2. How much to order?
1. When to order?
2. How much to order?
61
New cards
Cycle Inventory
saw-tooth diagram (max Q units, min 0 units)
62
New cards
Safety Stock Inventory
Protects against uncertainties in demand, lead time, and/or supply
* Operations not disrupted
* Avoid customer service problems
__**Place order earlier than needed**__
* Operations not disrupted
* Avoid customer service problems
__**Place order earlier than needed**__
63
New cards
Anticipation Inventory
* Absorbs uneven rates of demand
* Predictable, seasonal demand patterns
* Anticipating supplier strike
* Stockpile during low demand
* Predictable, seasonal demand patterns
* Anticipating supplier strike
* Stockpile during low demand
64
New cards
Pipeline Inventory
Inventory moving from point to point in material flow system
* eg parts traveling on trucks (inbound)
* eg materials moving between operations (within plant)
* eg finished goods shipped to distribution center (outbound)
* eg parts traveling on trucks (inbound)
* eg materials moving between operations (within plant)
* eg finished goods shipped to distribution center (outbound)
65
New cards
ABC Analysis
Classifying inventory to best manage it
Class A: 20% of the items make up 80% of the total dollar value (TVs in the back; protect them)
Class B: 30% of the items make up like 25%
Class C: 50% of the items make up like 5%
Class A: 20% of the items make up 80% of the total dollar value (TVs in the back; protect them)
Class B: 30% of the items make up like 25%
Class C: 50% of the items make up like 5%
66
New cards
Holding cost _____ as Lot Size (Q) increases
Holding cost increases
67
New cards
Ordering cost _____ as Lot Size (Q) increases
ordering cost decreases
68
New cards
Total cost ____ as Lot Size (Q) increases
Total cost decreases initially, then increases (like a Nike swoosh)
69
New cards
EOQ Variables are
D = Annual Demand
Q = Lot Size
S = Cost of Setup Ordering Cost (?)
H = Holding cost
Q = Lot Size
S = Cost of Setup Ordering Cost (?)
H = Holding cost
70
New cards
Aspects of a Push System
* Production trigger is based on forecasts or desired inventory levels
* No bounds on inventory
* No bounds on inventory
71
New cards
When to use a Push system?
* Example: Convenient store (inventory has built up; waiting for you to buy it, based off of forecasts)
* Long setups (spread the costs over the course of the setup) & Variety of products (will have to produce an array of colors in batches to offer customers)
* Long setups (spread the costs over the course of the setup) & Variety of products (will have to produce an array of colors in batches to offer customers)
72
New cards
Aspects of a Pull System
* Production trigger is actual consumption of inventory
* Imposes a bound on inventory
* Eg. Kanban
* Imposes a bound on inventory
* Eg. Kanban
73
New cards
When to use a Pull system?
* Small setups & Few product lines
* Example: custom cakes
* Example: custom cakes
74
New cards
Kanban
Visual display to decrease throughput time e.g. must have 3 in your inbox, 0 in your outbox to start working (airplane example)
75
New cards
Idle time
sitting waiting for a unit
76
New cards
Cycle time
time in between finished goods getting off the assembly line
77
New cards
Supply Chain
Two or more parties linked by a flow of material, information, & money, often global in scope
78
New cards
Bullwhip
* order variation increases as you go upstream towards the supplier
* Supplier → M → R → Customer (looks like a bullwhip with the handle at the customer and the wavy end of variability is at the supplier)
* downstream is going → to the customer, upstream is going to the supplier
* Supplier → M → R → Customer (looks like a bullwhip with the handle at the customer and the wavy end of variability is at the supplier)
* downstream is going → to the customer, upstream is going to the supplier
79
New cards
Stockout
when you run out of a product, you will no longer be selling the product anymore
80
New cards
Backorder
Ran out of a product but eventually are going to fulfill the order
(cumulation of these would be a backlog)
(cumulation of these would be a backlog)
81
New cards
Center of Gravity
Determine x and y coordinates in the middle (may not be feasible right at this point but start there and go out)
x\* and y\*
example: where you pinpoint the starting point to the realtor
x\* and y\*
example: where you pinpoint the starting point to the realtor
82
New cards
Load-distance score
Select site that minimizes distances “loads” must travel
83
New cards
Horizontal Pattern of Demand
Data cluster about a horizontal line as time progresses
84
New cards
Trend Pattern of Demand
Data consistently increase or decrease
85
New cards
Seasonal Pattern of Demand
Data consistently show peaks and valleys
86
New cards
Cyclical Pattern of Demand
Data reveal gradual increases and decreases over extended periods
87
New cards
Time-Series Methods
1. Simple moving averages
2. Weighted moving averages
3. Exponential smoothing
88
New cards
Simple Moving Average
Simple;
Dt = actual demand in period t
n = total number of periods in the average
F t+1 = forecast for period t + 1
Dt = actual demand in period t
n = total number of periods in the average
F t+1 = forecast for period t + 1
89
New cards
Weighted Moving Average
* weights on historical demand (weight more recent demand more heavily, lowering
* more control
* Ft+1 = forecasted demand for period t + 1
* Dt = actual demand in period t
* Wi = assigned weight
* more control
* Ft+1 = forecasted demand for period t + 1
* Dt = actual demand in period t
* Wi = assigned weight
90
New cards
Exponential Smoothing
* forecasting software
* really strong results
* Ft+1 = forecasted demand for period t + 1
* Dt = actual demand in period t
* sigma = smoothing parameter
* really strong results
* Ft+1 = forecasted demand for period t + 1
* Dt = actual demand in period t
* sigma = smoothing parameter
91
New cards
Trend-Adjusted Exponential Smoothing
At = exponentially smoothed average of the series in period t
Tt = exponentially smoothed average of the trend in period t
sigma, Beta = smoothing parameters
Tt = exponentially smoothed average of the trend in period t
sigma, Beta = smoothing parameters
92
New cards
CFE
= Cumulative Forecast Error
*A measurement of the total forecast error that assesses the bias in a forecast.*
* if CFE is negative, we are overestimating
asses __**bias**__
*A measurement of the total forecast error that assesses the bias in a forecast.*
* if CFE is negative, we are overestimating
asses __**bias**__
93
New cards
MSE
= Mean Squared Error
* measure of variability
* Square Error = error ^2
*A measurement of the dispersion of forecast errors.*
* measure of variability
* Square Error = error ^2
*A measurement of the dispersion of forecast errors.*
94
New cards
Square Error
= error ^2
95
New cards
MAD
= Mean Absolute Deviation
* another indication of variability
* Absolute Error = ABS(Actual - Predicted)
A measurement of the dispersion of forecast errors.
* another indication of variability
* Absolute Error = ABS(Actual - Predicted)
A measurement of the dispersion of forecast errors.
96
New cards
Absolute Error
= ABS(Actual - Predicted)
97
New cards
MAPE
= Mean Absolute Percent Error
* average of the absolute percent errors; telling us amount of error relative to the size of demand
* Absolute % Error = (Absolute Error / ACTUAL DEMAND) \* 100%
* big deal to be off by 10 diamonds at a small jewelry store versus 10 cotton balls at a large manufacturing plant
* average of the absolute percent errors; telling us amount of error relative to the size of demand
* Absolute % Error = (Absolute Error / ACTUAL DEMAND) \* 100%
* big deal to be off by 10 diamonds at a small jewelry store versus 10 cotton balls at a large manufacturing plant
98
New cards
Absolute % Error
= (Absolute Error / ACTUAL DEMAND) \* 100%
99
New cards
Error
Difference between actual and predicted
100
New cards
Error relative to size of demand is related to _____
MAPE (Mean Absolute Percent Error)