StemUp: OCR A A level Physics 1.1: Practical skills assessed in a written examination
1/38
There's no tags or description
Looks like no tags are added yet.
Name | Mastery | Learn | Test | Matching | Spaced |
|---|
No study sessions yet.
39 Terms
What steps must you take before starting an experiment? (2)
- State a hypothesis predicting what will happen during the experiment and why you think that will happen. The hypothesis will be tested during the experiment.
- Carry out a risk assessment about dangers which you may be exposed to during the practical (e.g radiation exposure).
What is a hypothesis? (2)
- This is a prediction of what will happen during the experiment and why you think that will happen.
- The hypothesis will be tested during the experiment.
How should you set up the equipment for a practical? (3)
- Identify and choose the correct equipment for the practical being carried out (e.g Tuning Fork for measuring the speed of sound).
- Find the range and resolution of the equipment you are using. (e.g A ruler has a resolution of 1cm).
- Calibrate instruments to avoid systematic errors.
What is meant by the resolution of a piece of equipment? (1)
This is the smallest change in the input of the equipment that will change the reading. (e.g For a micrometer a change of 0.01mm in input will change the reading.)
What is meant by the range of a piece of equipment? (1)
This is the maximum and minimum possible readings of a piece of equipment. (e.g A 30cm ruler has a range of 30cm)
What is meant by calibration of equipment? (1)
This is where an instrument is configured so it will provide acceptable results when used in an experiment. (e.g Setting a mass balance to 0 before measurements so results are more accurate.)
How should you measure the results during a practical? (3)
- Measure the dependent and independent variables using the correct equipment and use proper technique to avoid any errors.
- Keep control variables constant to avoid errors.
- Take repeats of the data and calculate the mean to improve accuracy of results and reduce random error.
What is meant by independent and dependent variables? (2)
- Independent variables are the variables being changed during the experiment.
- Dependent variables are the variables that are measured during the experimen
What are control variables? (1)
These are variables which are left unchanged throughout the experiment.
How should you present measurements in our results? (2)
- Measurements must be given in the correct units (such as V for voltage or Ω for resistance).
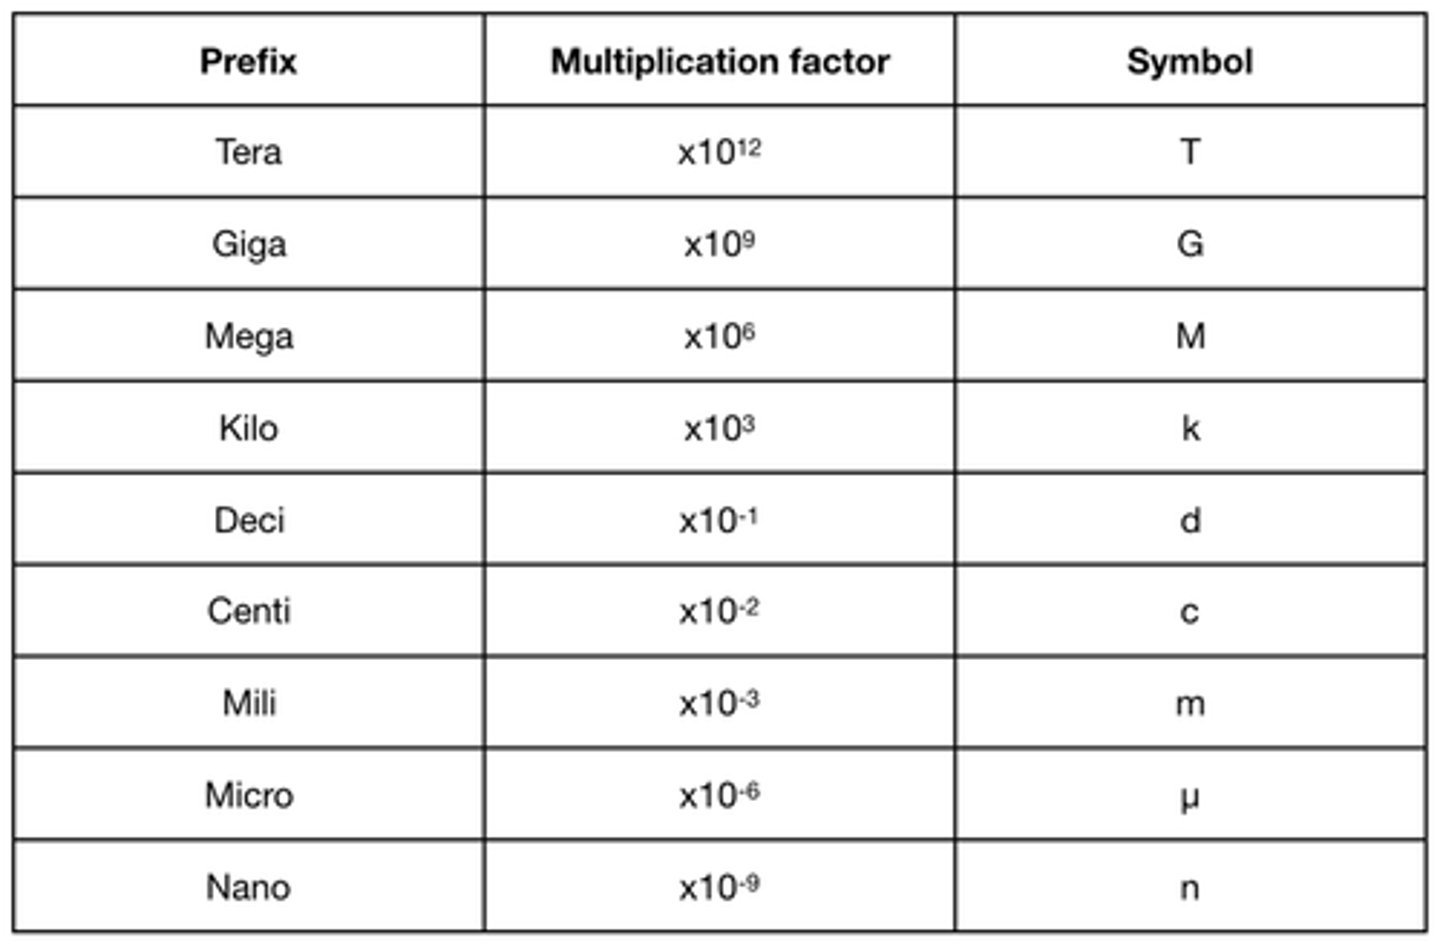
- Prefixes must be used to make the data clearer.
What are the different prefixes we can use for our measurements?
These make data much clearer and easier to read.
What are the different ways that data and observations can be presented? (3)
- Graphs (such as line graphs)
- Tables
- Charts (such as pie charts)
How must data and observations be presented? (3)
- In a table, the first column is for the independent variable and the second column is for the dependent variable. Further columns are used for calculations.
- In a graph, the independent variable is placed on the x-axis and the dependent variable on the y-axis.
- The significant figures for data should be consistent throughout.
What are the different types of data? (4)
- Quantitative data is data that is measured numerically (e.g length measurements.)
- Qualitative data is data that cannot be measured (e.g colour of a substance.)
- Discrete data is data which can only take a specific value (e.g number of objects.)
- Continuous data can take any value within a range (e.g weight of an object.)
What is quantitative data? (1)
Quantitative data is data that is measured numerically (e.g length measurements.)
What is qualitative data? (1)
Qualitative data is data that cannot be measured (e.g colour of a substance.)
What is discrete data? (1)
Discrete data is data which can only take a specific value (e.g number of objects.)
What is continuous data? (1)
Continuous data is data that can take any value within a range (e.g weight of an object.)
How should you process the results of an experiment? (1)
By plotting our results on a graph or inserting data into a table, they can become more meaningful and relationships between the data can be spotted. (e.g A negative correlation on a graph).
How should you analyse and interpret the results of an experiment? (2)
- We can interpret results quantitatively which uses numbers to describe the data and the relationships in the experiment.
- We can also interpret results qualitatively such as observations made during the experiment.
How should you find the mean of repeated results? (1)
We can find the mean using this equation: Mean = (sum of results) / (number of data points)
What are significant figures? (1)
These are digits of a number used to express it to a specific degree of accuracy. (e.g 1.57 is 3 significant figures and 0.001 is 1 significant figure)
How many significant figures should be used in results? (1)
The data taken should have the same number of significant figures as the resolution of the instrument used to obtain the data.
How are graphs used in data analysis? (1)
Graphs are used to display data and the relationships between them. They can be used to draw conclusions from the experiment.
What is a line of best fit and what is it used for? (1)
This is a line drawn on a scatter graph which is as close to as many points as possible. This allows physicists to determine which type of relationship the data shows.
What is meant by positive correlation? (1)
This means that when one variable increases in value, the other will also increase in value. (e.g As current increases, voltage increases in a filament lamp to a certain value.)
What is meant by negative correlation? (1)
This means that when one variable increases in value, the other will decrease in value.
What is meant by no correlation? (1)
This is where there is no relationship between the two variables.
How should you analyse a straight line graph? (3)
- The equation of a straight line graph is y = mx + c
- c represents the y-intercept and tells us what the value of the dependent variable when the independent variable is equal to 0.
- The gradient tells us how much the dependent variable changes with a change in the independent variable.
How is the gradient of a graph calculated? (2)
- Draw a large triangle on the graph touching the line of best fit.
- Find the difference in y and difference in x.
- Use ∆y/∆x (change in y/change in x) to find the gradient
How should you conclude an experiment? (2)
- Form a conclusion with the data obtained during the experiment and whether it supports the hypothesis or not.
- Evaluate the experiment including sources of uncertainty (errors) which could have been reduced.
What are anomalous results? (1)
These are results that do not fit in with the trend of the data (e.g not fitting in with the line of best fit). When calculating the mean, anomalous results should be excluded.
What is meant by precision and precise results? (1)
This means that the results are close together in value around a certain mean value. However it does not mean the results are accurate.
What is meant by accuracy and accurate results? (1)
- Accuracy is how close a measurement is to the true value.
- Accurate results are results that are close to the true value of the experiment.
What is meant by uncertainty in experiments? (1)
The uncertainty is the bounds in which the true value is expected to lie in.
For example if we measure the voltage to be 7.5V ± 0.2V the true value will lie between 7.3V and 7.7V.
What are the different types of uncertainty found in experiments? (3)
- Absolute uncertainty.
- Fractional uncertainty.
- Percentage uncertainty (also called percentage error)
What is meant by absolute uncertainty? (1)
This is where the bound of uncertainty is given by set numbers. (e.g 7.5 V ± 0.2 V)
What is meant by fractional uncertainty? (1)
This is where the bound uncertainty is given as a fraction of the measurement. (e.g 7.08 V ± 1 \ 20 V)
What is meant by percentage uncertainty (also called percentage error)? (1)
This is where the bound of uncertainty is given as a percentage of the measurement. (e.g 7.12 V ± 8.5%)