Unit 1- Maps
0.0(0)
Card Sorting
1/10
Earn XP
Description and Tags
Thematic maps and Map projections
Study Analytics
Name | Mastery | Learn | Test | Matching | Spaced |
|---|
No study sessions yet.
11 Terms
1
New cards
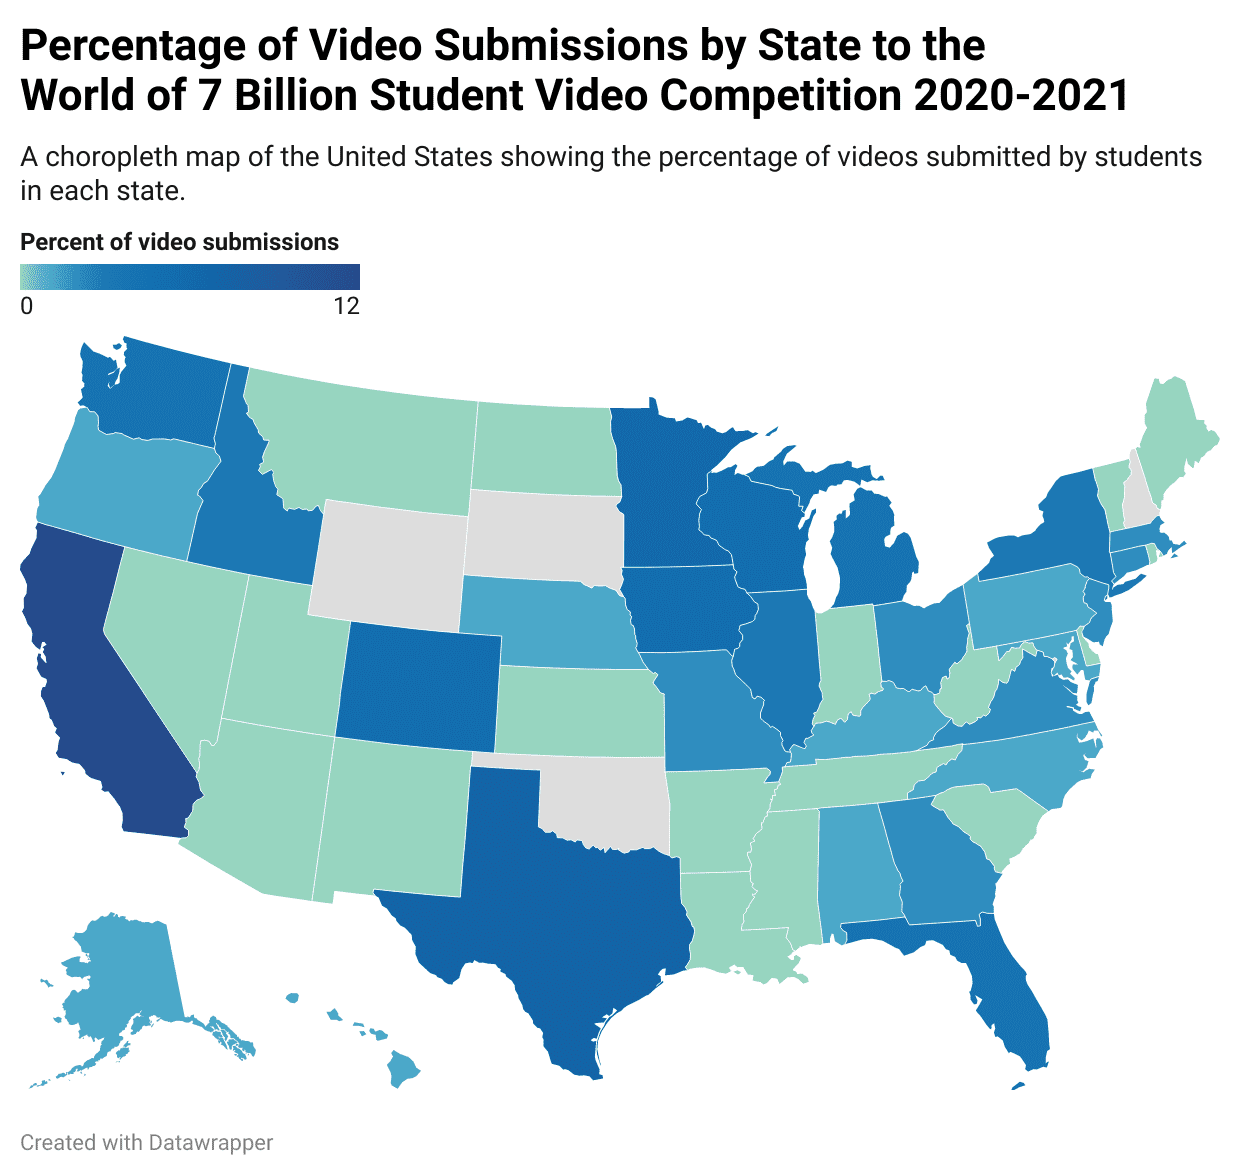
Choropleth Map
***Definition:*** Choropleth maps use different colors to display various data values.
***Positives:*** These maps can be used on large and small scales.
You can easily visualize an area’s data and make comparisons between places.
***Negatives:*** Maps do not go into greater detail about a place
These maps also have difficulty mapping data when regions are smaller.
To show the data, the map may be distorted.
2
New cards
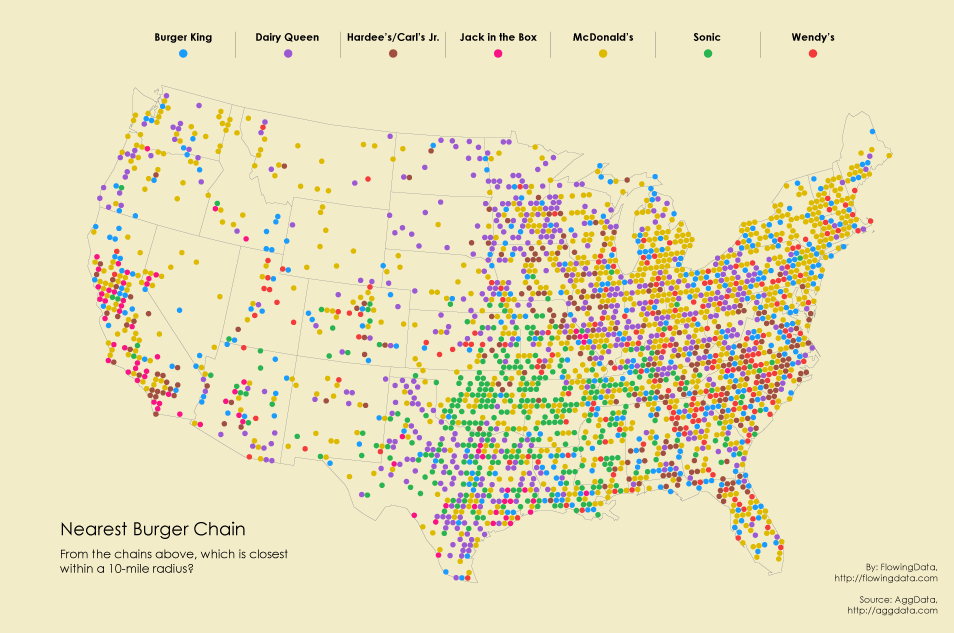
Dot Distribution Map
***Definition***: The maps use dots to represent bits of data
***Positives:*** You can easily visualize data and see the density of specific areas.
**Negatives**: The dots can be placed incorrectly or perceived wrong. This also makes it difficult to recognize where some regions are.
***Positives:*** You can easily visualize data and see the density of specific areas.
**Negatives**: The dots can be placed incorrectly or perceived wrong. This also makes it difficult to recognize where some regions are.
3
New cards
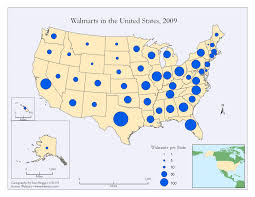
Graduated Symbol Map
***Definition:*** Maps use symbols of different sizes that correspond to their numeric values.
***Positives***: Easy to visualize and read.
The symbols are usually in correct place.
***Negatives:*** It can be hard to determine the exact values in specific places.
The maps can get messy with more data.
***Positives***: Easy to visualize and read.
The symbols are usually in correct place.
***Negatives:*** It can be hard to determine the exact values in specific places.
The maps can get messy with more data.
4
New cards
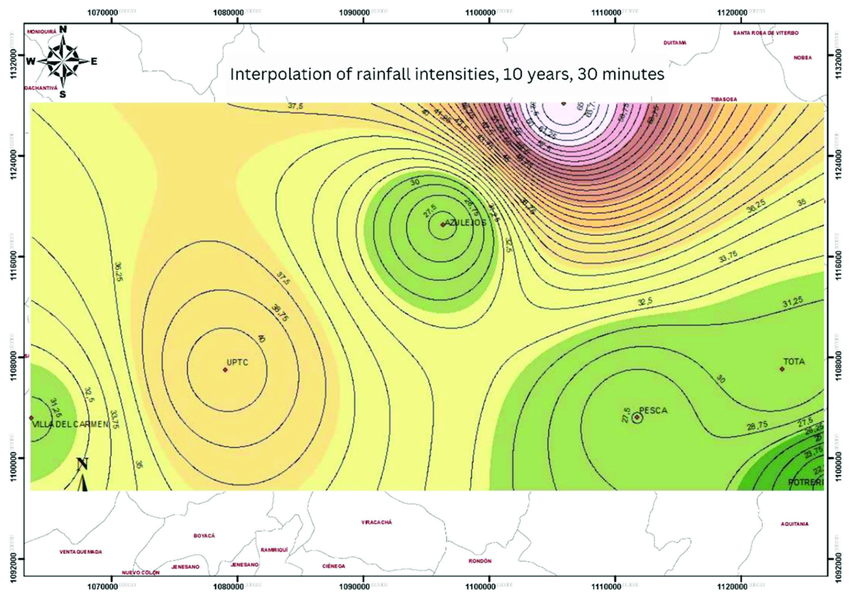
Isoline Map
***Definition:*** Isoline maps connect line to places that share the same value.
***Positives:*** Good for showing weather patterns, elevation, etc.
Used for analysis on larger scales
***Negatives:*** Doesn’t focus on one area, groups data together. (“too little detail”)
Can be difficult to tell which regions fall in specific categories.
***Positives:*** Good for showing weather patterns, elevation, etc.
Used for analysis on larger scales
***Negatives:*** Doesn’t focus on one area, groups data together. (“too little detail”)
Can be difficult to tell which regions fall in specific categories.
5
New cards
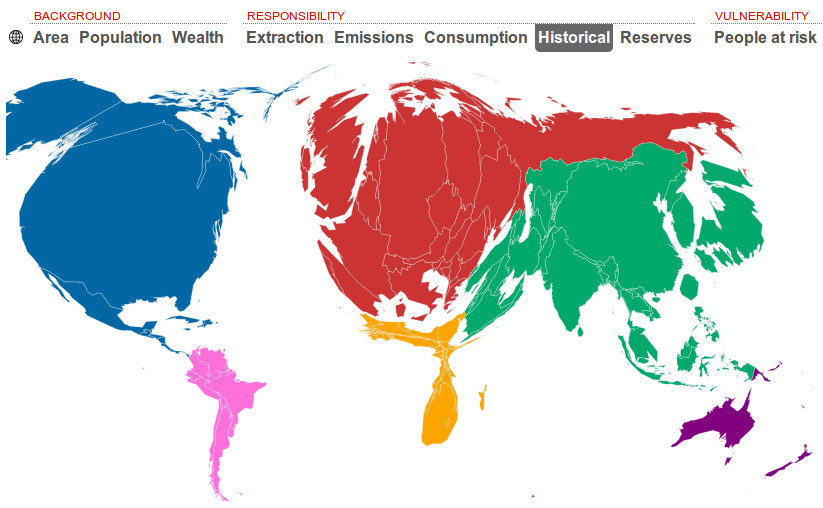
Cartogram Map
***Definition***: A map that distorts the geographical size of an area to represent the size of a variable.
***Positives:*** Clearly shows data.
***Negatives:*** Distorts shape and size, Unappealing
***Positives:*** Clearly shows data.
***Negatives:*** Distorts shape and size, Unappealing
6
New cards
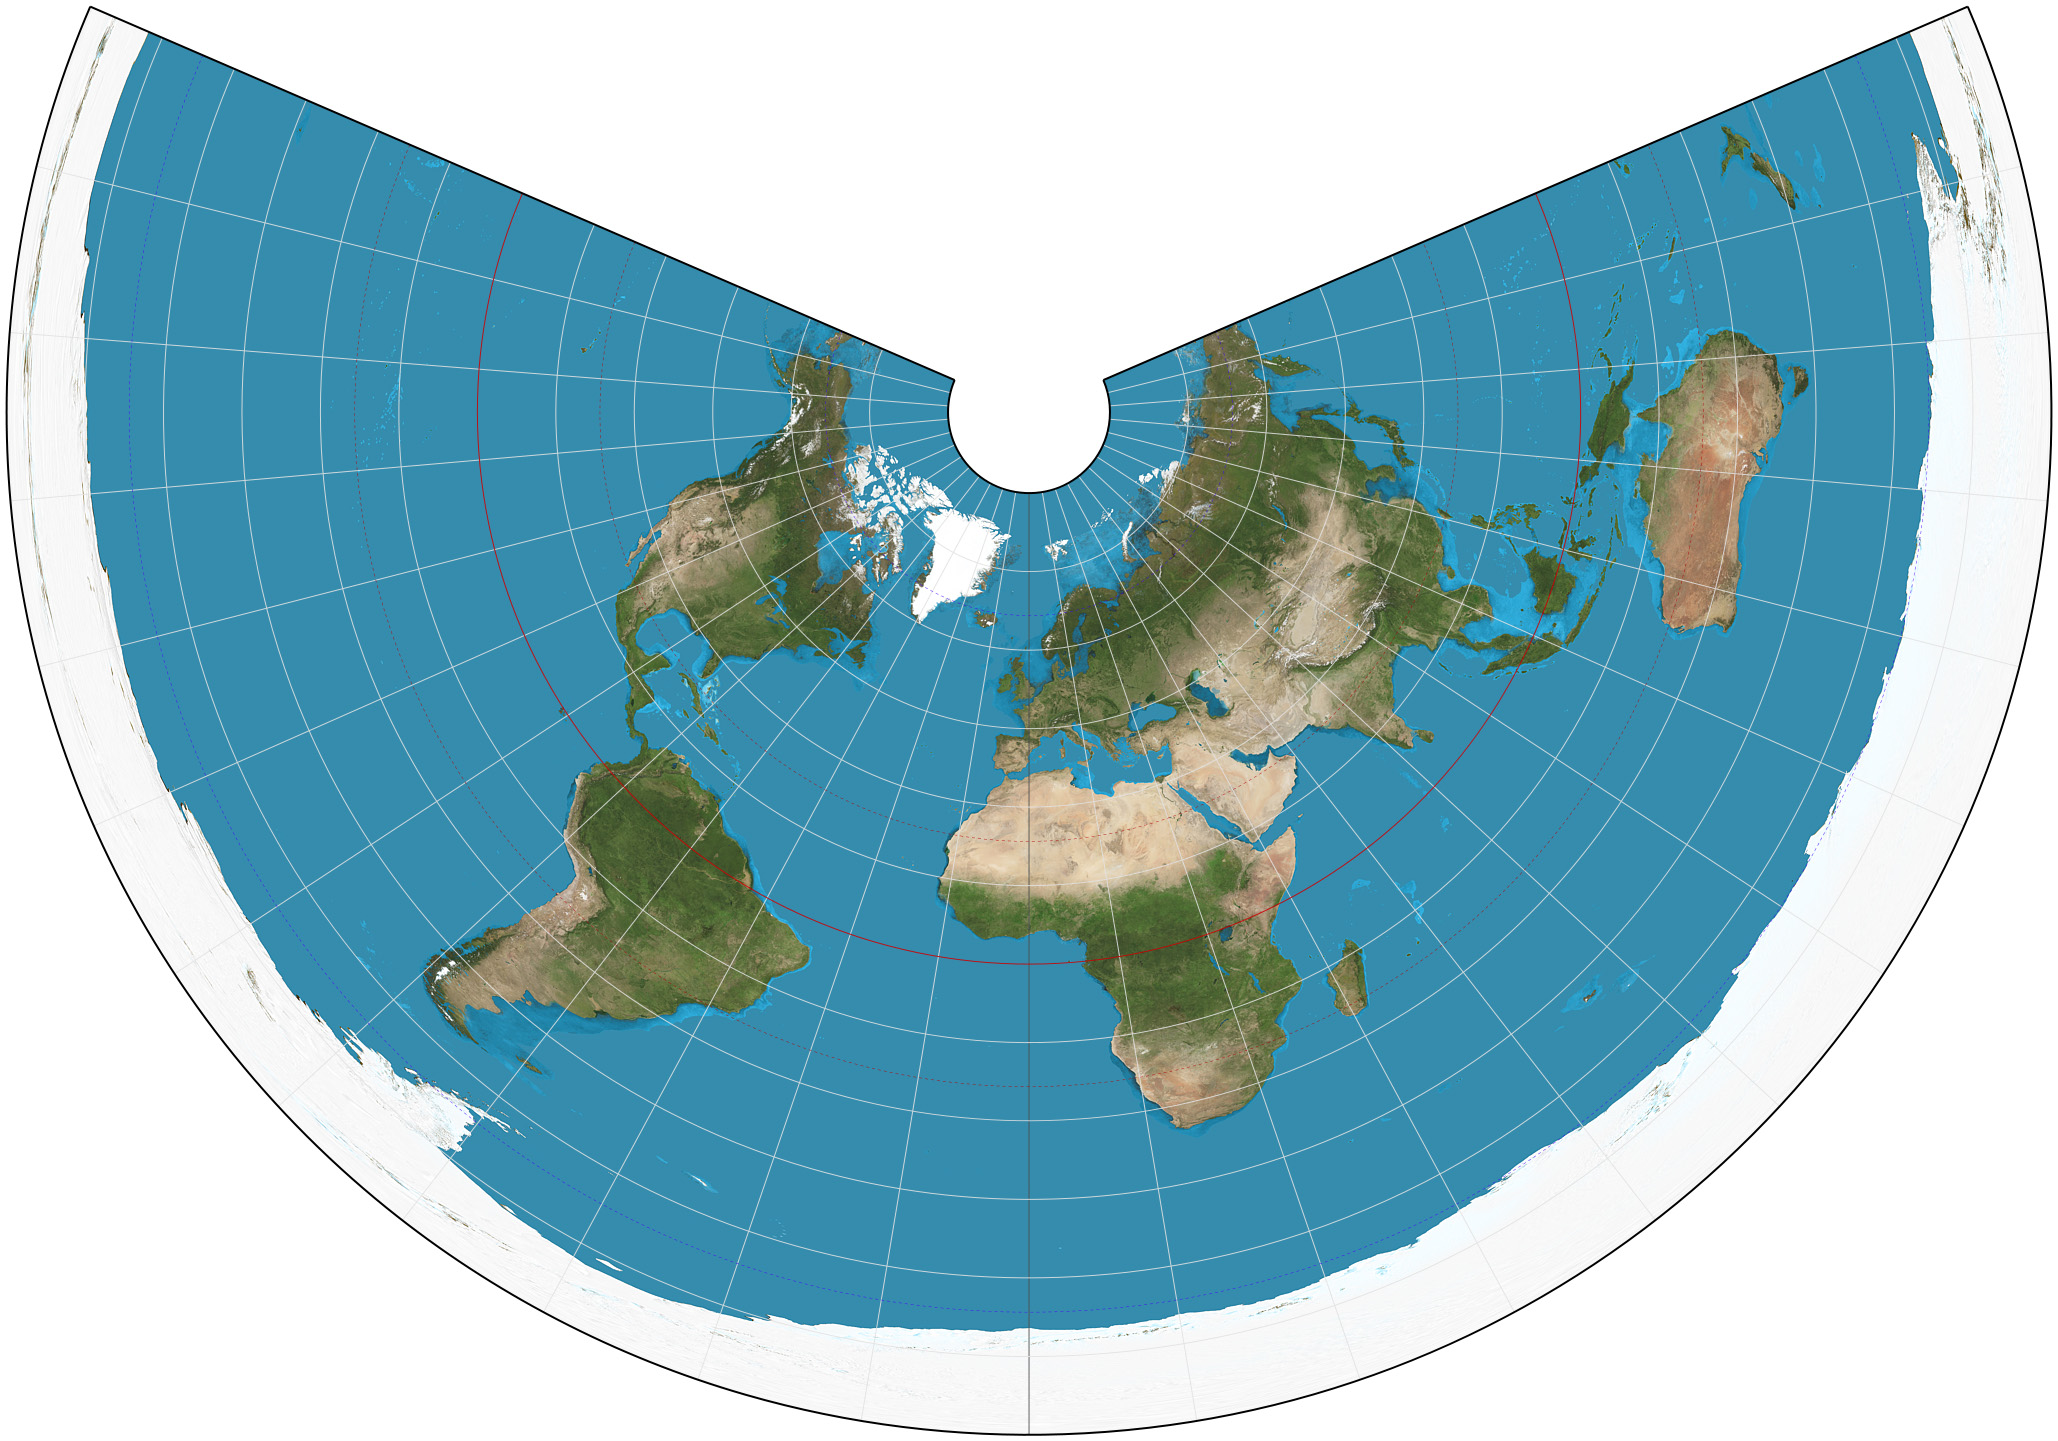
Conic Projection
***Definition:*** The Globe is projected onto a cone. The tip is over one of Earth’s poles.
***Positives:*** The shapes and distances are mostly accurate.
This projection preserves correct angles and directions in small areas.
***Negatives:*** The farther landmasses are from the poles, the more the distortion increases.
The shapes can be distorted because of the curved surface.
The entire cannot be shown on one map.
7
New cards
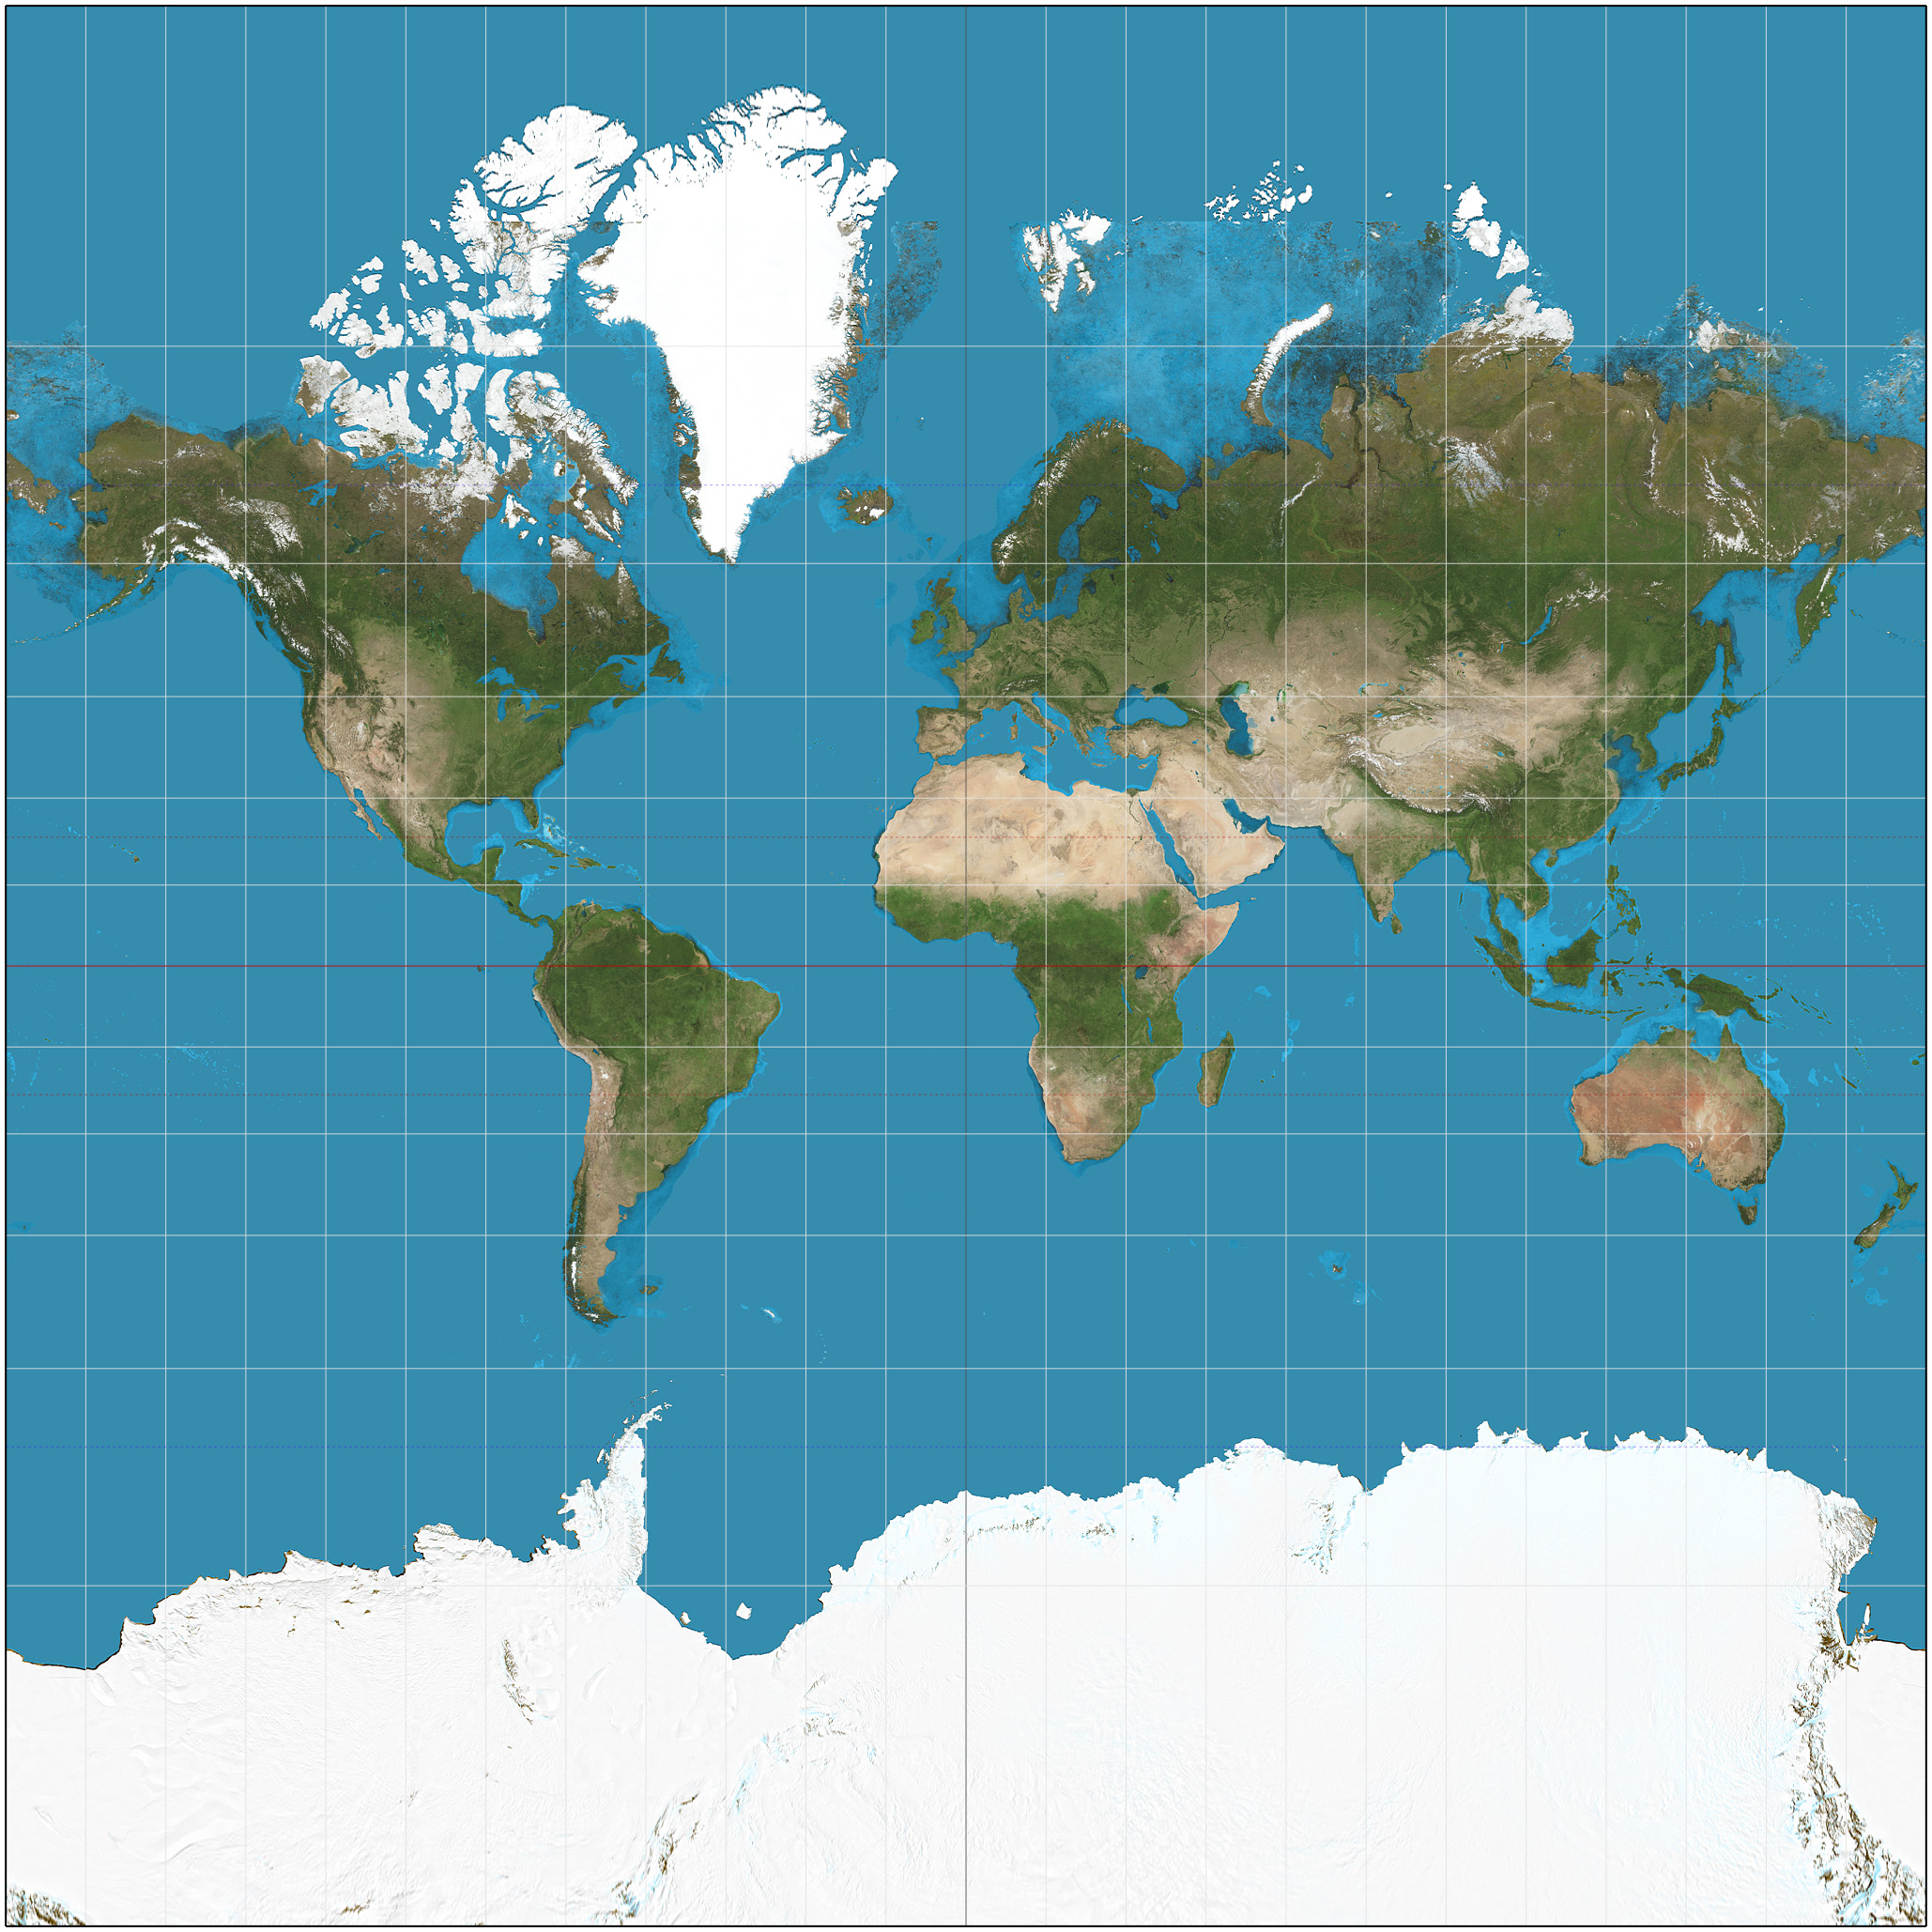
Mercator Projection
***Definition:*** Created by a cylindrical projection that is flattened. The latitude and longitude lines intersect at 90 degrees.
***Positives:***
Useful for navigation as shapes and angles are preserved.
***Negatives:***
Landmasses are larger the farther away they are from the equator which distorts distance and size.
***Positives:***
Useful for navigation as shapes and angles are preserved.
***Negatives:***
Landmasses are larger the farther away they are from the equator which distorts distance and size.
8
New cards
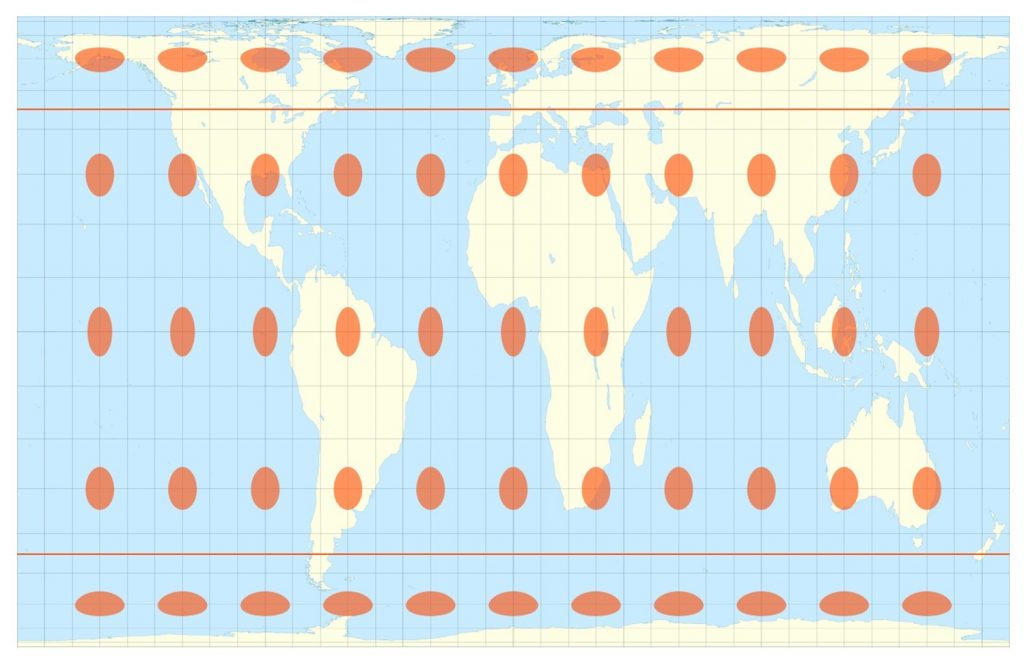
Gall-Peter Projection
***Definition:*** A map projection that shows all landmasses with their true areas while distorting their shapes.
(Equal area and a cylindrical projection.)
***Positives:*** Has accurate axes and proportions.
***Negatives:*** Shapes are distorted.
Difficult to navigate.
(Equal area and a cylindrical projection.)
***Positives:*** Has accurate axes and proportions.
***Negatives:*** Shapes are distorted.
Difficult to navigate.
9
New cards
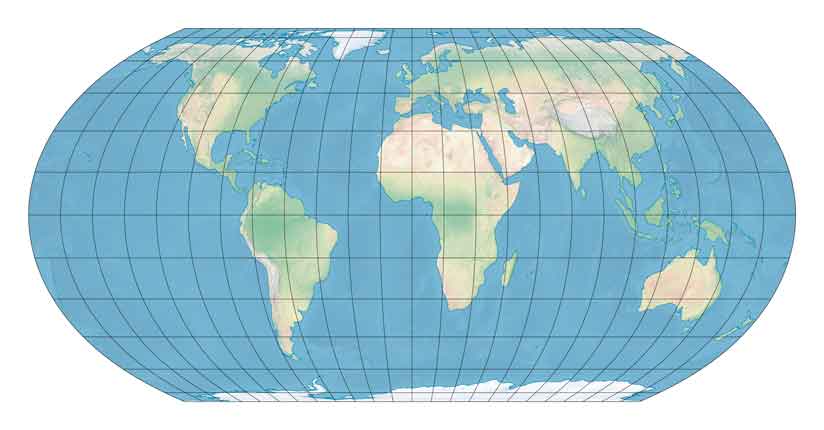
Robinson Projection
***Definition:*** Creates the most visually appealing map of Earth while keeping the sizes mostly accurate.
***Positives:*** Area and sizes are accurate.
Visually appealing display that Earth is a sphere.
***Negatives:*** Landmasses farther east or west of the prime meridian are curved toward the prime meridian while landmasses farther north or south of the equator are enlarged. (Compass directions are distorted)
The map is not equidistant; there are no points where all distances are shown correctly.
\
10
New cards
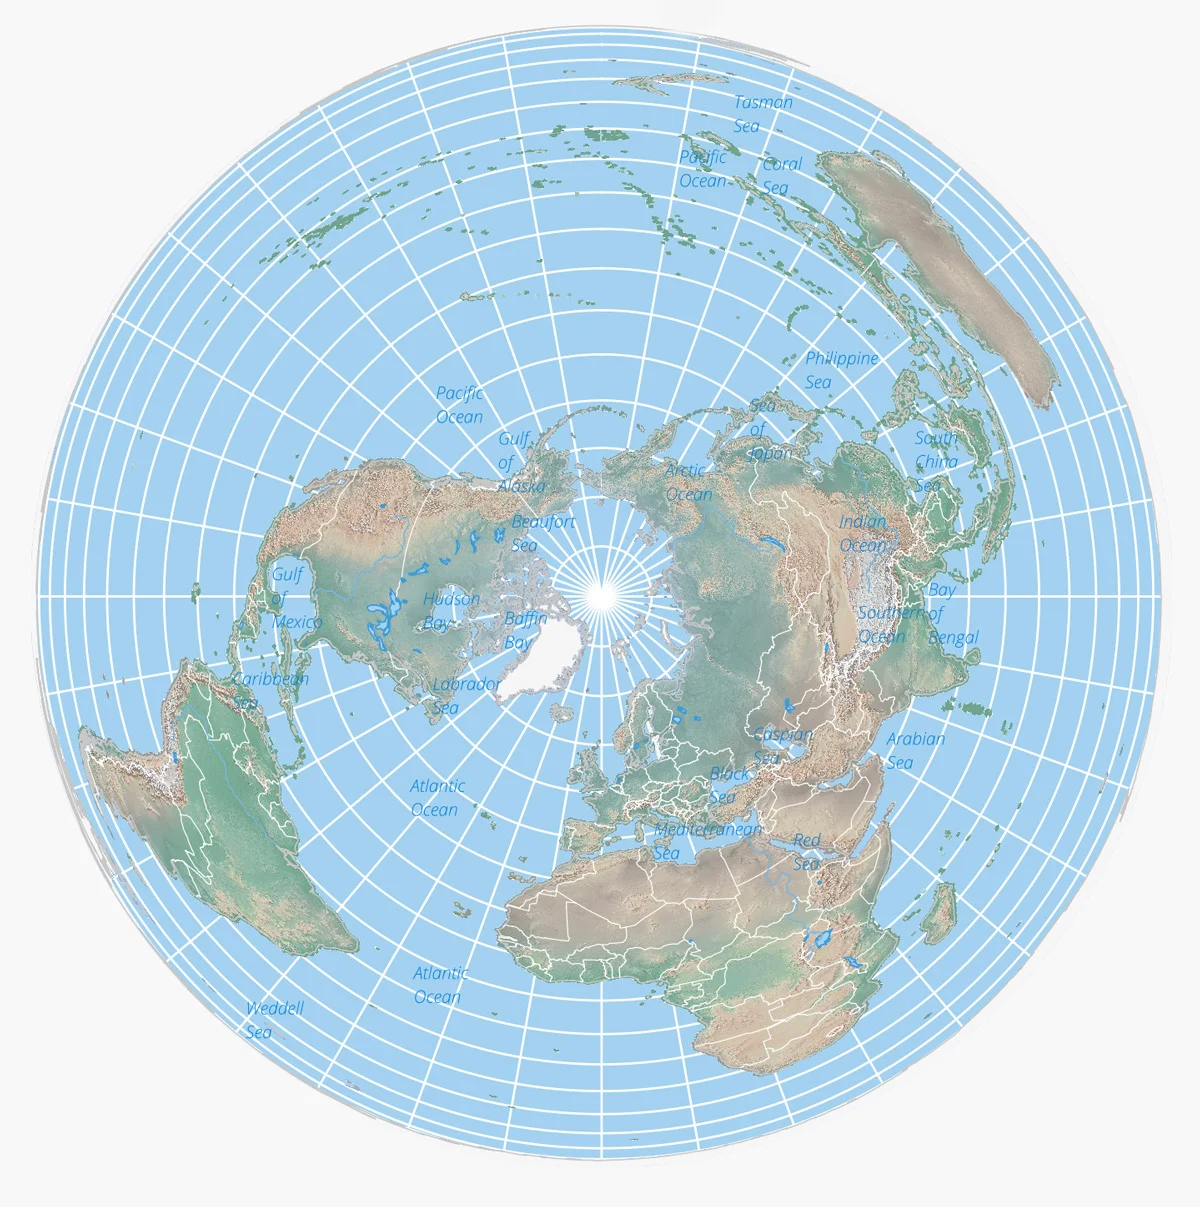
Azimuthal Equidistant Projection
***Definition:*** These maps are created from the perspective of looking down at Earth from one of the poles.
The distance from the center to any point on the map is the shortest possible distance and can be measured to scale.
***Positives:*** Distances from the center point will always be accurate.
***Negatives:*** Distances between points where one is not the center will be inaccurate.
The map is distorted further from the center.
11
New cards
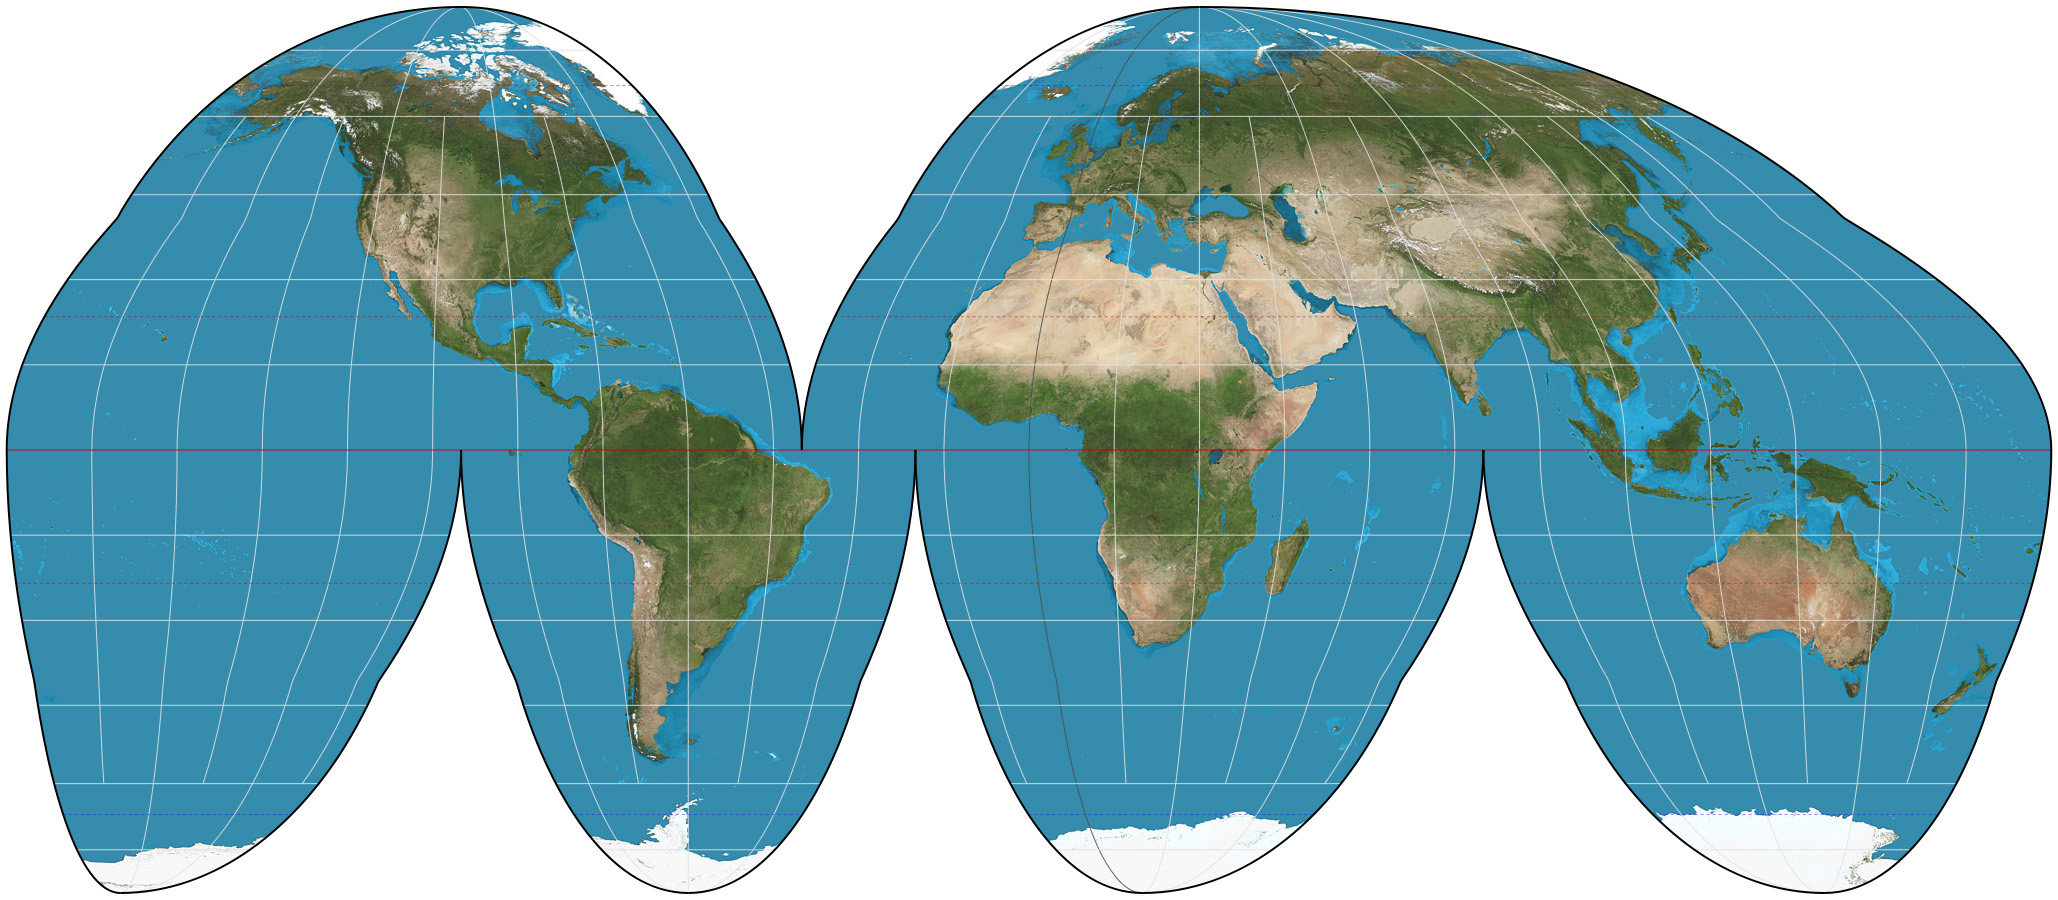
Goode Homolosine Projection
***Definition:*** Avoids region distortion by having interruptions.
***Positives:*** Regions sizes are accurate.
***Negatives:*** Splits the oceans apart
Distance and direction are inaccurate
Unappealing
***Positives:*** Regions sizes are accurate.
***Negatives:*** Splits the oceans apart
Distance and direction are inaccurate
Unappealing