Exercises + exams
1/24
There's no tags or description
Looks like no tags are added yet.
Name | Mastery | Learn | Test | Matching | Spaced | Call with Kai |
|---|
No analytics yet
Send a link to your students to track their progress
25 Terms
If you are given the following charts, what can you say about the different cookie departments
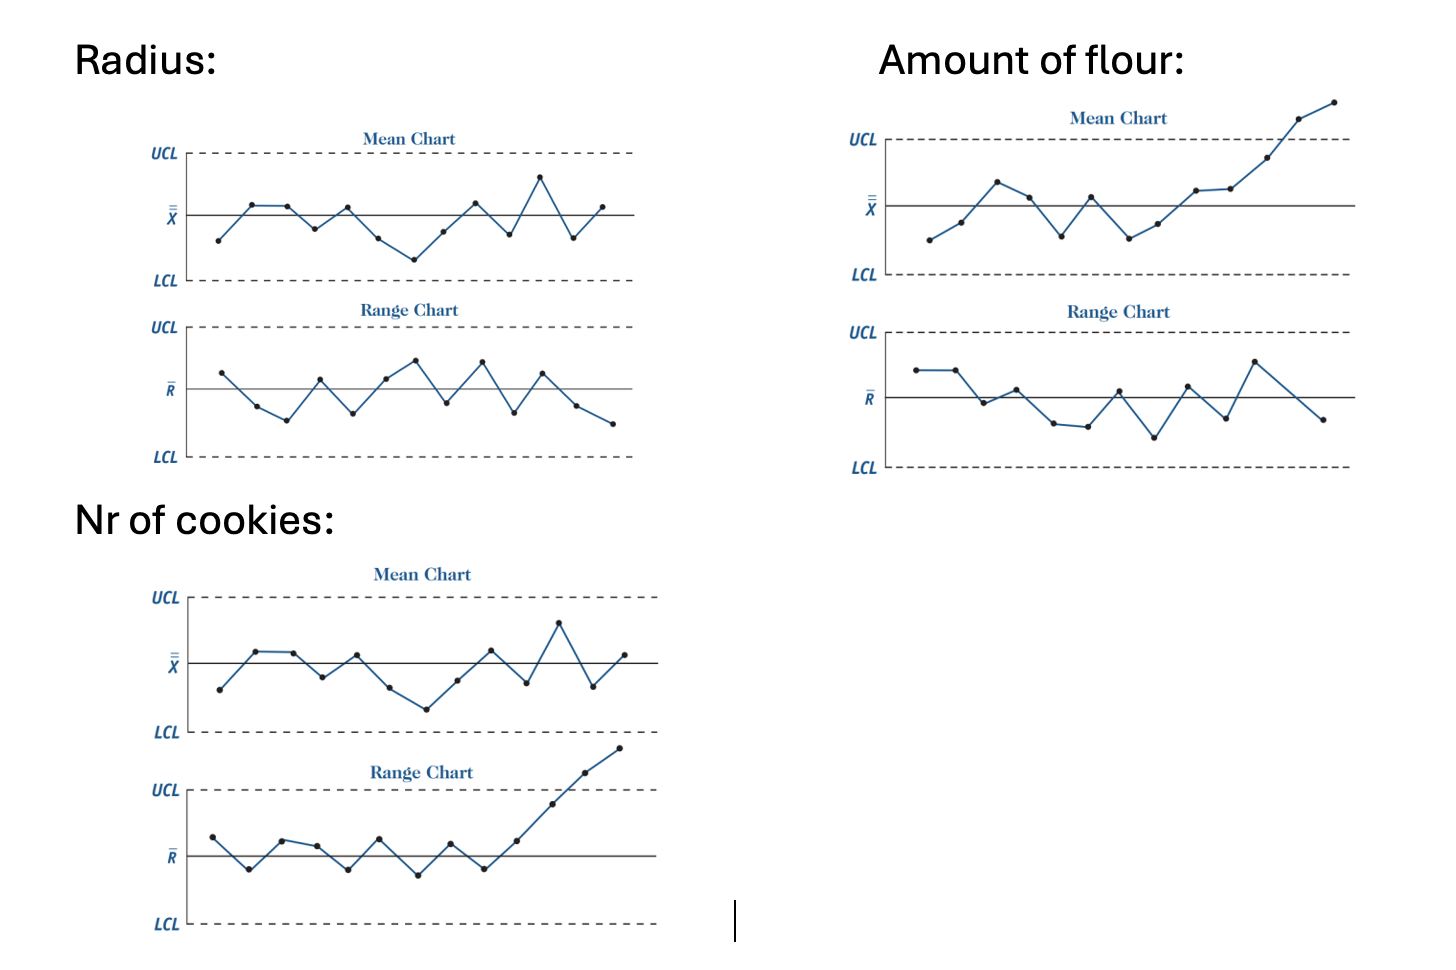
Radius: Inside the bounds —> holding the right quality
Flour: The weight of the cookies increases since the X-chart is out of bounds but since the R-chart is within the bounds, the weight increases for every sample in the group.
Nr of cookies: Same amount of flour in the cookies but each batch have varying sizes since the R-chart is out of bounds.
What is the condition to use BPDF on this system?
Need to check that (A,C1), (A,C2) and (A,C3) are observable:
det(O)=[C CA CAn-1]T not equal to 0
rank (O) = n
What are the conditions for UIO?
rank (CBf)=rank(Bf)
[zI-A -Bf; C 0] shall not have invariant zeros. Check the determinant and wheter z is within the safety region. OR check wheter (C,A1) is detectable where A1=A-HCA, H=Bf([CBfTCBf]-1CBfT)
Suppose we have the following residual matrix. Now, suppose that the propagation time to detect a failure from each program is: for t(r1) = 3, t(r2) = 1 , t(r3) = 2. Suppose also that at tˆ program r2 fires. What is the logic to follow to identify which fault is acting on the system?
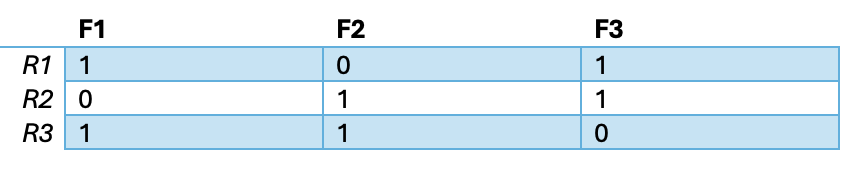
At t, r2 will fire so we know the fault is either f2 or f3.
If we wait one time step and see that r3 fires, we know that the fault is f2. If we wait another time step and see that r1 fires, we know the fault is f3.
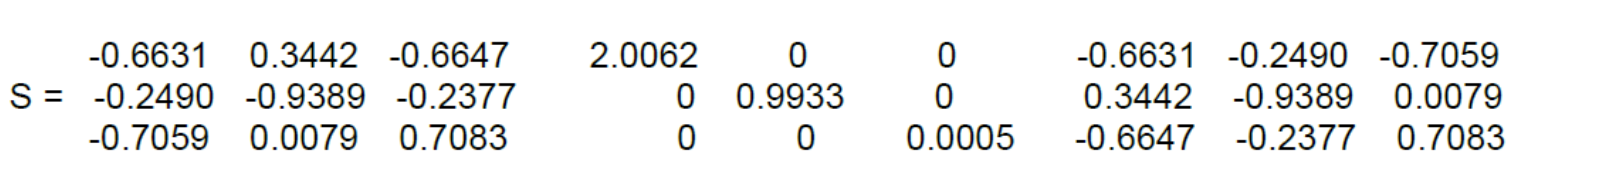
Suppose you have this SVD. Is there any principal directions?
In Lamda we see that we have two values that are larger than the third one. Hence we have two principal directions
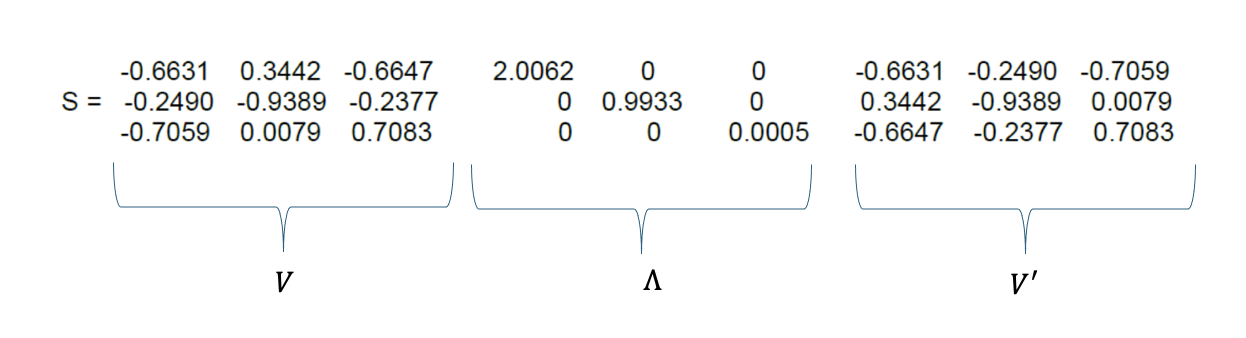
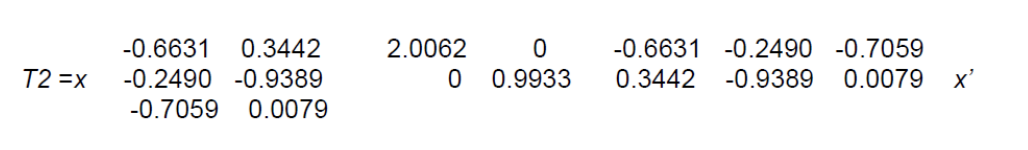
How can you reduce the size of the problem with the principal directions?
Since we had 2 principal components, we remove the third variance, this also means that we remove the third column of V and the third row of V’. The T2-distance for the reduced problem becomes:
Describe the experiments and the data to be collected to compute the Harris index
First we need to be able to describe the model as an ARMAX model.
We also need to know the delay and the variance of the noise as well as the number of coefficients for A, B and C.
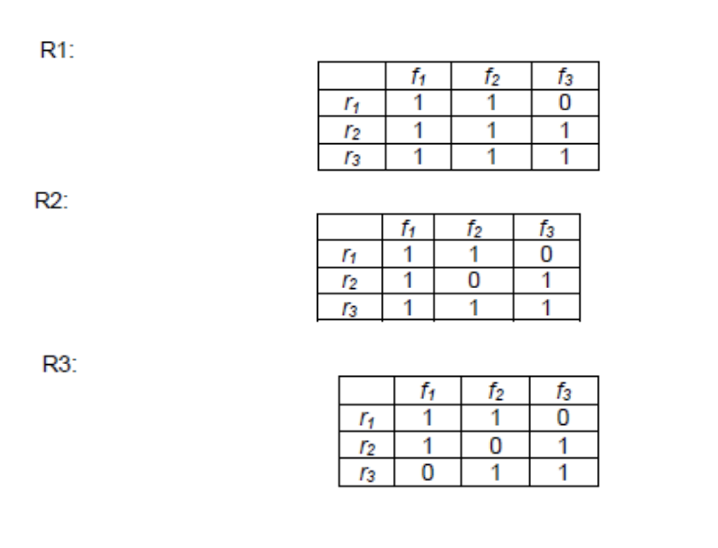
Consider these three residual matrices and determine if they are weakly or strongly isolating
R1: not isolating since two columns are the same
R2: Weakly isolating since all columns are different but by changing on element you can obtain another column
R3: Strongly isolating since you can’t obtain another column by changing one item.
Describe in general how do design a binary phase decision filter?
Split the outputs into groups
Check that (A,Ci) are observable
Design observers for each output
Define estimation errors
Define residuals
Construct a table with local and global residuals and check for fault detection and isolation.
Describe the structure of an UIO observer
What is the advantage of EWMA charts?
a new point at every new measure
More weight to more recent data
filtering action to smoothen the effect of measurement noise
What is a drawback with EWMA chart?
Correlation
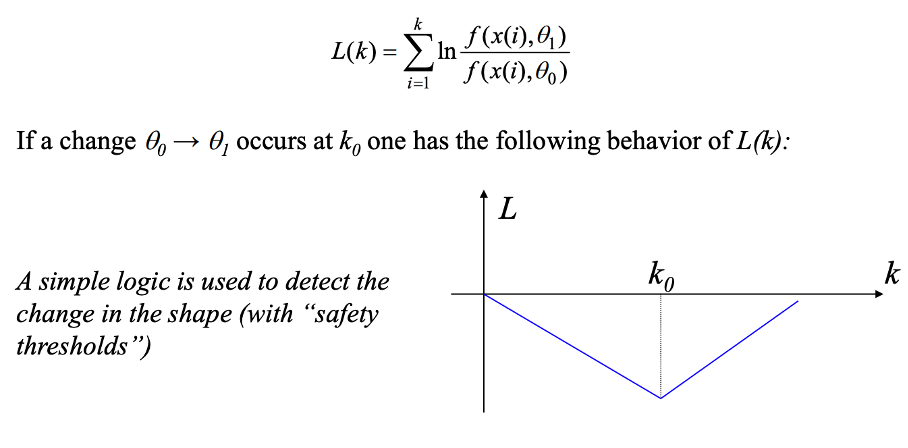
Describe the CUSUM algorithm and how to use it to detect the change of a parameter from its nominal value to a known one?
For every new timestep, the log-likelihood ratio is calculated. If there is a change in the parameter at that timestep, the log-likelihood will change value as well
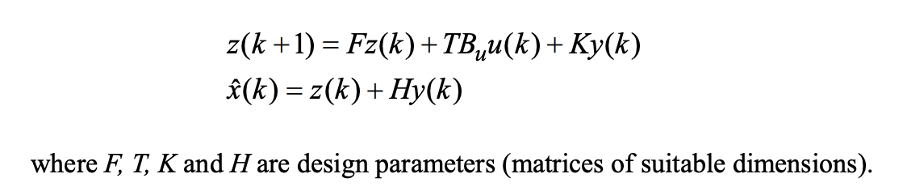
Describe what is a virtual sensor and how it can be obtained by the use of an observer.
If a sensor is in fault, we can use a virtual sensor.
The observer estimates the state and the idea is to reconstruct the missing output based on the estimated state to use instead of the measured output.
What is the effect of using a virtual sensor instead of a real on in a feedback control scheme?
Stability: The same of the nominal control law and of the observer (same eigenvalues)
Reference signal response: if e(0)=0 and d=0, e(k)=0 and the response is equal to the nominal one
Disturbance response: the observer dynamics influences the response also for e(0)=0, the response of the nominal system and of the system with the observer are not equal.
Explain how to select proper thresholds for the residual based on statistical considerations
With hypothesis testing you can check if the residual has zero mean (no fault) or not.
The thresholds for the residuals can either be selected with:
A fixed alpha which gives fixed thresholds z
Moving window where a random variable based on the vector of residuals and their covariance matrix has a chi2 distribution and is used to determine the thresholds for z.
Concisely decribe the X-R and X-S charts
For the X-chart you compute the mean for each group and then take the “mean of the means“ to get the centerline.
UCL = X+A2R
LCL = X - A2R
For the R-chart you compute the range (max-min) for each group then take the mean of ranges to get the centerline R.
UCL = D4R
LCL = D3R
For each new group you calculate the mean and range and see if they are inside the bounds or not.
X-s charts are the same as X-R charts but the standard deviation is used instead.
Describe the Harris Index and its use to assess the quality of a regulator
The Harris index is a value you want as close to 1 as possible since it determines how well the output variance of you controller correponds to the one of the minimum variance controller.
Describe the main idea behind the use of Support Vector Machines for fault detection and classification.
Support vector machines tries to separate datapoints by finding hyperplanes with aa big margins as possible to the support vectors which are the closest points to the hyperplane.
Many hyperplanes can be used but the best one is the one with the largest margin.
In this way we can separate classes as they have the largest margins from each other.
This can be used in fault detection if you for example have five classes and one is faulty.
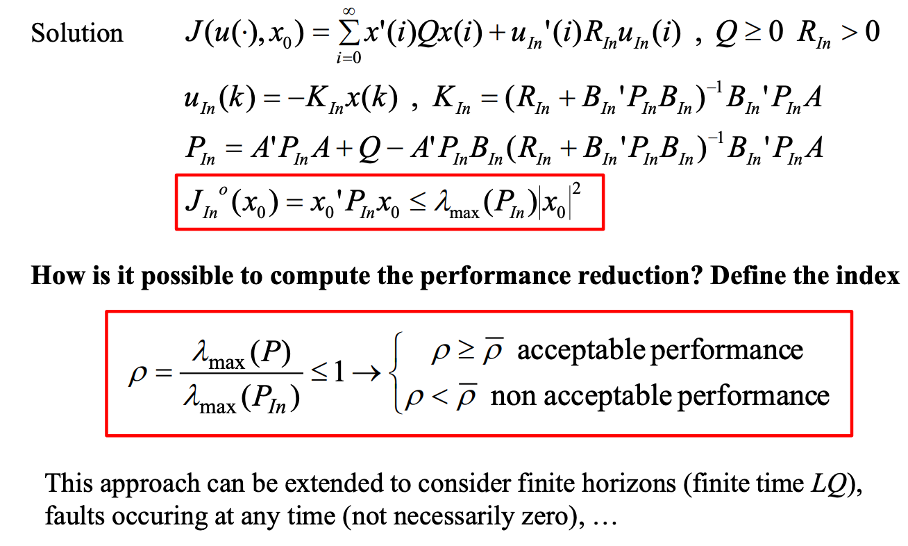
Discuss how to design with the Linear Quadratic method a control system tolerant to actuators faults. Show how to estimate the performance deterioration due to the fault of an actuator.
Actuators are put into two sets:
In (actuators working)
If (actuators in fault)
The LQ-formulas are used only for the actuators in the working set.
The performance deterioration can be computed by dividing the maximum lambda for all actuators with the maximum lambda for the subset of working actuators.
If that value is lower than the mean, it is not acceptable performance.
Why in some cases it is better to use the MA and EWMA charts instead of X-R charts?
Because then we don’t have to wait several timesteps to calculate for new groups. Then each new datapoint can be used to recalculate.
The drawback is that it introduces correlation.
Discuss how to select thresholds for establishing if secondary residuals are zero or one considering only the current primary residual or a set of past ones.
Define H0: mean=0 and H1: mean not equal to 0. Define an alpha which gives us thresholds z. If the residual is inside inside alpha, we accept it.
With moving window we have multiple past residuals which we compute the covariance matrix of. Then we can construct a random variable = R*Covariance*R’ which has a Chi2 distribution. With a given alpha we get our new z for this random variable.
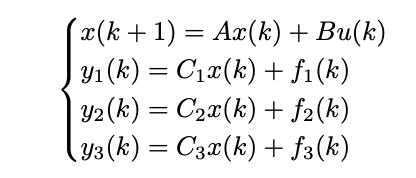
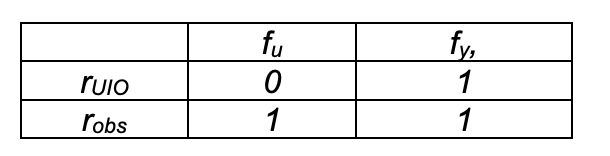
Show how to design a fault detection system with just an unknown input observer and a standard (Luenberger – pole placement) observer. Assume that all the required assumptions are fulfilled for UIO and standard observers, and only specify how to build a residual matrix with the two observers.
With UIO one can design a residual rUIO insensitive to the fault fu but a priori sensitive to fy. The residual robs of the Luenberger observer is in general sensitive both to fu and to fy, so that the residual matrix is
Assuming that fy1=0, with a proper choice f the design parameters, the system can be written in the z-transform as
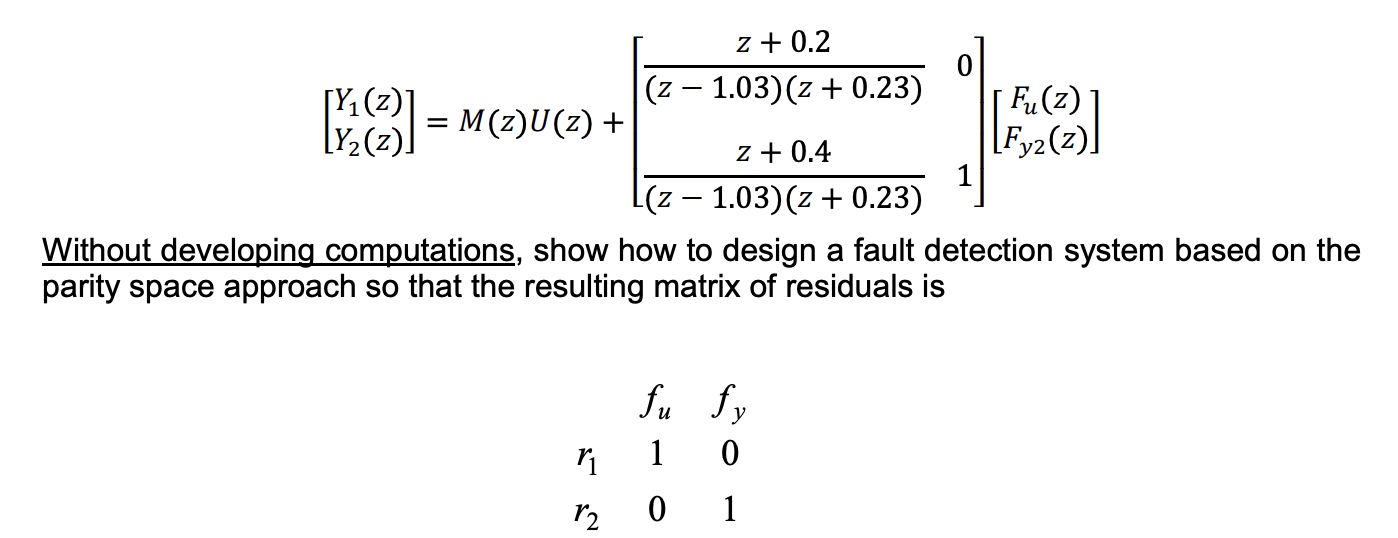
we must find a vector W(z)=Z(z)T(z)S-1(z) where T(z) must be chosen as a diagonal matrix of transfer functions such that T(z)S-1(z) does not contain unstable poles and transfer functions with more zeros than poles. Given that, two vectors Z(z) must be considered, each one equal to the row of the required residual matrix. Finally, the two secondary residuals are computed as Z(z)(Y(z)-M(z)U(z)).
Discuss how Kalman predictor and Anderson test can be used to detect the presence of one or more faults. Consider the possibility of using this method to isolate sensor faults and specify the logic to be used.