AP STATS UNIT FIVE
1/14
There's no tags or description
Looks like no tags are added yet.
Name | Mastery | Learn | Test | Matching | Spaced |
|---|
No study sessions yet.
15 Terms
normal random variables
X = context
X~N (mean, sd)
P(X > n) = P(z > (n-mean)/sd) = P(z > z-score)
normalcdf
L: z-score u: 1e99 mean: 0 sd: 1
P(x > n)= answer
normal random variables example problem
heights of young women have a normal distribution with mean 654 inches and standard deviation 2.7 inches. this is a distribution for a large set of data. Now choose one woman at random. (population, SRS)
probability that chosen woman is greater than 65 inches tall?
X = heights of women
X ~ N (64, 2.7)
P(X>65) = P(Z>(65-64/2.7)=P(z>.37)
normalcdf
L: .37 u: 1e99 mean:0 sd: 1
P(x>65)=.3357
combined normal random variables
add/subtract mean
sqrt (sd^2 + sd^2 +sd^2)
-> use these values to solve for z-score
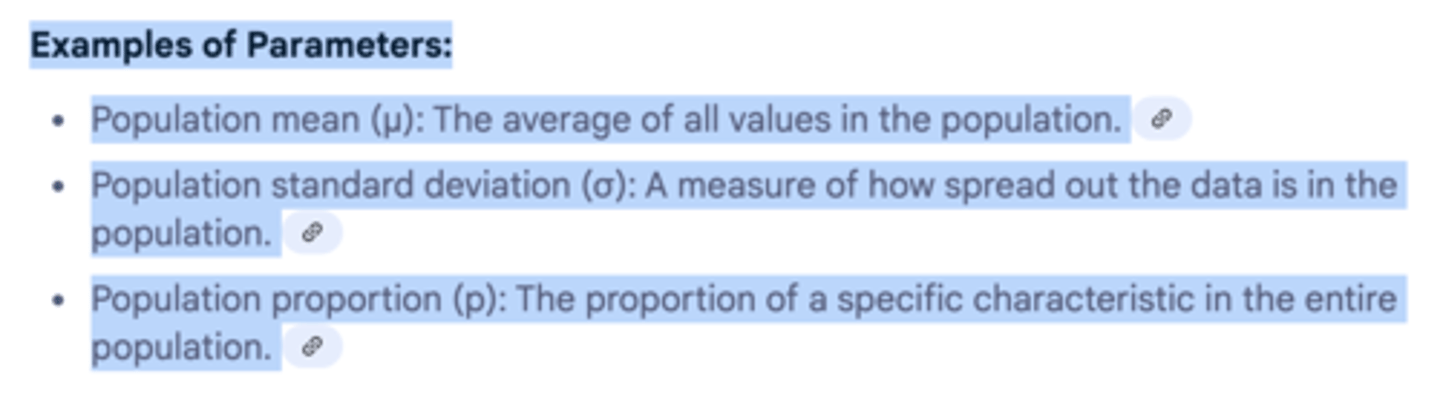
parameter
number that describes an aspect of a population
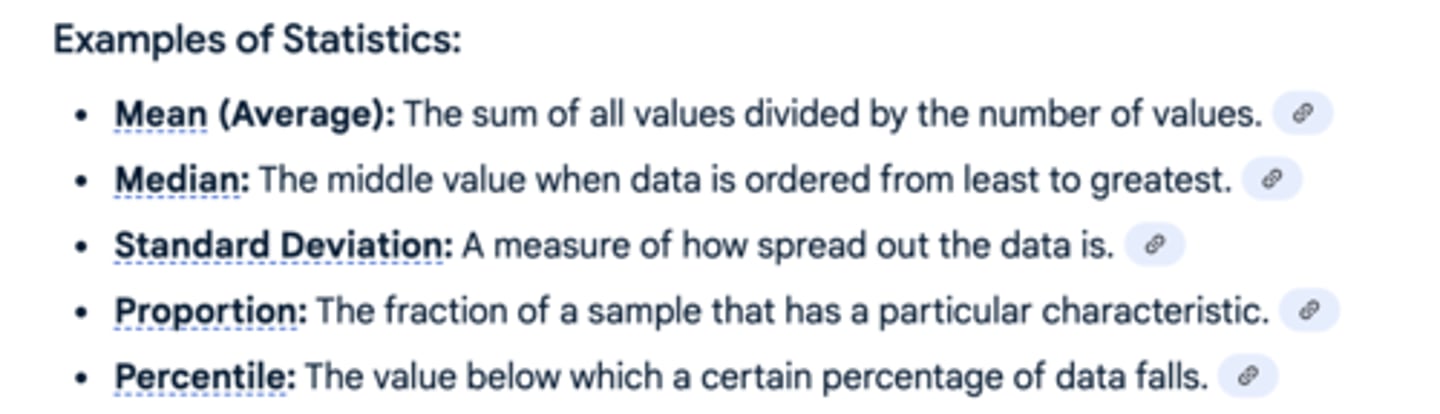
statistic
number that is computed from sample data often used to estimate unknown
ideal version is population distribution or sampling distribution?
population is ideal; sampling has sampling variability
p vs p hat
p = parameter
p hat = statistic
sampling distribution for a sample proportion
1. state
p = proportion of women who feel they do not get enough time for themselves
P(.45 <= phat <= .49)
n=1025
p=0.47
2. plan
random: random sample was taken
mean: .47
independent: 1025 <= .1(all adult women)
standard deviation = sqrt (p(1-p))/n
normal: np >= 10 n(1-p)>=10
3. do
phat ~ N (mean, sd)
P(stated) -> P(z-score)
normalcdf
sampling distribution for a sample proportion script
The probability that (context) will have a phat (context) is (answer). In the sample, the proportion that (context) is between (context with a probability of (answer)
sampling distribution for differences in proportion
1. state
equations for both
inequality relative to 0
2. plan
normal: do np for both
random: subtract means
sd: sqrt (p(1-p)/n) + (p(1-p)/n)
3. do
P(Pb-Pa > 0) when Pb-Pa ~ N(mean, sd)
P(z > z score)
normalcdf
conclusion for sampling distribution for differences in proportion
the probability that the proportion of context is higher/lower than context is (answer)
mean vs proportion
quantitative vs categorical
central limit theorem (30)
as sample size increases, the distribution of sample means of size n, randomly selected, approaches a normal distribution.
sampling distributions of sample means
same process, different formulas on formula sheet
conclusion: the probability that (context) is greater/below/between than (context) is (answer)
sampling distribution for differences in mean
same as the proportion one just look at formula sheet (idk i lwky gave up its like wtv atp