Correlations and linear regression
1/9
There's no tags or description
Looks like no tags are added yet.
Name | Mastery | Learn | Test | Matching | Spaced | Call with Kai |
|---|
No analytics yet
Send a link to your students to track their progress
10 Terms
Describe the uses of correlation analysis
Correlations = Used to evaluate exploratory data, to evaluate the relationship between two measured variables
Measures of correlation ask “what is the relationship between A and B?” or “Does A increase with variable B?”
Can be applied to paired observations on two different variables OR applied to one variable measured on two occasions
Ex: heart rate and level of exertion OR intelligence of a parent and child
Pairs of observations (X (independent) and Y (dependent)) are examined to see if they go “together”
Taller people tend to weight more than shorter people
Strong correlation = can infer something about the second value by knowing the first
Know how dependent variable is going to behave based on the independent
Does NOT equal causation
Could be a 3rd variable affecting results
Ex: number of churches in a city and crime & random correlation website
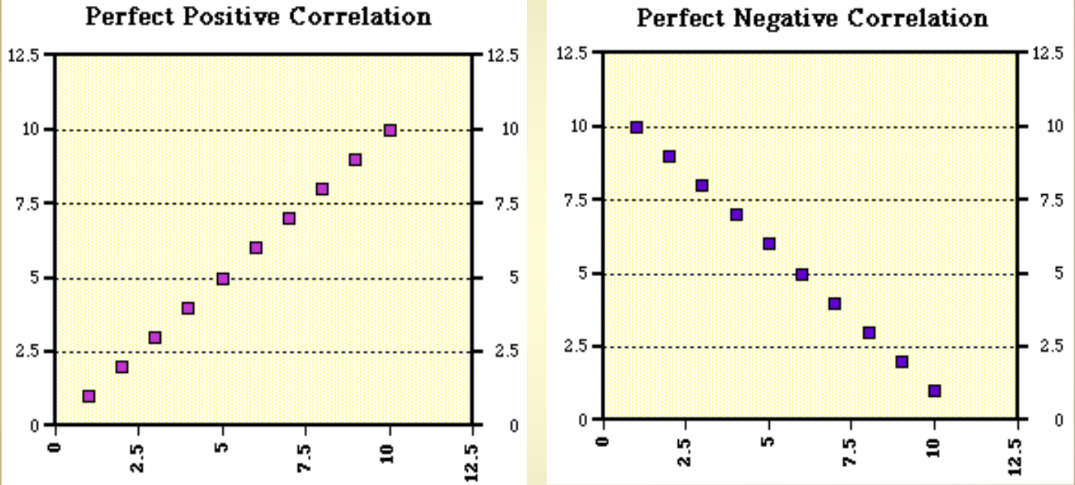
Perfect positive = X increases in the same amount as Y increases
Perfect negative = X increases in the same amount as Y decreases
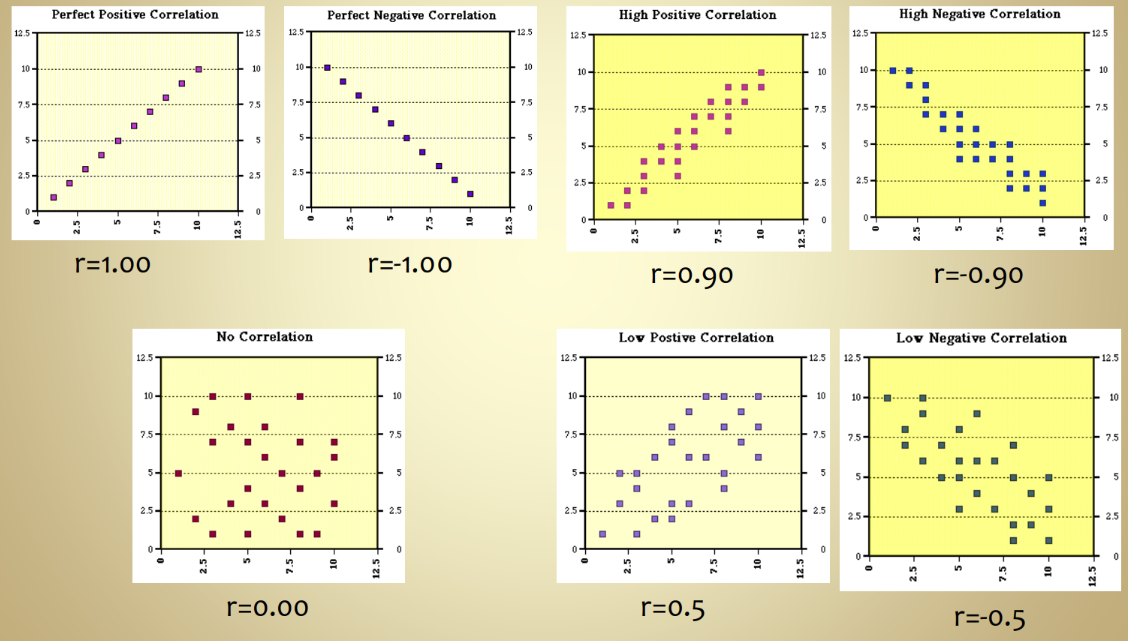
*Can estimate correlation by looking at whether graph is going up/down (positive/negative) or are close or spread apart (1.00 - 0)
Define the correlation coefficient
Correlation coefficient (r) = provides an index that is a quantitative measure of the relationship between 2 variables (also known as Pearson’s Product Moment Correlation Coefficient)
Ranges from –1.00 to +1.00
Magnitude of the correlation coefficient indicates the STRENGTH
Closer to 1 = STRONGER relationship
Closer to 0 = WEAK relationship (no correlation)
Closer to 0.5 = low correlation
Gives the magnitude of a relationship
The sign (+/-) indicates the direction of the relationship
Tells you that two sets of data are related in a proportional
DOES NOT PROVIDE INFORMATION RELATIVE TO THE DIFFERENCE BETWEEN SETS OF DATA (just that it’s stat. Diff. From 0)
Use t-test to infer similarities/differences
Only works with linear relationships
Integrate the value of the correlation coefficient with the shape and spread of a scatter plot
Scatter plots = each point represents the intersection of a pair of related observations
Have an X and Y axis
The closer the points are to the “straight line” = the higher the correlation (STRONGER RELATIONSHIP)
Ranges from –1.00 to +1.00
Magnitude of the correlation coefficient indicates the STRENGTH
Closer to 1 = STRONGER relationship
Closer to 0 = WEAK relationship (no correlation)
Closer to 0.5 = low correlation
Gives the magnitude of a relationship
The sign (+/-) indicates the direction of the relationship
Can estimate correlation by looking at whether graph is going up/down (positive/negative) or are close or spread apart (1.00 - 0)
There can be curvilinear relationships
Ex: anxiety level and performance
Linear correlation will be nearly 0 but the scatterplot will show a clear relationship (curved)
Differentiate between significance of a correlation and strength of a correlation
Significance of correlation (p-value) = Indicates that observed correlation is unlikely/likely due to chance
Is the correlation coefficient significantly different from 0?
Is the observed correlation a random effect or is it a good estimate of the population correlation?
DOES NOT mean there is a strong relationship
Can only indicate that it is NOT due to chance at the most
Sensitive to sample size
Large sample sizes = r of 0.20 will be considered significant
Small sample sizes = r of 0.45 will be considered significant
Less useful in a correlation analysis than the actual magnitude of the correlation
Look more at r value (than p) because all p-value says that it is statistically significant from 0
Does not provide information
relative to the difference between sets of data
Strength of correlation (r ) = tell you that two sets of data are related in a proportional way
Significance DOESN’T tell you anything about the difference between the sets of data
Describe the uses of linear regression analysis
Linear regression = an inferential procedure that draws conclusions about a population based on samples taken from that population
Uses relationship between variables as a basis for prediction
Draws the line of best fit (regression line)
Variable X (independent) = predictor variable
Variable Y (dependent) = criterion variable
Used for correlations less than 1.00
Interpret the parts of the straight line equation (define outliers and residuals)
Outliers = points that do not seem to fit with the rest of the scores
Lies outside the obvious cluster of scores
1 outlier alone can significantly alter the statistical description of the data
Don't remove from data UNLESS there’s a good reason
Measurement error
Linear regression equation: Y = mx + b
Y = predicted value of Y (dependent variable)
m = slope (rate of change)
x = value of independent variable X
b = Y-intercept (value of Y when X = 0)
Residuals = degree of error in regression line (residual value = difference between actual Y and predicted Y)
Points above/below the regression line (how far away are they from the line of best fit)
Define the coefficient of determination and compare it to the correlation coefficient
Coefficient of determination (r^2) = gives the percentage of the total change in Y scores that can be explained by the X scores
Measure of proportion
Ranges from 0.00 – 1.00 (NO NEGATIVE)
0 = no correlation
1 = high correlation
The amount of times you can account for Y based on X
Ex: 76% of change in blood pressure can be accounted by knowing the age
Therefore, 24% of the time, the change in blood pressure is due to an unknown/unidentified variable
correlation coefficient (r ) = measures the strength and direction of the linear relationship between two variables
CAN BE NEGATIVE
Define “extrapolation”
Extrapolation = using linear regression to predict Y beyond the range of your data set
SHOULD NOT DO THIS ON DATA
Because don’t know where the data will continue to go
Using linear regression to predict Y when you know X (“interpolation”) if it’s within the range of your data set (sometimes ok)
Explain the use of linear regression for a comparison of methods study (what is the comparison method)
Comparison of methods = uses linear regression to evaluate new procedures or equipment in clinical setting
Obtain data from both procedures, determine correlation, linear regression line
Old method = X-axis
New method = Y-axis
A “perfect” method agreement is:
Y= X
m = 1
b =0
r >0.99
Define the perfect method agreement for the straight line equation
Implies that the observed data points perfectly align with the calculated regression line.
A “perfect” method agreement is:
Y= X
m = 1
b =0
r >0.99