Quiz 2 Empirical Political Anaylsis
1/36
There's no tags or description
Looks like no tags are added yet.
Name | Mastery | Learn | Test | Matching | Spaced | Call with Kai |
|---|
No analytics yet
Send a link to your students to track their progress
37 Terms
Controlled Comparison
A comparison between groups or conditions made with the value of a potentially confounding variable held constant.
Compositional Differences
Differences in the groups being compared, which can affect research outcomes and distort estimated effect of a treatment (or another independent variable).
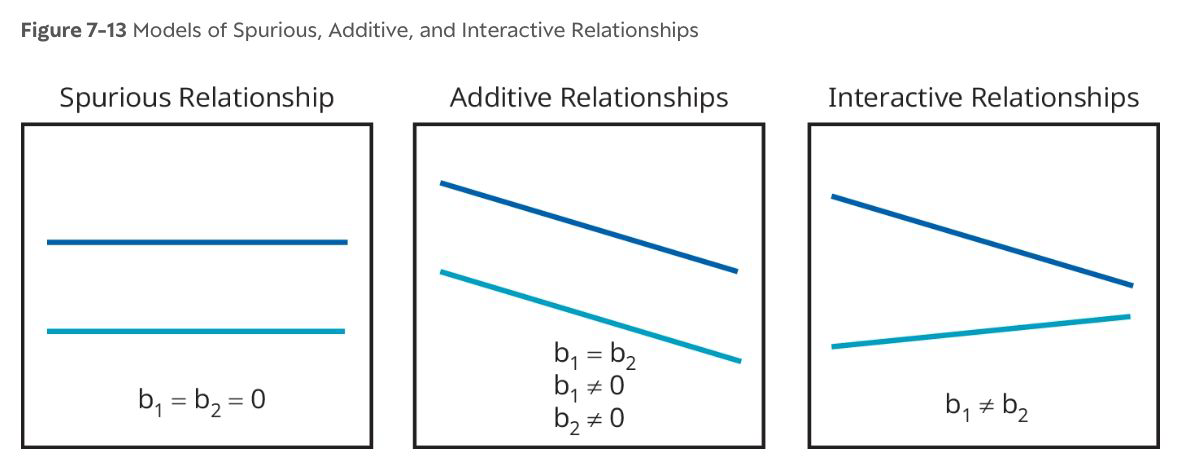
Spurious Relationships
The IV → DV relationship does not exist after controlling for a rival explanation.
Additive Relationships
The same IV → DV relationship is observed within each category of the control variable.
Interactions
Zero-order relationship
The initial relationship observed between variables without controlling for the effects of other variables; the raw association between variables.
Partial Relationship/Partial Effect
When we are doing a controlled comparison, we are only looking
at a subset of our data
Controlled Effect
The effect or contribution of an independent variable on the dependent variable within one constant value of a control variable.
Mean Comparison Table
Table that reports how the mean values of a DV change across categories of an IV; can also show standard deviations and counts.
Graphing Patterns for Relationships
Inferential Statistics
Procedures used to assess how well a descriptive sample statistic reflects a population parameter and to test hypotheses.
Population
Entire possible group
Sample
Selected from the population but does not include all members
Census
Data on the entire population
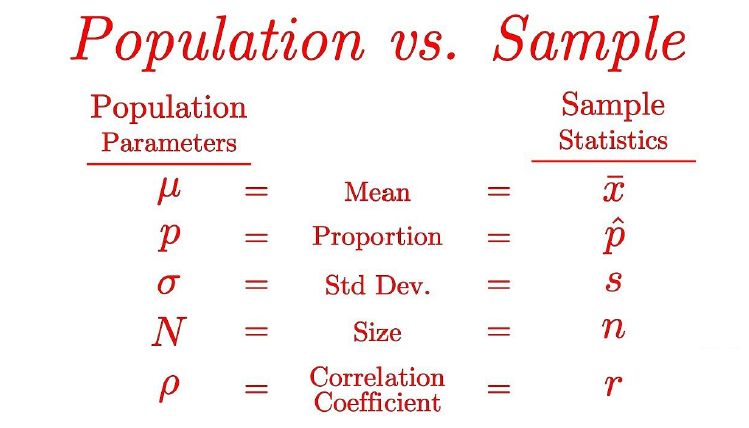
Population Parameter
Some characteristic or property of the population we are interested in
Sample Statistic
Estimate of the population parameter that you get from looking at a sample
Random sampling error
Possibility that through randomness you inadvertently get a really weird sample
Population vs. Sample Symbols
Central Limit Theorem
Statistical principle that the distribution of the sample mean will approximate a normal distribution, regardless of how variable values are distributed in the population from which samples are drawn, for sufficiently large samples.
Cumulative Density
The proportion (or percentage) of a probability distribution that’s at or below a given value in its range of possible values. A bell-curve distribution’s cumulative density function is an S-shaped curve.
Three things that influence how well sample statistics match the population parameter
Sample quality
Sample size
Variance
Standard Error
How much a sample statistic will vary, on average, when it is repeatedly estimated from random samples.
Confidence Interval
Measure of confidence for their sample statistic matching the population parameter - 95% is most commonly applied
Margin of error
Interval of reasonable uncertainty about a population parameter; the distance between sample statistic and upper or lower bound of confidence interval.
Test of statistical significance
A procedure to determine whether a hypothesis about a population parameter should be rejected based on sample data.
Five Steps to hypothesis testing
Propose a research hypothesis (which implies a null hypothesis).
Set the significance level (usually .05).
Estimate relevant population parameters using sample data.
Calculate the confidence interval or P-value.
Reach a conclusion about the null hypothesis.
Directional hypotheses
When the researcher hypothesizes that the IV has a positive or negative effect on the DV. Use one-tailed P-values with directional hypotheses.
Non-directional Hypotheses
Asserts a difference or effect but not its direction, evaluated with two-tail P-values.
Type 1 Errors
The error of rejecting a true null hypothesis, incorrectly concluding that there is a significant effect or relationship when one does not exist.
Type 2 Errors
The error of failing to reject a false null hypothesis, incorrectly concluding that there is no significant effect or relationship when one actually exists. Better to make this error than type 1
𝛂
Alpha - predetermined confidence level you require to reject the null hypothesis p < a you can reject the null hypothesis. If the CI is 95%, a is 0.05 which is a 5% chance of a type 1 error.
P-value
Probability of finding that result assuming the null is true. Ranges from 0-1. Ranges from least likely to most likely when p < a you can reject the null hypothesis
Confidence Interval
Range around mean/proportion where the population parameter can lie
Descriptive Hypothesis
Describes the proportion doesn’t speak to cause
Causal Hypothesis
Measures causal relationships
Error bar chart
Graph with line segments that represent uncertainty of estimates, typically indicating the range of values within which the true value is likely to fall.