AP BIO UNIT 1 (STATS)
1/16
There's no tags or description
Looks like no tags are added yet.
Name | Mastery | Learn | Test | Matching | Spaced | Call with Kai |
|---|
No analytics yet
Send a link to your students to track their progress
17 Terms
Null hypothesis (H0)
states that there is no statistically significant difference between two groups in a experiment.
Chi-Squared Test
a statistical test that is used to compare the observed results to the expected results in the experiment.
-used to evaluate the null hypothesis
-used in genetics problems
Chi-Squared Test Example
It would be appropriate to compare the number of purple flowers and the number of white flowers that resulted from genetic crossing but would not be appropriate if it was for percentages of those flowers
Chi-Squared Formula
Summation (Observed-Expected) squared/expected

Expected
prediction
Observed
what actually happened
Degree of Freedom (df)
defined as the number of possible outcomes in an experiment minus 1
Chi-Squared steps
Calculate Chi-Squared value using the formula
Determine the degrees of freedom
Use the degrees of freedom and the p-value and find the critical value in the chi-squared table
Compare Chi-Squared value to critical value
Based on comparison respond with either reject or fail to reject null hypothesis
P-Value
defined as the probability that the observed data would be produced by random chance alone
Fail to reject null hypothesis
Chi-Squared is less than or equal to critical value
Reject Null hypothesis
Chi-Squared is greater than the critical value
mean
average
median
middle
Standard Deviation
averages how far each data point is from the mean of the data set

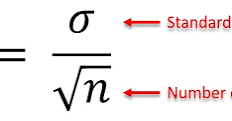
Standard error of the mean
measure of how spread out the data set is

sample size increases
standard error of mean decreases
95% confidence interval
if you repeated an experiment 100 times and calculated the mean of the data you collected each time, the mean would fall within the 95% confidence interval 95 of those 100 times.