Psychology Statistics
1/51
There's no tags or description
Looks like no tags are added yet.
Name | Mastery | Learn | Test | Matching | Spaced | Call with Kai |
|---|
No study sessions yet.
52 Terms
Sampling Error
Naturally occuring discrepancy between a sample statistic and the corresponding population parameter
Construct
Internal attribute that cannot be directly observed but is useful for describing and explaining behavior
Operational Definition
Procedure for measuring external behavior wherein the resulting measurements measure a hypothetical construct
Continuous Variable
Value which is divisible into an infinite number of fractional parts
Real Limit
Boundary of intervals for scores that are represented on a continuous number line
Upper Real Limit
Boundary at the top of the interval
Discrete Variable
Value consisting of separate, indivisible categories, wherein no values can exist between two neighboring categories
Lower Real Limit
Boundary at the bottom of the interval
Nominal Scale
Set of categories that have different names
Ordinal Scale
Set of categories that are unorganized in an ordered sequence
Experimental Method
Manipulating one variable while another variable is observed and measured
Control Condition
Group that either recieves no treatment or receives a neutral, placebo treatment
Experimental Condition
Group that receives the experimental treatment
Nonequivalent Groups Study
Score comparison method where the researcher does not control which participants go into which group
Quasi-independent Variable
Value that is used to create the different groups of scores
Pre-post Study
Method of using the passage of time to create the groups of scores
Statistics
Value that describes a sample, usually derived from measurements of the individuals in the sample
Descriptive Statistic
Procedure used to summarize, organize, and simplify data
Sample
Set of individuals selected to represent the population in a research study
Data Set
Collection of measurements or observations
Data
Measurements or observations
Inferential Statistics
Technique that allows one to make generalizations about the populations from which samples were selected
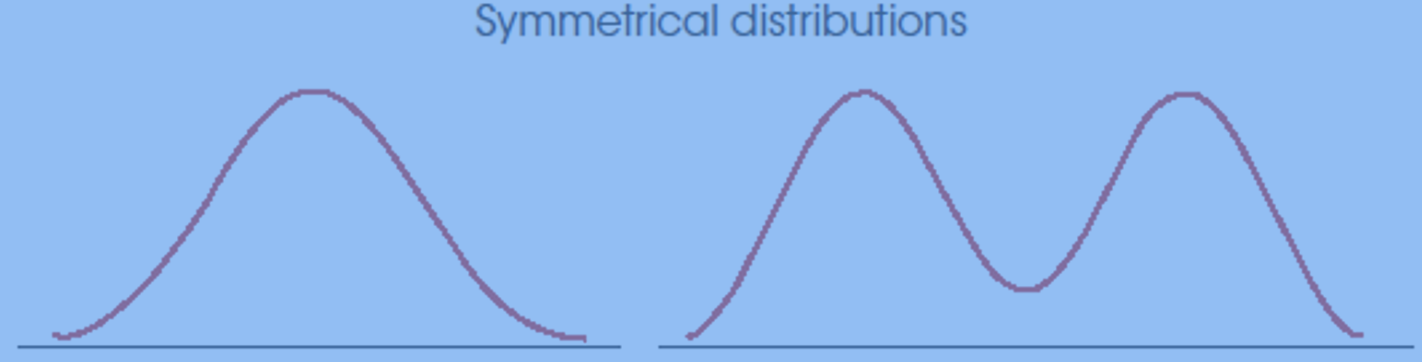
Symmetrical Distributions
Distribution in which one side is a mirror image of the other
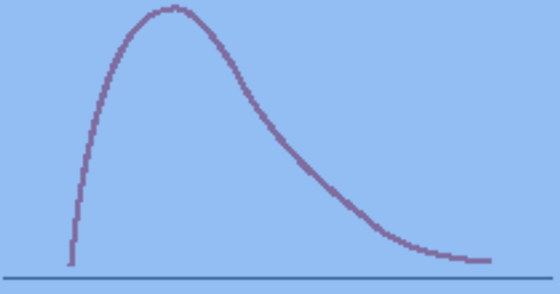
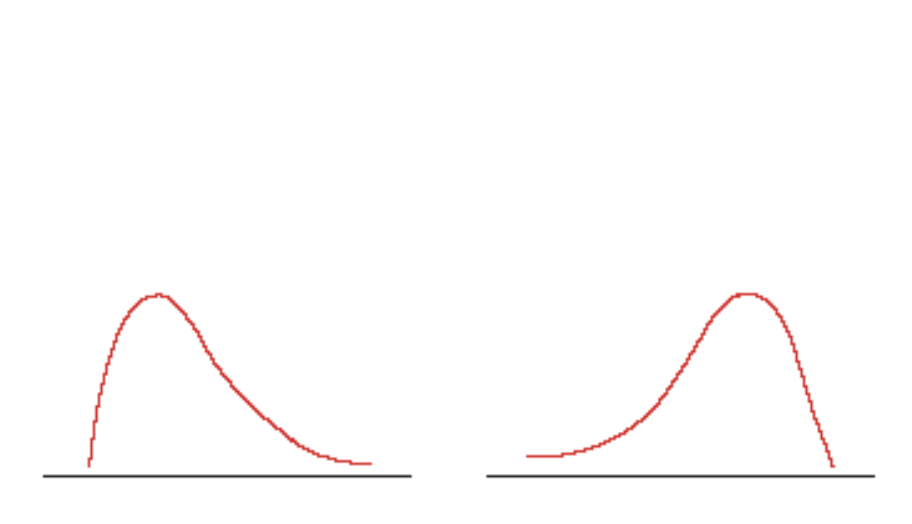
Postiive Skew
Distribution wherein the tail points toward the right end of the X-axis
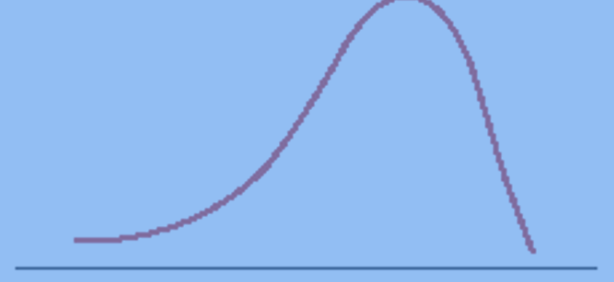
Negative Skew
Distribution wherein the tail points toward the left end of the X-axis
Frequency Distribution
Organized tabulation showing number of individuals located in each category on the scale of measurement
Grouped Frequency Distribution Table
Table presenting groups of scores rather than individual values
Class Interval
Group of scores in a grouped frequency distribution table
Apparent Limit
Value that appears to form the upper and lower boundaries for the class interval
Histogram
Graph with a bar drawn above each score and with no space between adjacent bars

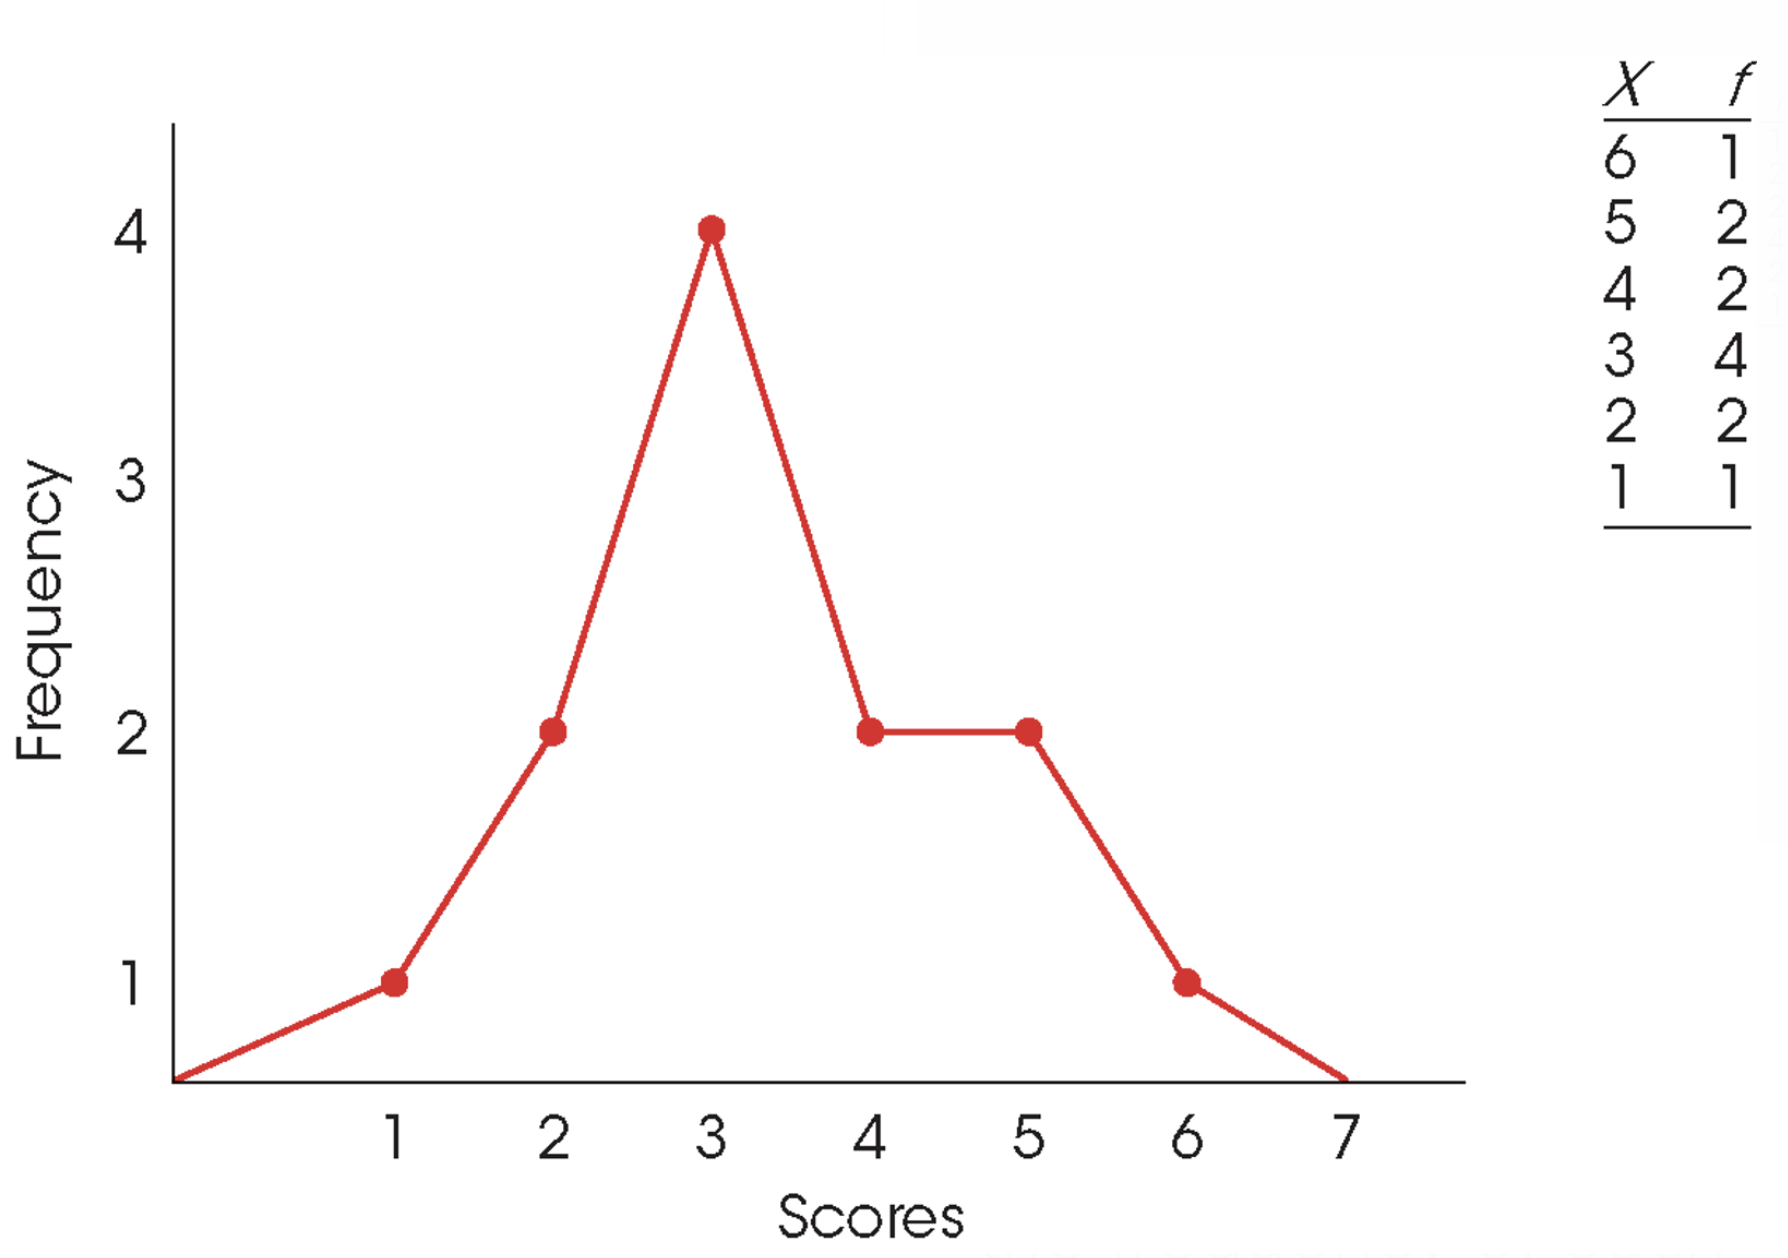
Polygon
Graph with a dot centered above each score according to the frequency of each score
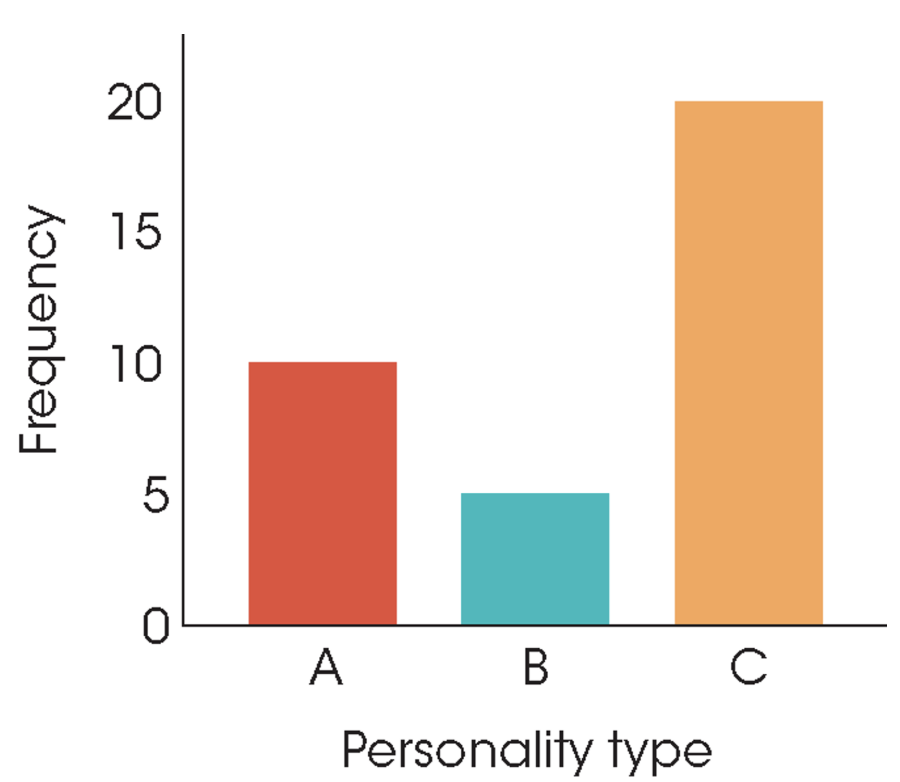
Bar Graph
Diagram with a rule drawn above each score with spaces left between adjacent bars
Relative Frequency
Estimated number of occurrences of score
Skewed Distribution
Graph in which scores pile up toward one end of the scale and taper off
Tail
Distribution section where scores taper off toward one end of a distribution
Mean
For distribution is the sum of the scores divided by the number of scores
Median
Midpoint in a list of scores listed in order from smallest to largest
Population Mean
Formula where in all scores in the population are added, and then divided by N
Sample Mean
Formula with symbols to signify population subset values
Weighted Mean
Formula combining multiple sets of scores and dividing to find overall mean for combined group
Central Tendency
Statistical measure to determine a single score that defined the midpoint of a distribution
Mode
Score or category that has the greatest frequency in a frequency distribution
Bimodal
Distribtuion with two scores with greatest frequency
Multimodal
A distribution with more than two scores with greatest frequency
Major Mode
Taller peak when two scores with greatest frequency have unequal frequencies
Minor Mode
Shorter peak when two scores with greatest frequency have unequal frequencies
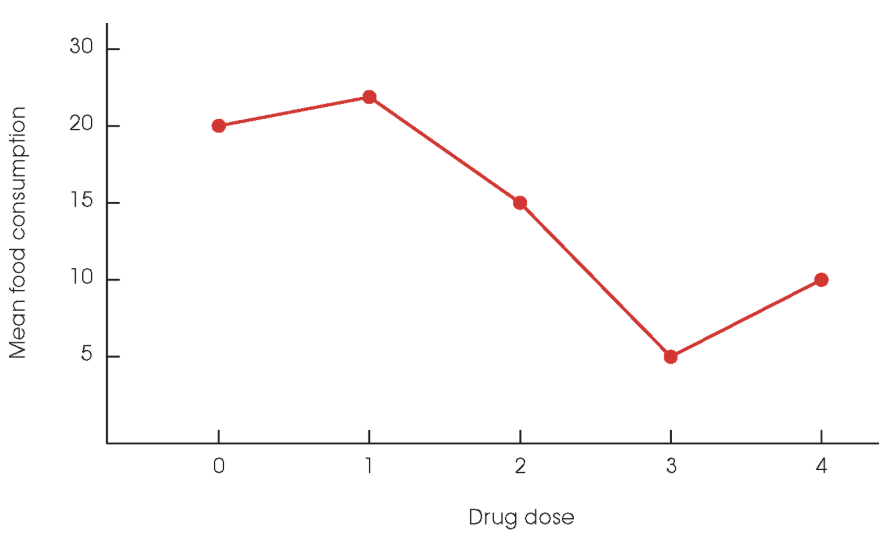
Line Graph
Diagram used when values on horizontal axis are measured on an interval or ratio scale
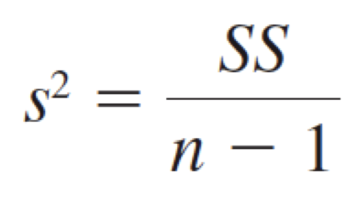
Sample Variance
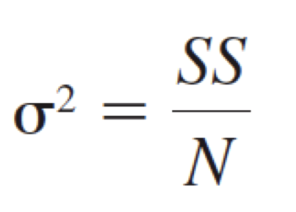
Population Variance
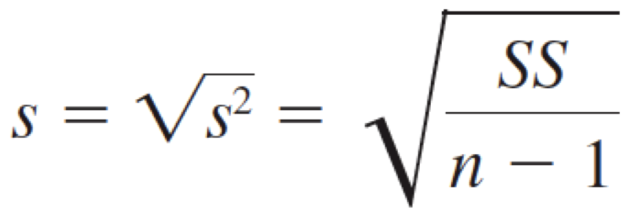
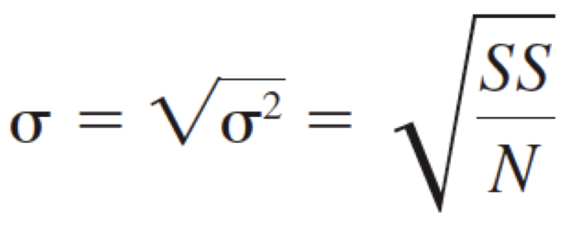
Population Standard Deviation
Sample Standard Deviation