Earth History Exam
1/156
There's no tags or description
Looks like no tags are added yet.
Name | Mastery | Learn | Test | Matching | Spaced |
|---|
No study sessions yet.
157 Terms
what does the accessible rock record look like through time?
decreases exponentially from today to 4.5 Ga
sedimentary rocks
gives us a sense of time
fossils
what situation and context
chemistry
igneous rocks
timing
dates
volatiles
metamorphic rocks
reconstruct plate tectonics
uniformitarianism
the modern processes that happen today can explain what we see in a geologic record
accretion
people and stuff
oxygen
methane clathrate
-methane locked in ice
-potent GHG, released to environment
bioturbation
when animals burrow in sediment they mix it and ruin nice sedimentation.
how does oxygen affect earth history
driving planetary cooling and glaciation, altering weathering processes and ocean chemistry, and enabling the formation of the ozone layer and more complex ecosystems by facilitating new biochemical pathways for energy
horizontal gene transfer
bacteria can pick up genes from the environment: 16srRnA/18srRNA
monophyly
came from a single source
paraphyly
came from different loci/no single source
morphology leads to 5 kingdoms
-Plants
-Animals
-Fungi
-Protists
-Monera
3 domains
-Eucarya
-Archaea
-Bacteria
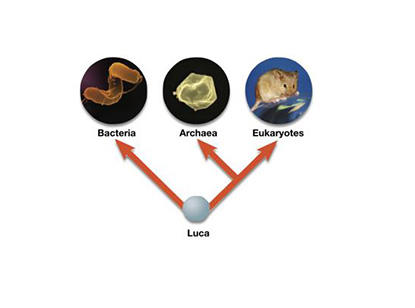
phylogenetic tree of the order of LUCA, bacteria, archaea, and eukaryotes
LUCA first, then bacteria, then archaea, then eukaryotes
which domain is the largest?
The domain Eukarya is the largest in terms of the number of classified species, containing the kingdoms Animalia, Plantae, Fungi, and Protista
eukarya branched off from who
asgard archaea
archaea cellular membrane
have a monolayer, isoprenoid, esther linkage
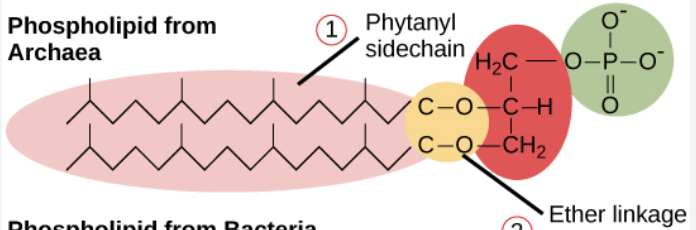
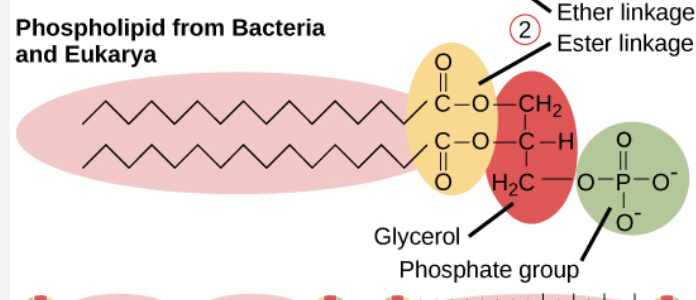
bacteria/eukarya cellular membrane
bilayer, straight chains, esther linkage
Lipids
the longest living half-life, best for earth history
LUCA
LUCA, the Last Universal Common Ancestor, was a complex single-celled organism from which all current life on Earth descends, likely existing around 4.2 billion years ago, shortly after the planet's formation
tree of life vs origin of life
LUCA may not have been the origin of all life. We don’t exactly know when LUCA existed.
time frame of LUCA existence
3.5-4.1 Ga
sequence alignment
sequences in amino acid align when related
lipid biodiversity and earth history
lipid biodiversity is critical in earth history. it is geologically stable and can tell us what an organism is and how it metabolized (oxic vs anoxic). lipids can be in carbon, oil, which we can analyze readily.
Carbon reservoirs
Ocean, earths crust, atmosphere
Ocean C reservoir
dissolved inorganic carbon
H2CO3—>CO2+HCO3-+CO32-
Earth’s crust
-CaCO3, limestones, dolomite ((Ca,Mg)(CO3)2)
-oil, natural gas, coal as organic matter
Atmosphere
-CO2, CH4
photosynthesis
6CO2+6H2O+light energy→C6H12O6+6O2
respiration
C6H12O6+6O2→6CO2+6H2O. The process by which organisms convert glucose and oxygen into carbon dioxide, water, and energy.
Carbon matrix entering the ocean DIC
C enters as CO2 —> ocean DIC —> Oxygen, reduced organic carbon, oxidized carbonate
most prevalent isotope of carbon
Carbon 12.
13C/12C=
the ratio of stable carbon isotopes used in various scientific applications, indicating biochemical processes and environmental conditions.
interpreting delta 13C values
more positive delta 13 C is more 13C enriched material
more negative delta 13 C is more 12C enriched material
Ocean Carbon System and Fractionation
Carbon enters the ocean mainly as CO₂ or bicarbonate.
Biological processes (photosynthesis, respiration) and carbonate precipitation alter isotopic composition.
The isotopic composition of carbon leaving the ocean differs from what enters it, depending on how much goes into:
Carbonates (δ¹³C_carb) — heavier, more ¹³C.
Organics (δ¹³C_org) — lighter, more ¹²C.
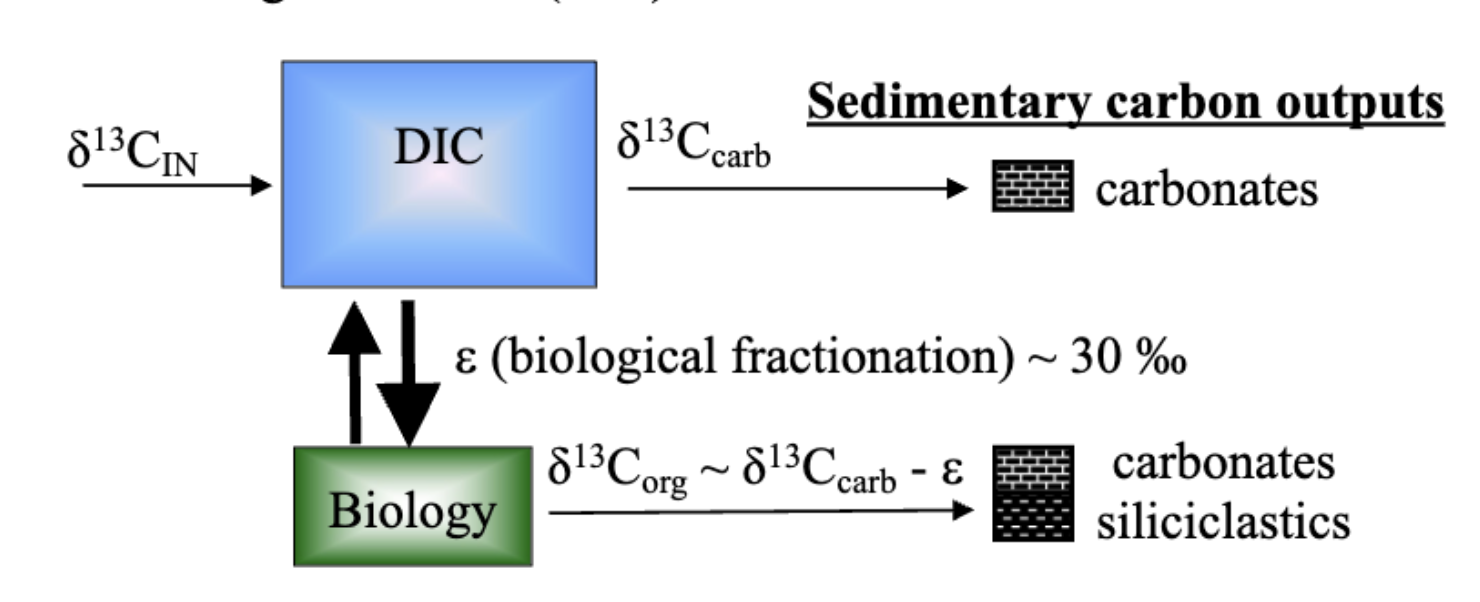
carbon Mass Balance Equation
δ13C_in = (1 - f_org) δ13C_carb + f_org δ13C_org
definition of f_org
f_org = F_org / (F_org + F_carb)
mass balance equation definitions
forg = fraction of carbon buried as organic matter
Forg = flux of organic carbon burial
Fcarb = flux of carbonate carbon burial
sulfate reduction
2H + SO4 + 2(CH2O) → H2S + 2CO2 + 2H2O
sulfate oxidation
H2S + 2O2 —> 2H + SO4
Explain in words how carbon and sulfur cycles regulate (and are regulated by) atmospheric oxygen.
When Oxygen is abundant, it tends to favor pathways that are oxidative. When oxygen is heavily present, processes like aerobic respiration and sulfate oxidation are more prominent. For sulfur, sulfide does not accumulate in high oxygen scenarios, and instead it is quickly oxidized to sulfate. When there is low oxygen, then processes like aerobic respiration cannot occur, and fermentation occurs instead. For sulfur, when oxygen is scarce sulfide builds up. When organic carbon ('CH2O') is buried rather than respired, this results in a net O2 release into the environment.
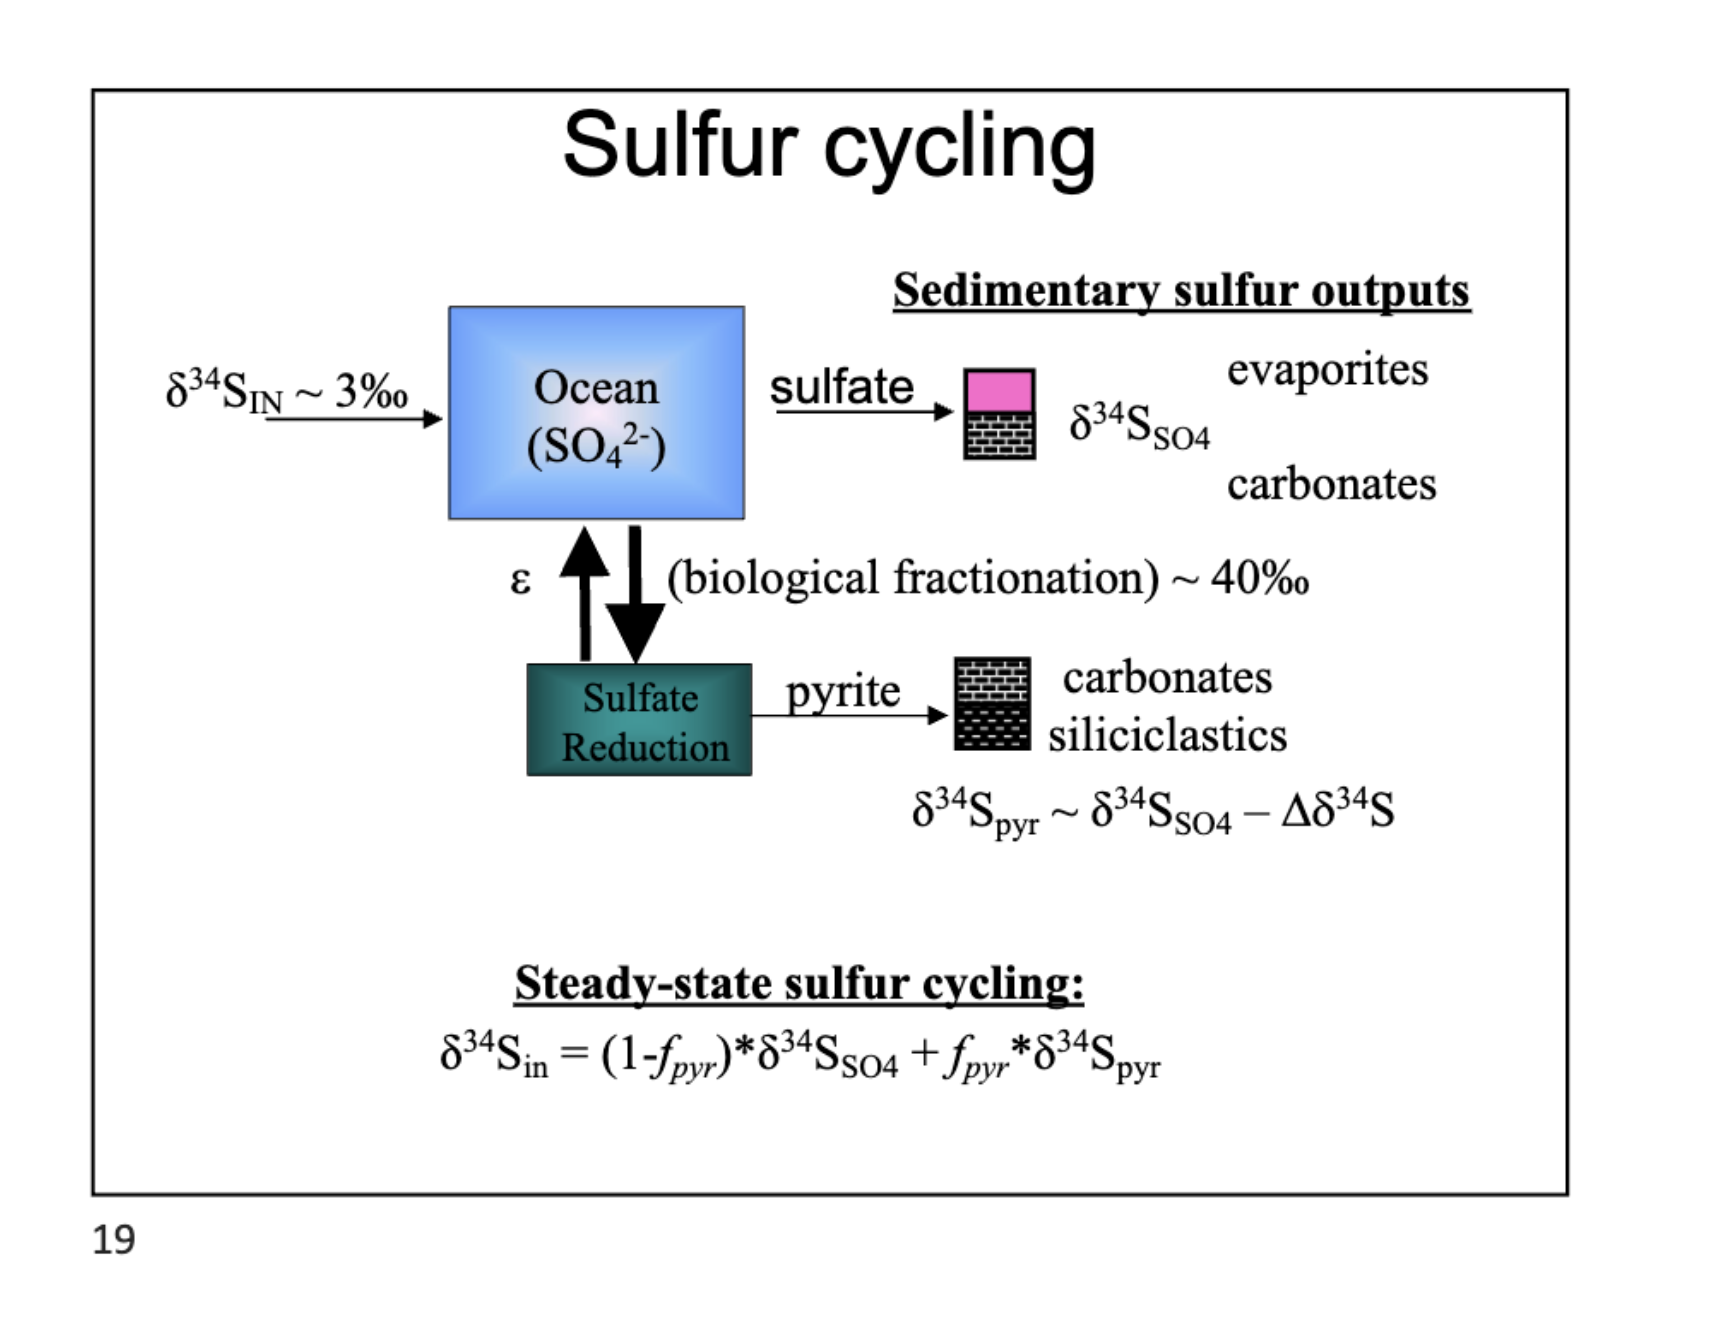
Sulfur matrix entering the ocean DIS
34S enters in as SO4, sulfate reduction converts into pyrite and then carbonates and siliclastics come out. sulfate oxidation can cause carbonates and evaporates like gypsum.
sulfur isotopes
34S/32S relationship. more negative means less 34S.
steady state sulfur cycling eq
δ34S_in = (1 - f_py) δ34S_carb + f_py δ34S_py
f_py definition
f_py = F_py / (F_py + F_carb)
definition of steady sulfur cycle equation
δ34S_in = isotopic composition of sulfur entering the ocean
δ34S_carb = δ34S of sulfate (often recorded in evaporites or carbonates)
δ34S_py = δ34S of pyrite (reduced sulfur)
f_py = fraction of sulfur buried as pyrite
F_py and F_carb = fluxes of pyrite and sulfate burial, respectively
32S and its prominence
32S is more easy to break apart from sulfate to H2S. this easier breaking makes it more abundant.
sulfur fractionation (epsilon)
for sulfur, the faster the cell metabolizes, the smaller the fractionation rate
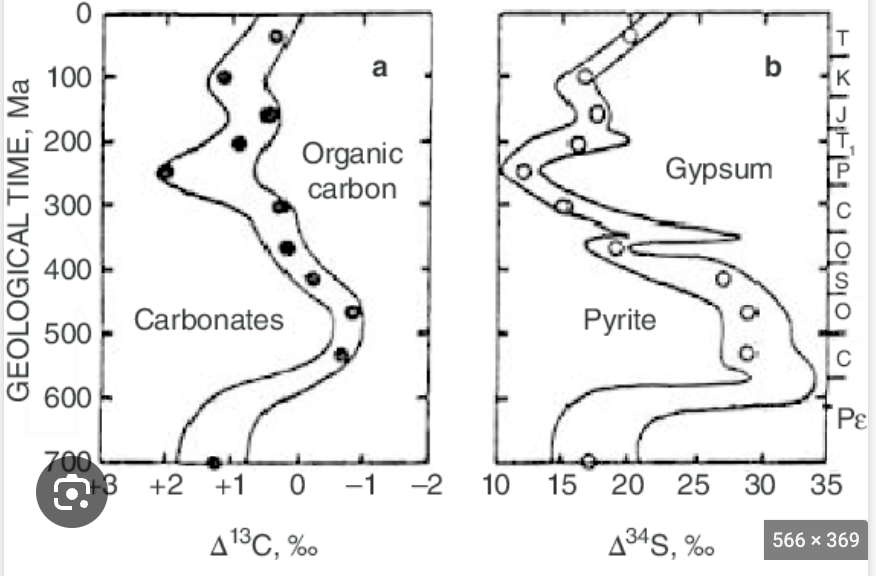
carbon and sulfur cycles coupling
anti correlation. when carbon isotopes are heavy, sulfur isotopes are lighter.
oxygen isotopes
18O/16O. lighter oxygen isotopes want to be in the atmosphere, heavier isotopes want to be in ice or in a solid form.
what happens to ocean delta 18O when we accumulate precipitation on land?
during glacial times, more ice is on land, oxygen composition in sea water gets heavier. interglacial: less ice —→ higher delta 18O. glaciation: more ice ——> lower delta 18O.
relationship of H2O and CaCO3
H₂O + CO₂ ⇌ H₂CO₃ ⇌ H⁺ + HCO₃⁻ ⇌ 2H⁺ + CO₃²⁻ ⇌ CaCO₃ (solid)
Water (H₂O) dissolves CO₂ to form carbonic acid (H₂CO₃).
This reacts and breaks down into bicarbonate (HCO₃⁻) and carbonate (CO₃²⁻) ions.
Calcium ions (Ca²⁺) in water then combine with carbonate (CO₃²⁻) to form calcium carbonate (CaCO₃).
All these species exchange oxygen atoms, creating isotopic equilibrium between CaCO₃ and the surrounding H₂O.
When isotopic equilibrium is reached, CaCO₃ records the δ¹⁸O of the water it formed in.
Because this fractionation depends on temperature, scientists can use δ¹⁸O in carbonates to reconstruct past climates and ocean conditions (paleotemperature proxy).
Oxygen Isotopes and Temperature Relationship
At higher temperatures, CaCO₃ incorporates less ¹⁸O, so δ¹⁸O becomes lower (more negative).
Conversely, when temperature decreases, δ¹⁸O of carbonates increases (more ¹⁸O retained).
Ice volume effect and oxygen isotopes
When more ice forms on land:
Ice traps ¹⁶O (light oxygen) in glaciers.
The ocean becomes enriched in ¹⁸O.
Marine carbonates (CaCO₃) forming in that ocean record higher δ¹⁸O values.
When ice melts:
because ¹⁶O returns to the ocean, making seawater lighter again.
Over the course of the last glacial-interglacial cycle, δ18Ocarb in tropical marine carbonates changed by 2.0‰. Was it more enriched (higher δ18Ocarb) during the glacial or interglacial period? Would the change in δ18Ocarb be of greater or lesser magnitude than that in coeval seawater δ18OH2O? Why?
During glacial periods, oceans become enriched in 18�(carb) as 16� is trapped in ice. Carbonates record this, so 18�(Carb) is higher in glacial periods. For the second question, tropical waters generally tend to cool down during glacial periods, which means there is additional 18� in carbonates during this time. This means that the 18�(carb) change is greater than the change in 18�(H2O) alone.
You have access to a lab that can analyze gene expression, one that can analyze DNA sequences, and one that can analyze organic biomarkers (i.e., cellular lipids). Briefly explain the different types of information each can provide with regard to phylogeny, type of metabolism, and metabolic activity. What techniques (and why) are most useful for modern environmental samples? And for ancient samples?
Analyzing gene expression tells us which genes are actively being used at a specific moment. It gives us information on metabolic activity, and functional states of the living community. However the limitation here is that this technique only works in living or recently living cells since RNA decays quickly. This technique is most useful for modern samples. DNA sequences tell us who is present in phylogeny and taxonomy. DNA can provide us with potential metabolic capabilities. The limitation here is that DNA also degrades relatively quickly, and ancient DNA is relatively rare. Organic biomarkers like lipids, sterols, and hopanes, are much more stable. They can tell us about broad metabolic types like if something was a methanogen, etc. This type of analysis is best for ancient samples, and is useful when DNA/RNA is gone.
δ¹⁸O_carb
When carbonate minerals precipitate, they take oxygen from water (H₂O). carbonates precipitate more readily in hot water.
δ¹⁸O_seawater
This measures the isotopic composition of the ocean water (or ancient seawater if inferred).
What major taxonomic change did Woese et al. propose in 1990?
They introduced the three-domain system — Bacteria, Archaea, and Eucarya — above the level of kingdom, based on molecular sequence data (rRNA)
Why did Woese et al. propose adding a new rank called domain?
Because molecular data (especially ribosomal RNA) showed fundamental differences between Bacteria, Archaea, and Eukarya that were too deep to fit within the old “kingdom” system.
What molecular evidence revealed the existence of Archaea as distinct from Bacteria?
rRNA sequence comparisons — 16S and 18S ribosomal RNA structures — showed unique base pair patterns and loops that divided life into three molecularly distinct lineages.
What was wrong with the five-kingdom and two-empire (prokaryote/eukaryote) systems?
The five-kingdom model (Monera, Protista, Plantae, Fungi, Animalia) didn’t reflect evolutionary relationships — it lumped all prokaryotes together.
The prokaryote/eukaryote dichotomy was cytological, not phylogenetic — “prokaryotes” were defined by lack of features, not shared ancestry.
Molecular data showed Bacteria and Archaea are as unrelated to each other as they are to eukaryotes.
How does the three-domain system connect to early Earth and LUCA?
It identifies the Last Universal Common Ancestor (LUCA) as predating the split of the three domains, meaning that life diversified very early (3.5–4 Ga).
What two kingdoms did Woese et al. recognize within Archaea?
Euryarchaeota: Methanogens, halophiles, sulfate reducers.
Crenarchaeota: Thermophiles, likely resembling the ancestral archaeal phenotype.
What did Schopf et al. (2002) claim using Raman spectroscopy?
They used laser–Raman imagery to correlate morphology and chemical composition in 3.5 Ga Apex chert filaments, arguing this proves biogenic kerogenous cell walls
Why did Schopf use Raman spectroscopy on Apex fossils?
It’s a non-destructive technique that detects the carbon structure (D and G bands), allowing scientists to confirm kerogenous (organic) composition
What features did Schopf interpret as proof of life?
Filamentous, cylindrical, and cellular morphologies with kerogenous carbon, transverse cell walls, and tapered ends
Where and when are the fossils from?
Apex chert, Warrawoona Group, Western Australia — ~3.465 billion years old
What does Schopf’s study imply for early life?
If valid, these fossils show that complex microbial ecosystems existed by 3.5 Ga
What did Brasier et al. (2002) argue against Schopf’s findings?
They re-examined the same Apex chert samples and found the “microfossils” were abiotic artifacts — graphite-rich filaments formed by hydrothermal and metamorphic processes
How did Brasier reinterpret the rock context of the Apex chert?
Instead of being sedimentary and biogenic, the Apex chert was a hydrothermal vein breccia cutting volcanic basalt — meaning the filaments formed in metamorphic or hydrothermal fluids
How could “fossil-like” filaments form abiotically?
Graphitic carbon and silica spherulites can produce pseudoseptate, branching, filament-like textures during hydrothermal silica crystallization
What isotopic and mineral data supported the abiotic interpretation?
δ¹³C values (-30‰) overlapped with abiotic carbon fractionation; presence of native metals (Fe, Ni, Cu, Zn) and sulfates implied formation at 250–350°C in hydrothermal systems.
What flaw did Brasier find in Schopf’s analysis?
Raman spectra confirmed carbon but did not prove biological origin — since both the “fossils” and surrounding matrix shared identical graphitic signals.
What did Brasier et al. say about standards of biogenicity?
all abiotic explanations must be ruled out first. Ancient “microfossils” must be contextually, chemically, and texturally consistent with biology.
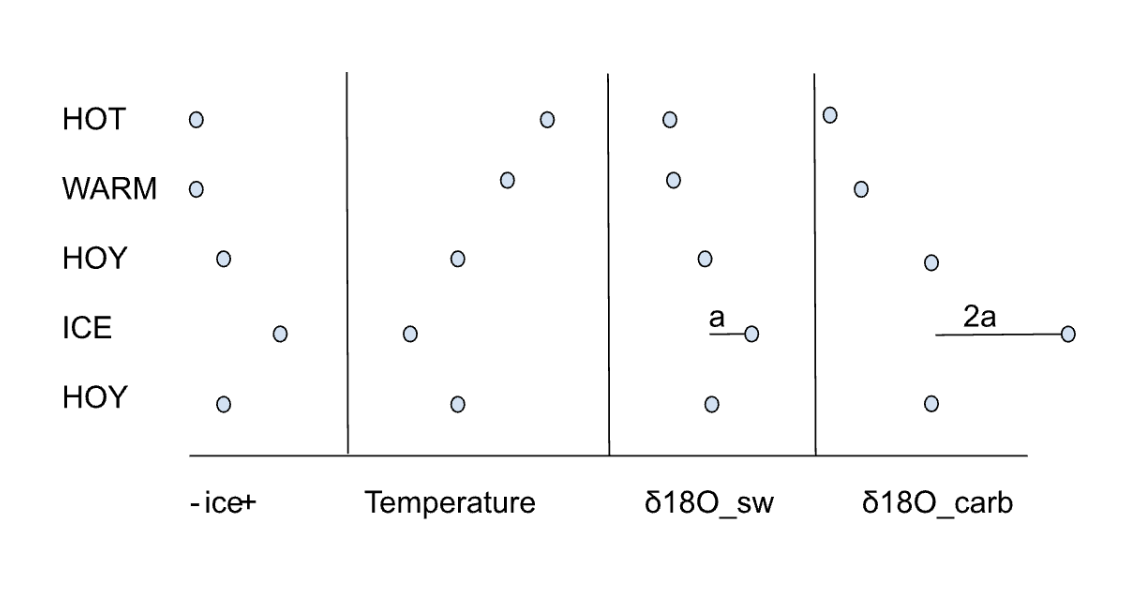
oxygen isotopes and temperature diagram.
δ¹⁸Oₛw reflects how much ¹⁶O is locked in ice sheets.
Once the ice is completely melted (in a HOT climate), there’s no more ice left to melt — so δ¹⁸Oₛw can’t decrease further.
Even after δ¹⁸Oₛw stops changing (because the ice is gone), temperature keeps rising, so δ¹⁸O_carb continues to decrease.
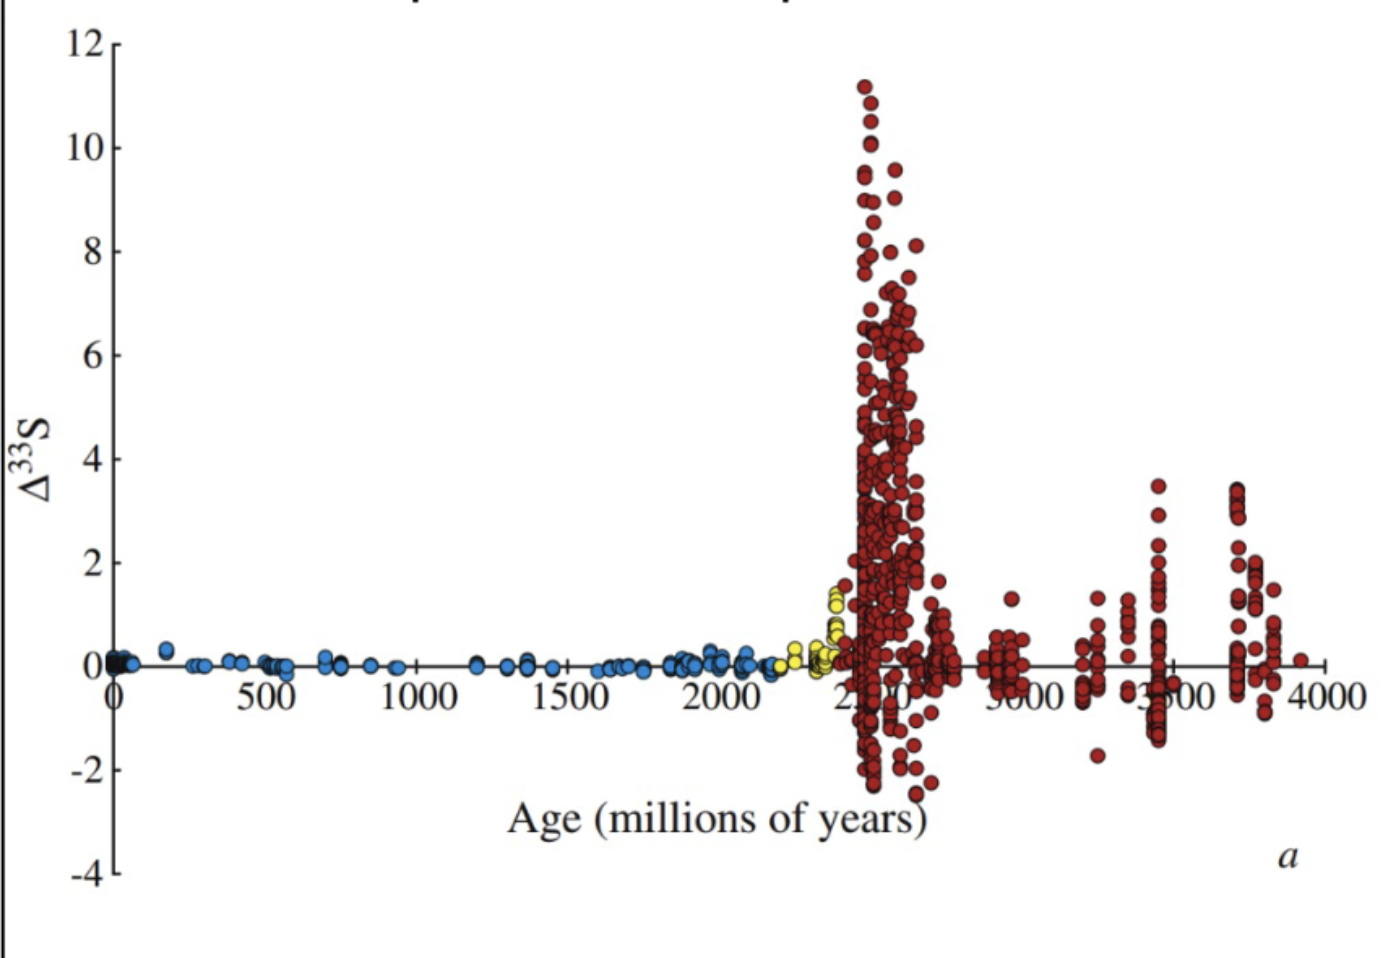
when did mass independent fractionation occur?
in the Archaen, before the GOE
when does mass dependent fractionation occur?
currently
why did MIF occur when the earth’s atmosphere was anoxic?
it occurred because there was no ozone layer so photons can reach down to where sulfur is in the atmosphere to break it apart using photochemical reactions.
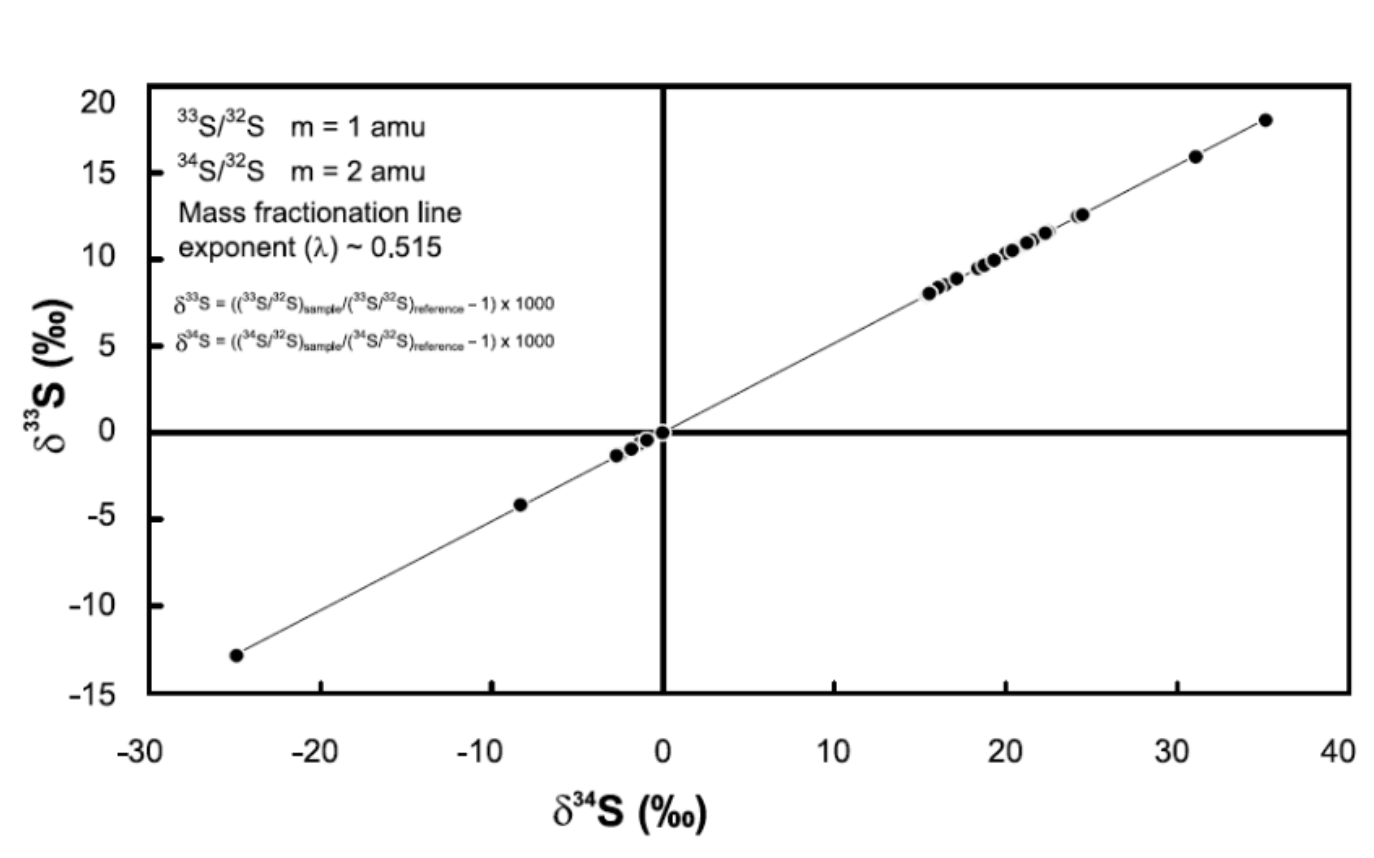
sulfur mass dependent fractionation graph
δ33S and δ34S values are proportional which means that isotopes are fractioning in a mass dependent way.
sulfur mass independent fractionation graph
no oxygen, UV driven photochemistry. peak occurs at 2.4 Ga.
when Δ33S=0,
it indicates mass dependent fractionation is dominant.
when Δ33S=/=0,
it signifies mass independent fractionation.
y and x axis of mass dependent fractionation of sulfur
represent δ³³S and δ34S values, respectively, slope= 0.5
y and x axis of mass independent fractionation of sulfur
Age on x axis, Δ33S on y axis
Δ33S=
δ33S - 0.5δ34S
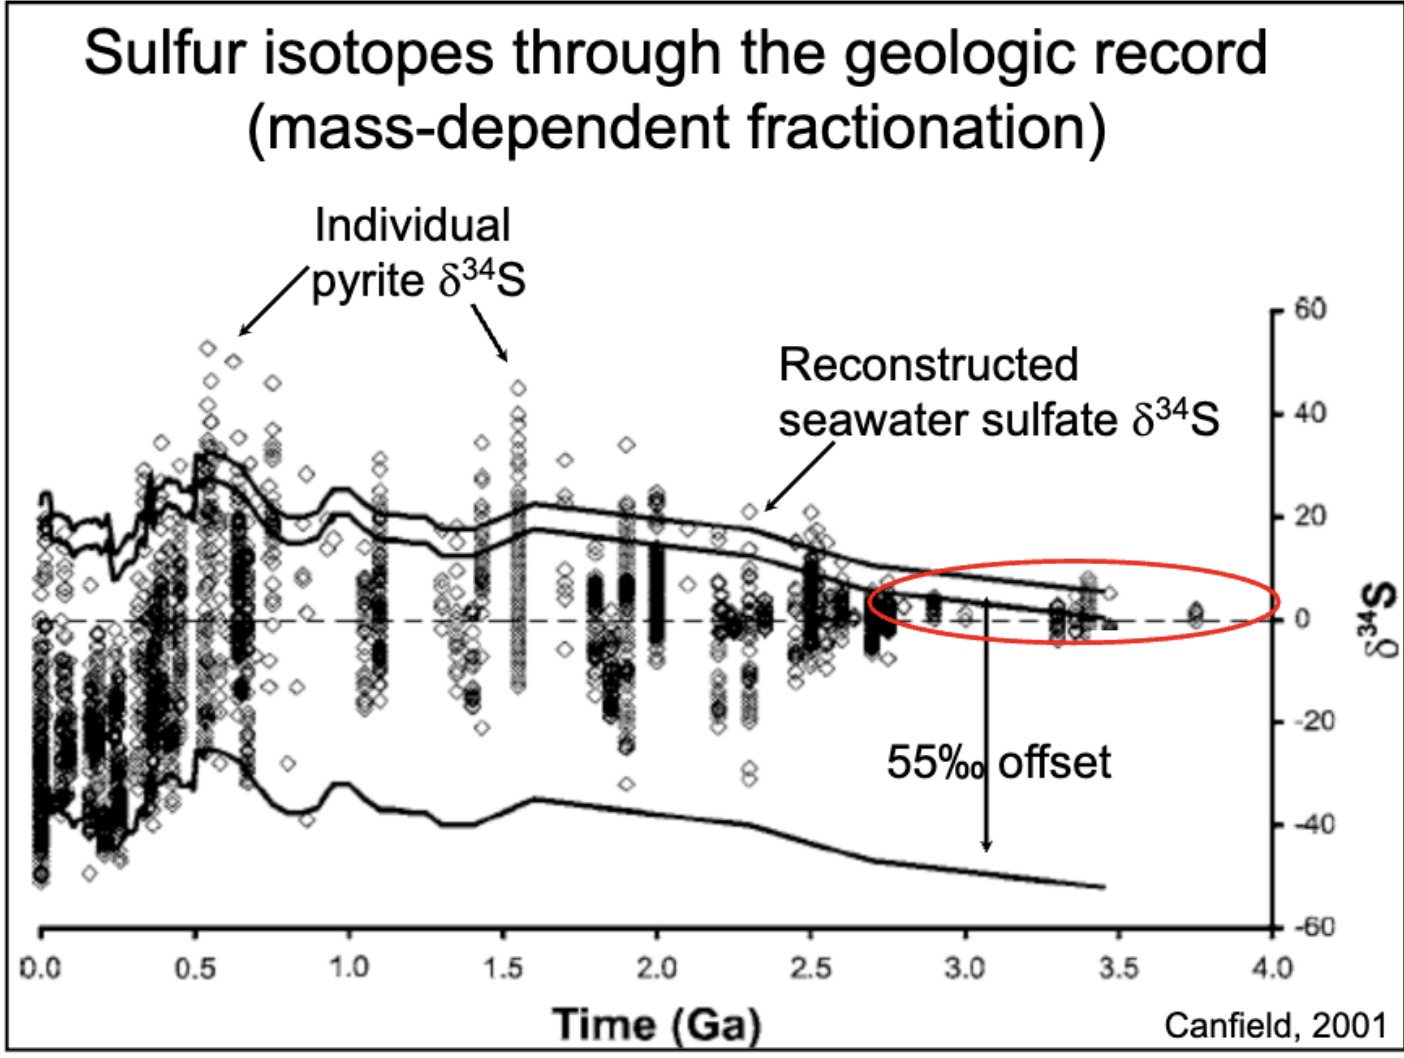
sulfur isotopes through mass dependent fractionation graph.
plotted with time (Ga) vs δ34S. shows how when oxygen increases, we get oxidative weathering, and sulfate delivery increases, so sulfide can readily be converted into pyrite.
why does more oxygen lead to glaciation?
increase in weathering, takes CO2 out of atm and decreases temperature. when ozone levels increase, temperature decreases. when CH4 decreases, temperature decreases.
redbeds
are sedimentary rocks that indicate oxidation of iron due to exposure to oxygen.
what other geologic indicators show atmospheric O2 was low prior to 2.4 Ga?
stromatolites increase, redbeds decrease, banded iron formations disappearence, paleosols had low Fe on the soil surface before 2.4 Ga. reason why is during oxygenation, Fe minerals stay in place while other minerals dissolve and leave.
ferruginous
Fe2+ ferrous , Fe3+ ferric
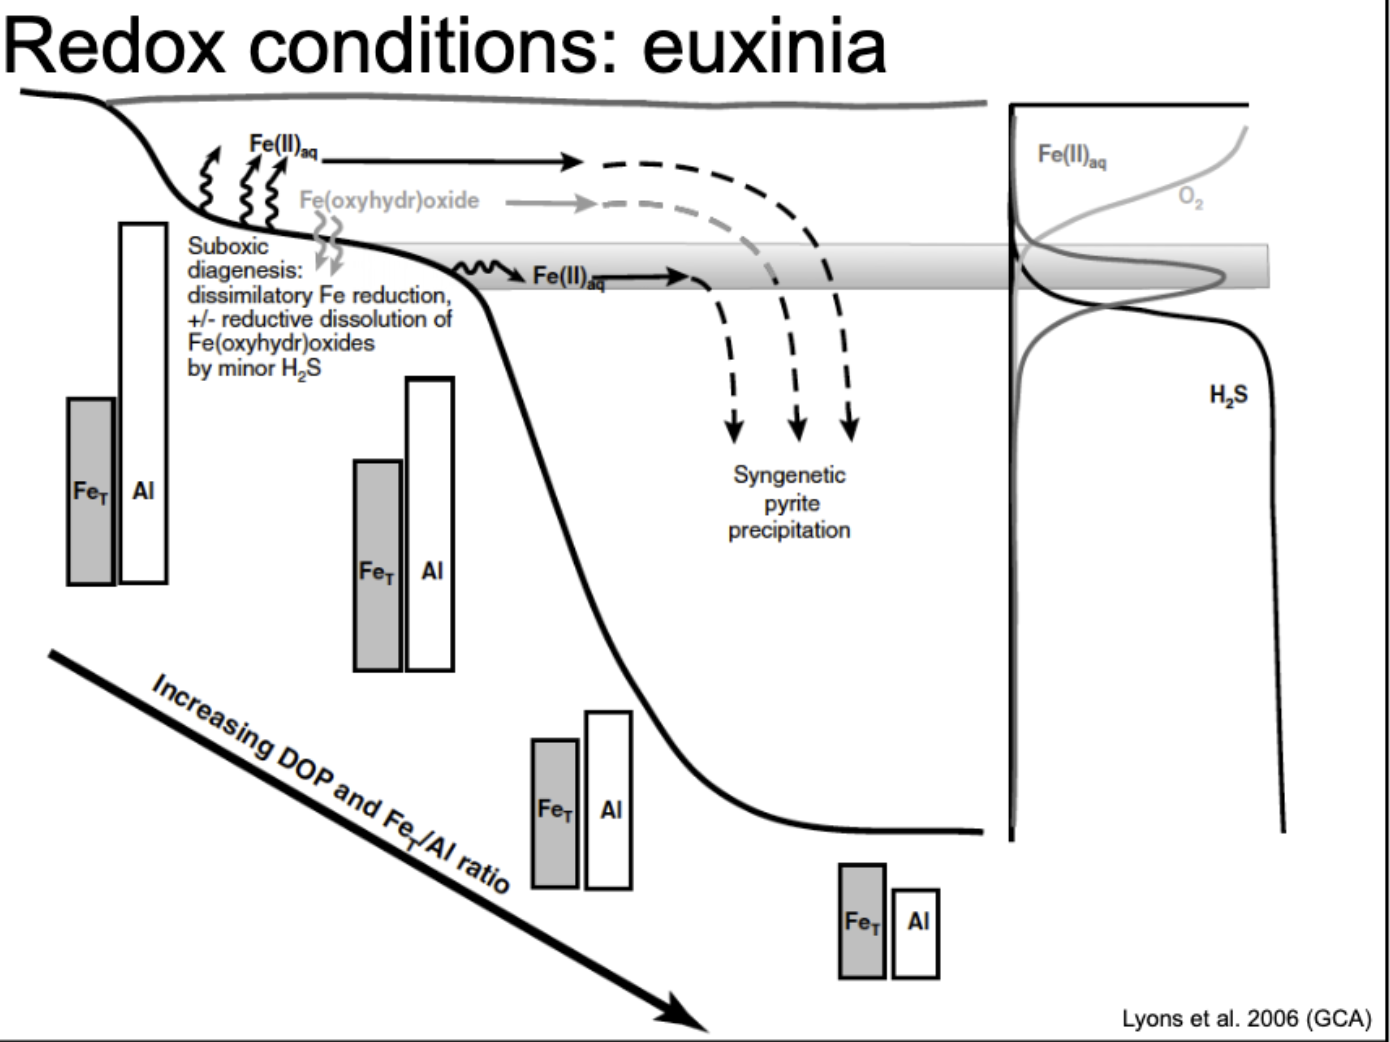
euxinic
refers to anoxic, sulfidic waters characterized by the presence of hydrogen sulfide, often associated with low oxygen conditions.
redox condition in euxinia
Fe3+ is never soluble. Fe2+ is mobile. as you move down the slope, total amount of Fe increase relative to Al. As oxygen levels decrease, Fe2+ becomes more prevalent, while the solubility of Fe3+ diminishes, leading to increased total iron relative to aluminum.
transition to a sulfidic ocean graph
shows Total Fe, Fe_HR / Fe_T, Fe_py / Fe_HR, δ³⁴S (‰)
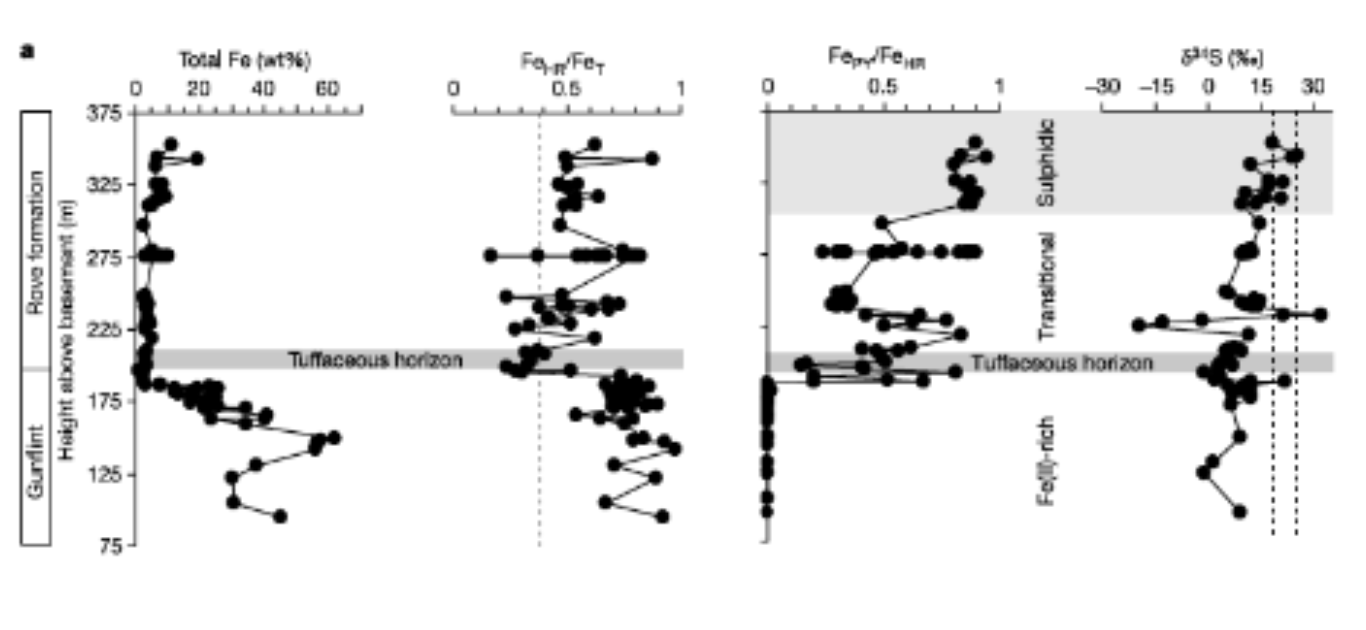
Total Fe (wt%)
The highest Fe values occur in the lower part (Fe-rich zone) — meaning those rocks formed when iron was abundant, likely due to precipitation from an anoxic, Fe²⁺-rich ocean (typical of Banded Iron Formations).
Fe_HR / Fe_T
“Fe_HR” = highly reactive Fe (the fraction of iron that can easily react with sulfur to form pyrite, such as Fe in oxides, hydroxides, or carbonates).
“Fe_T” = total Fe.
So this ratio tells how much of the total iron is reactive.
Interpretation:
Low Fe_HR/Fe_T (<0.38) → oxic marine environment (less reactive Fe).
High Fe_HR/Fe_T (>0.38) → anoxic environment (more reactive Fe).
In the graph:
Below the tuffaceous horizon, Fe_HR/Fe_T is relatively high → anoxic iron-rich conditions.
Above it, values become lower and fluctuate → the water column may have had more oxygen or partial redox stratification (transitional conditions).
Fe_py / Fe_HR
“Fe_py” = Fe bound in pyrite (FeS₂).
This ratio shows how much of the reactive Fe got converted into pyrite.
High Fe_py/Fe_HR (>0.7) → sulfidic (euxinic) water (lots of hydrogen sulfide available).
Low Fe_py/Fe_HR → iron was reactive but didn’t meet much sulfide (ferruginous rather than euxinic).
In the figure:
In the Fe-rich zone, Fe_py/Fe_HR is very low → little sulfide; mostly ferruginous.
In the transitional zone, the ratio rises — sulfide begins to appear.
In the upper sulfidic zone, Fe_py/Fe_HR is near 1 — strongly euxinic conditions.
δ³⁴S (‰) on sulphidic ocean graph
This measures the isotopic composition of sulfur in pyrite.
δ³⁴S = heavy vs. light sulfur isotopes.
Low (negative) δ³⁴S → open-system microbial sulfate reduction (light sulfur).
High (positive) δ³⁴S → more closed system or intense sulfate limitation (heavy sulfur).
In the graph:
Below the tuffaceous horizon, δ³⁴S is low to moderate (–10 to 0‰) → open, iron-rich and low-sulfide system.
Upward into the sulfidic zone, δ³⁴S shoots to very positive values (+15 to +30‰) → restricted, sulfate-limited environment — euxinic, sulfur-rich basin.
Around 1.8 Ga, oceans were stratified:
Surface: mildly oxygenated.
Mid-depth: euxinic (rich in H₂S).
Deep waters: ferruginous (Fe²⁺-rich, no oxygen or sulfide).
Molybdenum Isotopes
Under oxic conditions, Mo exists as soluble MoO₄²⁻; under euxinic conditions, it precipitates as MoS₂.
δ⁹⁸/⁹⁵Mo becomes more positive as oceans become more oxygenated (fractionation increases).