Chapter 2 - Processing and representing Data
1/21
Earn XP
Description and Tags
Name | Mastery | Learn | Test | Matching | Spaced | Call with Kai | Chat |
|---|
No analytics yet
Send a link to your students to track their progress
22 Terms
Databases
Tables with a collection of data, secondary data
Two-Way Tables contain…
bivariate data
Simple Bar Chart Rules
Bars are equal width
Equal gaps between bars
Frequency on y-axis
Vertical Line Graph
lines instead of bars
Composite Bar Charts
Composite Bar Charts Has single bars split into different sections
Stem and Leaf Diagrams
A good way of organising data without losing any of the detail
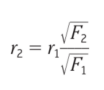
Area of Comparative Pie Chart
Area of Pie Chart = Total Frequency
r2 equation
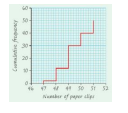
CF Step Polygons are used for…
discrete data.
CF Curves are used for…
continuous data.
CF Step Polygon
What bound is used for Frequency Polygons?
upper bounds
Histograms have ________ gaps between bars.
no
For a Histogram with Equal Class Widths…
x-axis = data
y-axis = frequency
Looks like bar charts without gaps.
For a Histogram with Unequal Class Widths…
Area of bar = frequency
Y-axis = Frequency Density (not frequency)
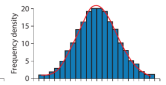
The idea is that the frequency density reflects the ‘concentration’ of things within each range of values.
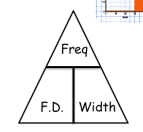
Histogram triangle Equation
Drawing Histograms
Calculate class widths for each class interval
Calculate frequency density for each class interval using FD = F/CW formula.
Draw a suitable scale on y-axis labelled frequency density.
Draw bars using frequency density data. (Remember the bars have no gaps in between)
Common errors in Frequency Polygons
Midpoints not used
Joined together at the bottom
Points not joined together with straight lines but with a curve instead.
Axes and Scales that can be misleading…
Scales that do not start at zero.
Missing values on the scales.
Axes that are unevenly scaled.
Axes that are not labelled.
Not using a key.
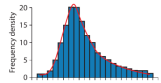
Positive Skew
Most data values are low.
Negative Skew
Most data values are high.
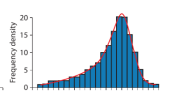
No Skew
Symmetrical distribution, data values in the middle