AQA A level Bio 3.4 Mass Transport in Plants
1/21
Earn XP
Description and Tags
Name | Mastery | Learn | Test | Matching | Spaced | Call with Kai |
|---|
No analytics yet
Send a link to your students to track their progress
22 Terms
Lignin is a polymer found in the walls of xylem vessels in plants. Lignin keeps the xylem vessel open as a continuous tube.
Explain the importance of the xylem being kept open as a continuous tube (3)
Allows unbroken water column (1)
Cohesion from H bonds between (all) water (molecules) (1)
transpiration creates tension (in column) (1)
A scientist investigated factors that affect the shelf life of cut flowers. A cut flower is the part of the stem with the flower bud attached after it has been cut from a plant.
The shelf life is the number of days the cut flowers are in good enough condition
to be sold.
He:
• took 12 cut flowers from a rose plant
• determined the mean number of stomata per mm2 on the leaves
• determined the transpiration rate for each cutting
• stored the cut flowers on a shelf in a brightly lit room
• determined the shelf life of the cut flowers.
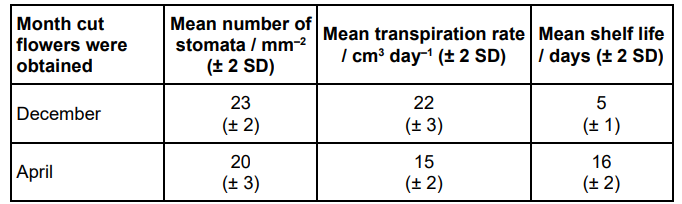
The table below shows his results.
A value of ± 2 SD (standard deviations) from the mean includes over 95% of the data.
Using information in the table, what can you conclude about the effect of
different factors on the mean shelf life of cut flowers?
Explain your conclusions (4)
SDs do not overlap for (mean) shelf life/transpiration rate (1)
Shelf life significantly longer/different in April (1)
No significant difference in (mean) number of stomata so unlikely/not linked to shelf life (1)
Significant difference in (mean) transpiration rate so (likely) linked with shelf life (1)

A scientist investigated factors that affect the shelf life of cut flowers. A cut flower is the part of the stem with the flower bud attached after it has been cut from a plant.
The shelf life is the number of days the cut flowers are in good enough condition to be sold.
He:
• took 12 cut flowers from a rose plant
• determined the mean number of stomata per mm2 on the leaves
• determined the transpiration rate for each cutting
• stored the cut flowers on a shelf in a brightly lit room
• determined the shelf life of the cut flowers.
The table below shows his results.
Other than a change in temperature, give two changes the scientist could make to the environmental conditions to increase the cut flowers’ shelf life. Explain your answer. (6)
Reduce light intensity (1)
Stomata close (1)
(So) decreased (rate of) evaporation/transpiration (1)
Increase humidity (1)
Reduces water potential gradient (between plant and air) (1)
so decreased rate of evaporation/transpiration (1)
Describe the transport of carbohydrate in plants. (5)
Sucrose is co-transported/moved with H+ into phloem (cell) (1)
by companion cells (1)
Lowers water potential in phloem and water enters from xylem by osmosis (1)
(Produces) high(er) (hydrostatic) pressure (1)
Mass flow to respiring cells (1)
The mass flow hypothesis is used to explain the movement of substances through phloem. Use your understanding of the mass flow hypothesis to explain how pressure is generated inside this phloem tube. (3)
Sucrose actively transported (into phloem) (1)
Lowering water potential (1)
Water moves into phloem by osmosis (from xylem) (1)
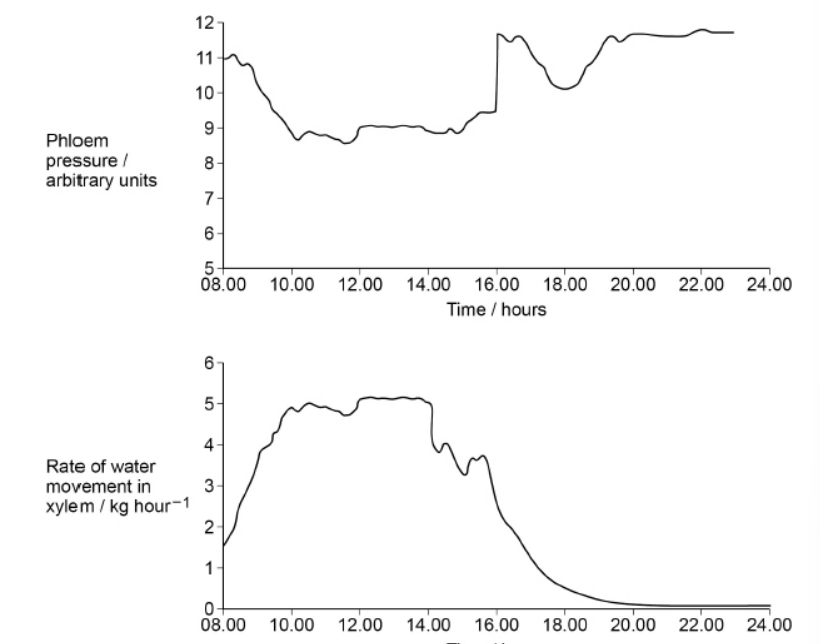
The scientist also measured changes in the phloem pressure and changes in the rate of water movement in the xylem of a willow plant at intervals during a day. His results are shown in the graph below.
Phloem pressure is reduced during the hottest part of the day. Use information in the graph above along with your understanding of transpiration and mass flow to explain why. (3)
High (rate of) transpiration/evaporation (1)
Water lost through stomata(1)
(Causes) less water movement from xylem to phloem (1)
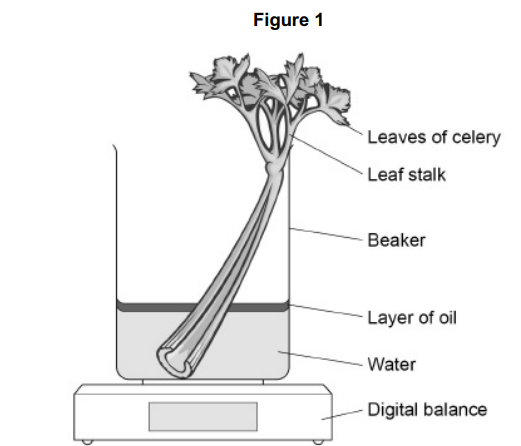
A student used the apparatus shown in Figure 1 and a digital balance to determine the rate of water movement in a celery stalk in grams per hour per group of xylem vessels.
The student measured the time taken for water movement. Give two other measurements he made to calculate the rate of water movement. (2)
initial and final mass (of beaker and all contents) (1)
number of groups of xylem vessels (1)
A different student used coloured water to investigate the movement of water in leaf stalks of celery.
During the procedure she:
• cut equal lengths of stalk from each plant
• put the cut end of each stalk into coloured water
• left these stalks to take up the coloured water for 20 minutes
• used a sharp scalpel to cut slices from the stalks at 1 mm intervals
until she reached a slice with no coloured water.
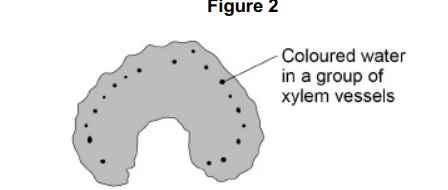
Figure 2 shows a slice of leaf stalk with coloured water inside groups of xylem vessels.
Explain why coloured water moved up the stalks.(3)
Water evaporates/is transpired (from leaves/ stalk/celery/plant) (1)
Water potential gradient/lower water potential creates tension/pulls up water (1)
Hydrogen bonds/cohesion/adhesion maintains column (1)
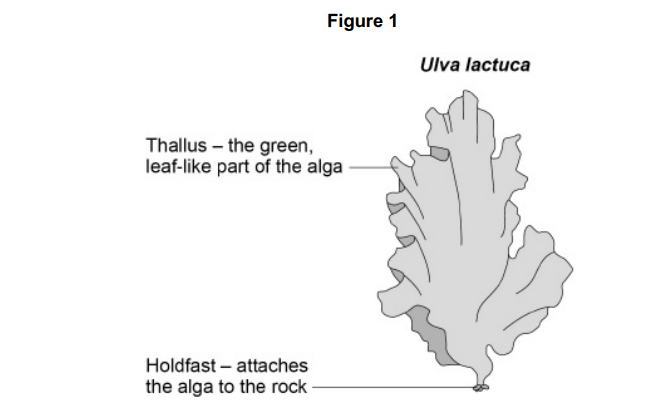
Ulva lactuca is an alga that lives on rocks on the seashore. It is regularly covered by seawater. Figure 1 shows a diagram of one Ulva lactuca alga.
Unlike plants, Ulva lactuca does not have xylem tissue. Suggest how Ulva lactuca is able to survive without xylem tissue(1)
short diffusion pathway (to cells) (1)
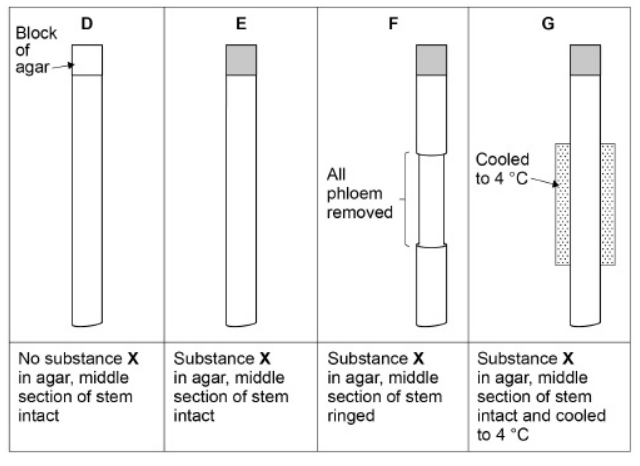
Under the correct conditions, new roots grow from the cut end of a plant stem. A scientist investigated the effect of substance X on the growth of new roots. She used a ringing experiment to investigate the movement of substance X in stems taken from lemon plants. She cut out a length of stem from each plant. She then put a small block of agar on the top of each length of stem. Some agar blocks contained substance X.
The diagram below shows how she treated each length of stem.
She grew the lengths of stem in the same environmental conditions for 6 weeks, and then found the number of roots per length of stem. Roots grew at the other end of the stem from where the agar blocks were placed. The table below shows the scientist’s results
Treatment | Mean number of roots per length of stem |
|---|---|
D | 5 |
E | 11 |
F | 4 |
G | 3 |
Using the diagram and the table above, what can you conclude from treatments D and E about root growth? (3)
(D shows) substance (X) is not required for (some) root growth / production of roots (1)
Substance X moves through plant (1)
(E shows) substance (X) causes / increases / doubles number of roots / root growth (1)

Under the correct conditions, new roots grow from the cut end of a plant stem. A scientist investigated the effect of substance X on the growth of new roots. She used a ringing experiment to investigate the movement of substance X in stems taken from lemon plants. She cut out a length of stem from each plant. She then put a small block of agar on the top of each length of stem. Some agar blocks contained substance X.
The diagram below shows how she treated each length of stem.
She grew the lengths of stem in the same environmental conditions for 6 weeks, and then found the number of roots per length of stem. Roots grew at the other end of the stem from where the agar blocks were placed. The table below shows the scientist’s results
Treatment | Mean number of roots per length of stem |
|---|---|
D | 5 |
E | 11 |
F | 4 |
G | 3 |
The mass flow hypothesis is used to explain the movement of substances through phloem. Evaluate whether the information from this investigation supports this hypothesis. Do not consider statistical analysis in the answer. (4)
For
F shows phloem is involved (1)
(G shows) respiration / active transport is involved (in flow / movement) (1)
Against
No (role for) osmosis / hydrostatic pressure / water movement (1)
Roots still grow without (intact/functioning) phloem (1)
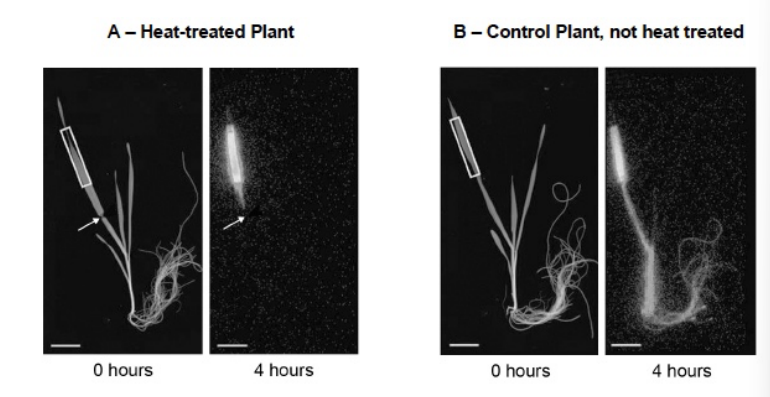
Scientists investigated the effect of a heat treatment on mass transport in barley plants.
• They applied steam to one short section of a leaf of the heat-treated plants.
This area is shown by the arrows in Figure 1.
• They did not apply steam to the leaves of control plants.
• They then supplied carbon dioxide containing radioactively-labelled carbon
to each plant in the area shown by the rectangular boxes in Figure 1.
• After 4 hours, they:
◦ found the position of the radioactively-labelled carbon in each plant.
These results are shown in Figure 1.
◦ recorded the water content of the parts of the leaf that were supplied
with radioactively-labelled carbon dioxide. These results are shown in
the table.
Plant from which the leaf was taken | Water content of leaf / % of maximum (± 2 standard deviations) |
|---|---|
Heat-treated Plant A | 84.6 (±11.3) |
Control Plant, not heat treated B | 92.8 (±8.6) |
The scientists concluded that this heat treatment damaged the phloem. Explain how the results in Figure 1 support this conclusion. (2)
Movement in phloem requires living cells/respiration/active transport/ATP (1)
Heat treatment damages living cells so transport in the phloem throughout the plant only in plants that were untreated/B/control (1)
Scientists investigated the effect of a heat treatment on mass transport in barley
plants.
• They applied steam to one short section of a leaf of the heat-treated plants.
This area is shown by the arrows in Figure 1.
• They did not apply steam to the leaves of control plants.
• They then supplied carbon dioxide containing radioactively-labelled carbon
to each plant in the area shown by the rectangular boxes in Figure 1.
• After 4 hours, they:
◦ found the position of the radioactively-labelled carbon in each plant.
These results are shown in Figure 1.
◦ recorded the water content of the parts of the leaf that were supplied
with radioactively-labelled carbon dioxide. These results are shown in
the table.
Plant from which the leaf was taken | Water content of leaf / % of maximum (± 2 standard deviations) |
|---|---|
Heat-treated Plant A | 84.6 (±11.3) |
Control Plant, not heat treated B | 92.8 (±8.6) |
The scientists also concluded that this heat treatment did not affect the xylem. Explain how the results in the table support this conclusion. (2)
(The water content of the leaves was) not different because (means ± 2) standard deviations overlap (1)
Water is (therefore) still being transported in the xylem (to the leaf) (1)
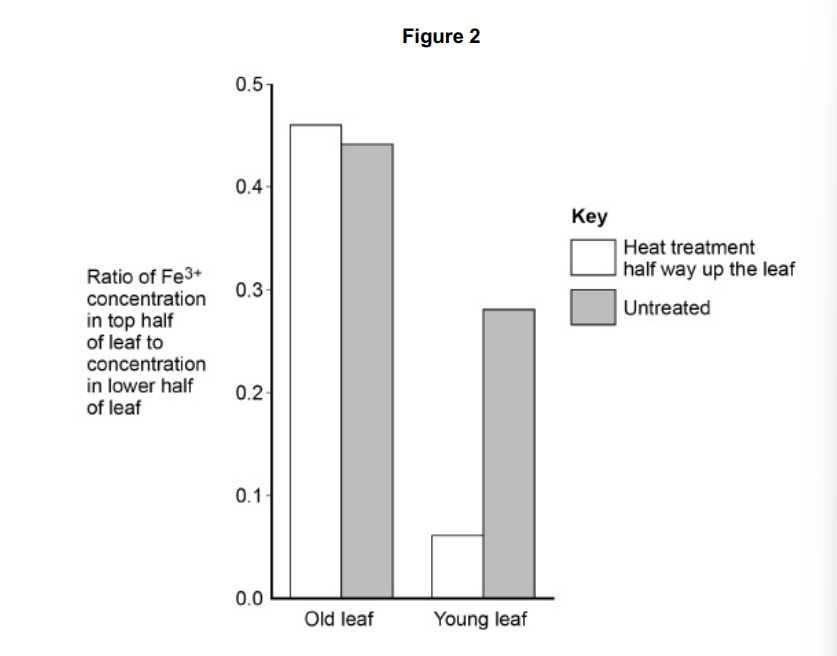
The scientists then investigated the movement of iron ions (Fe3+) from the soil to old and young leaves of heat-treated barley plants and to leaves of plants that were not heat treated. Heat treatment was applied half way up the leaves. The scientists determined the concentration of Fe3+ in the top and lower halves of the leaves of each plant. Their results are shown in Figure 2.
What can you conclude about the movement of Fe3+ in barley plants? Use all the information provided. (4)
Heat treatment has a greater effect on young leaves than old (1)
(Suggests) Fe3+ is (mostly) transported in phloem in young leaf (1)
All ratios show there is less Fe3+ in the top than the lower part of leaves (1)
Higher ratio of Fe3+ in (all/untreated) old leaves than (all/untreated) young (1)
Describe the cohesion-tension theory of water transport in the xylem. (5)
Water lost from leaf because of transpiration / evaporation of water (molecules) (1)
Lowers water potential of mesophyll / leaf cells (1)
Water pulled up xylem (creating tension) (1)
Water molecules cohere / ‘stick’ together by hydrogen bonds (1)
(forming continuous) water column (1)
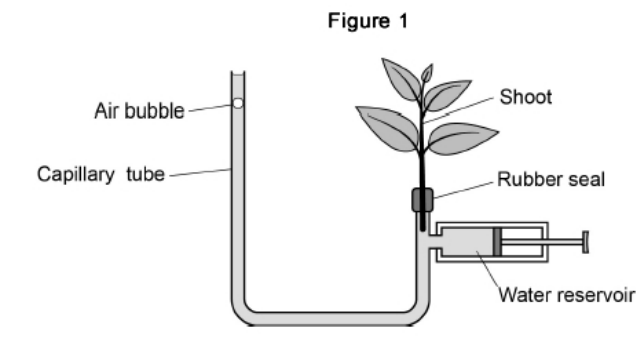
A student used a potometer to measure the movement of water through the shoot of a plant. The potometer is shown in Figure 1. As water is lost from the shoot, it is replaced by water from the capillary tube.
The student wanted to determine the rate of water loss per mm2 of surface area of the leaves of the shoot in Figure 1. Outline a method she could have used to find this rate. You should assume that all water loss from the shoot is from the leaves. (3)
draw round (each) leaf on graph paper and count squares (1)
of both sides of (each) leaf (1)
divide rate (of water loss/uptake from potometer) by (total) surface area (of leaves) (1)
The rate of water movement through a shoot in a potometer may not be the same as the rate of water movement through the shoot of a whole plant. Suggest one reason why (1)
Plant has roots (1)
Describe the mass flow hypothesis for the mechanism of translocation in plants (4)
In source/leaf sugars actively transported into phloem (1)
by companion cells (1)
Lowers water potential of sieve cell / tube and water enters by osmosis (1)
Increase in pressure causes mass movement (towards sink / root) (1)
Sugars used / converted in root for respiration for storage (1)
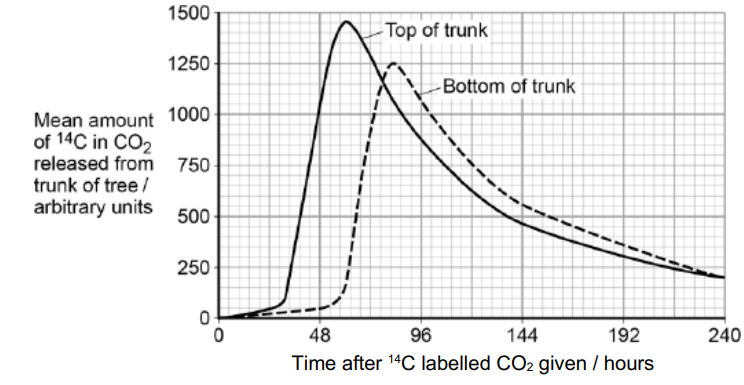
Scientists measured translocation in the phloem of trees. They used carbon dioxide labelled with radioactive 14C. They put a large, clear plastic bag over the leaves and branches of each tree and added 14CO2. The main trunk of the tree was not in the plastic bag. At regular intervals after adding the 14CO2 to the bag, the scientists measured the amount of 14CO2 released from the top and bottom of the main trunk of the tree. On the surface of the trunk of these trees, there are pores for gas exchange. The following figure shows the scientists’ results
How long did it take the 14C label to get from the top of the trunk to the bottom of the trunk? Explain how you reached your answer. (2)
(About) 30 hours (1)
Time between peak 14C at top of trunk and bottom (1)

Scientists measured translocation in the phloem of trees. They used carbon dioxide labelled with radioactive 14C. They put a large, clear plastic bag over the leaves and branches of each tree and added 14CO2. The main trunk of the tree was not in the plastic bag. At regular intervals after adding the 14CO2 to the bag, the scientists measured the amount of 14CO2 released from the top and bottom of the main trunk of the tree. On the surface of the trunk of these trees, there are pores for gas exchange. The following figure shows the scientists’ results
What other information is required in order to calculate the mean rate of movement of the 14C down the trunk? (1)
Length of trunk (between top and bottom) (1)
Describe the role of xylem in the mass transport of water in plants (5)
Xylem vessels transport water from roots to leaves as part of the transpiration stream (1)
Water moves up the xylem due to cohesion between water molecules, creating a continuous water column (1)
Transpiration from the leaf structure creates tension in the xylem, pulling water upwards (1)
Adhesion between water molecules and cohesion between the water molecules and xylem walls help maintain the column and resists gravity (1)
Xylem vessels are dead, hollow and lignified , reducing resistance to flow and preventing collapse under tension (1)
The student then compared the rate of transpiration (evaporation of water) from the two species of plant. She did this by measuring the rate of water uptake by each plant species. Suggest two reasons why the rate of water uptake by a plant might not be the same as the rate of transpiration.(2)
Water used in photosynthesis (1)
Water used in hydrolysis (1)