ECON 209 Quiz 1
1/102
Earn XP
Description and Tags
Name | Mastery | Learn | Test | Matching | Spaced | Call with Kai |
|---|
No analytics yet
Send a link to your students to track their progress
103 Terms
Economics
The study of choices people make to attain their goals, given their scarce resources
Scarcity:
A situation in which unlimited wants exceed the limited resources available to fulfill those wants
there are not enough goods and services to meet everyone’s needs and desires
An Economy:
A set of interrelated consumption and production activities in order to maintain a standard of living.
Market
A group of buyers and sellers of a good or service and the institutions or arrangements by which they come together to trade.
Land
Natural resources that are used in the production of goods and services. ex: forests, oil and gas, minerals
Capital
Goods used to make other goods. 2 types: physical + financial
Physical Capital:
machines, tools, trucks, etc
Financial Capital:
Money, bonds, stocks
Labour:
Sweat equity and the intelligence that is needed to produce goods and services.
includes all mental and physical human resources, including intelligence, and skills
Tangibility of goods vs services:
Goods are TANGIBLE (cars, shoes, clothes)
Services are INTANGIBLE (haircuts, education, cleaning)
3 Key economic IDEAS:
People are rational.
People respond to incentives.
Rational People make optimal decisions at the margin
Rationality
People make choices based on what they believe will make them happy. People do not deliberately do things to make themselves worse off
Incentives
Factors that drive individuals to act in a certain way based on changing costs and benefits.
Marginal cost and benefit (MC and MB):
the additional cost or benefit associated with a small amount extra of some action.
ex: Should you watch an extra hour of TV, or study instead?
Marginal Analysis
Comparing the additional cost or benefit associated with a small amount extra of some action.
Opportunity costs:
what is given up when a choice or decision is made, including the best
the opportunity cost of you getting a university degree is the foregone salary that you give up by attending university
Economic Models
Simplified versions of reality used to analyze real-world economic applications.
Microeconomics
The study of how households and firms make decisions and interact in markets.
Macroeconomics
The study of economy-wide phenomena, including inflation, unemployment, and economic growth.
Economic Systems: 3 Economic QUESTIONS
What goods and services will be produced by society?
How will the Goods and Services be Produced?
Who will receive the Goods and Services Produced?
PRICES
ideas of pure market economy (Individualism):
Private Property
Rule of Law
Individual Rights + Freedoms
Competition
Economic Freedom
Self Interest
PEACCC
ideas of centrally planned economy (collectivism):
Public Property
Economic Equality
Adherence to collective norms
Cooperation
Collective interest
Collective Responsibilities
Centrally Planned Economy
An economic system where government committees explicitly answer the three basic economic questions.
“command economy”
left side of spectrum
Communism
Cuba
Karl Marx, Communist Manifesto
PEACCC
Pure Market Economy
An economic system where households and firms (INDIVIDUALS) interact in markets to answer economic questions with minimal government intervention.
“Laissez-Faire”
right side of spectrum
capitalism
Singapore
Adam Smith, Invisible Hand
PRICES
Mixed Economy
An economic system that combines elements of both centrally planned and market economies.
Ex: Canada
Invisible Hand
The concept introduced by Adam Smith, suggesting that individuals pursuing their self-interest can lead to desirable market outcomes.
MARKET ECONOMY
an economy that allocates resources through the decentralized decisions of many firms and households as they interact in markets for goods and services.
T/F: Market economies tend to be more efficient than centrally-planned economies
TRUE
What do Market Economies Promote?
Productive efficiency: where goods or services are produced at the lowest possible cost
Allocative efficiency: where production is consistent with consumer preferences: the marginal benefit of production is equal to its marginal cost
In what scenarios do Market Economies NOT result in fully efficient outcomes?
government interference
Market outcomes might ignore people who are not involved in transactions
sometimes not time efficient
Equity
Fair distribution of economic benefits among individuals in society.
What are the two reasons we need government intervention?
Property rights
Market Failure
Market failure
When a market on its own fails to allocate resources efficiently.
Market Power (Monopoly)
EXTERNALITY
the impact of one person’s actions on the well-being of a bystander
MARKET POWER:
the ability of a single economic actor (or a small group of actors) to have a substantial influence on market prices.
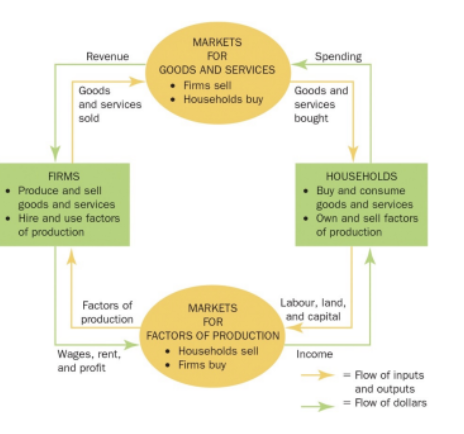
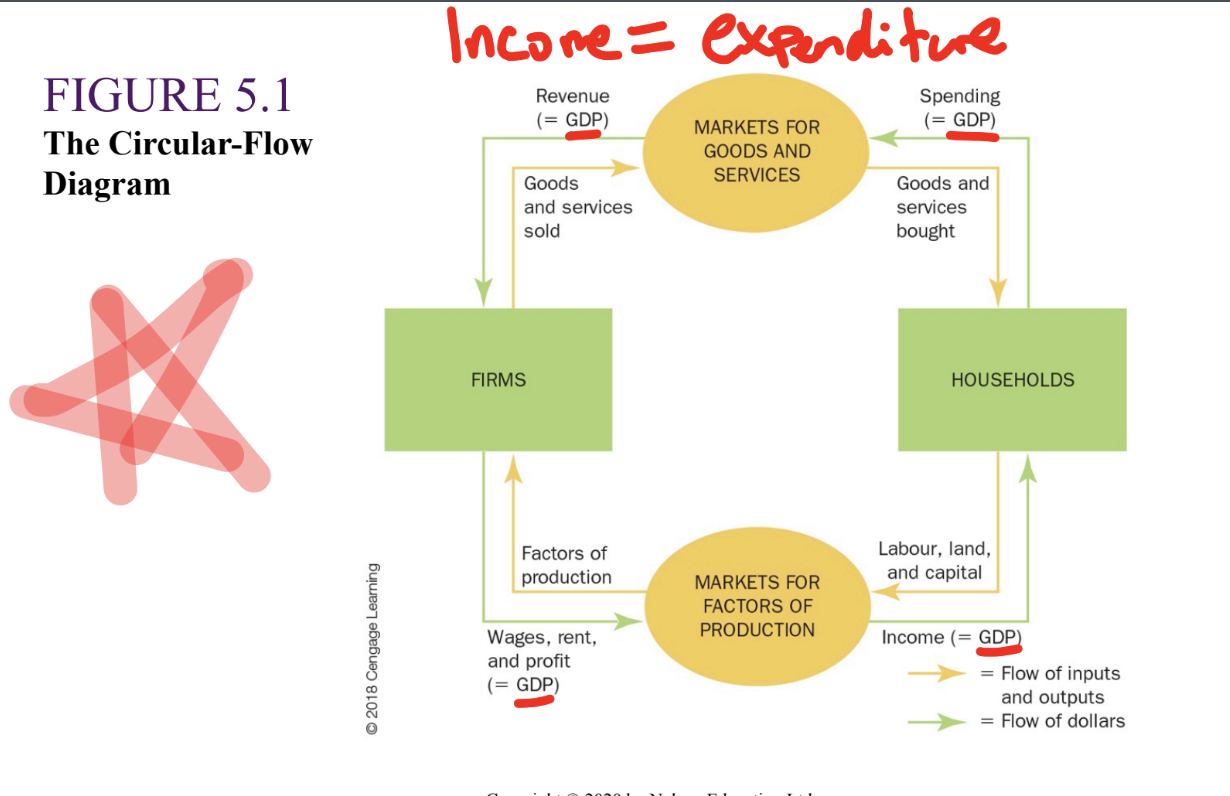
Circular flow
A diagram illustrating how money moves through markets between households and firms in an economy.
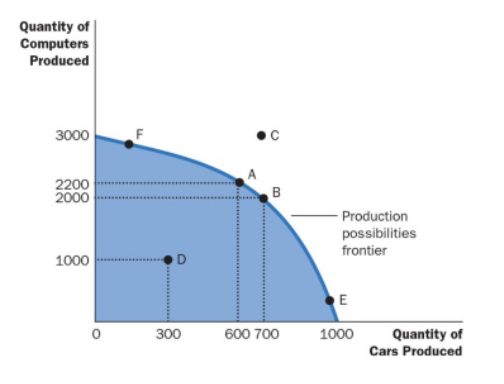
Production Possibilities Frontier (PPF)
A graph showing the maximum combination of goods an economy can produce given its resources and technology.
positive statement
a statement that describes the world as it is (was or will be)
can be tested by empirical analysis or measurements.
normative statement
statement that describes the world as it should or ought to be. Normative statements are value judgements (often contain the words ought or should)
Normative statements can also be used for events that have happened in the past (as long as the statement includes an opinion)
How to turn a normative statement into a positive one?
statement including opinion (ought/should) with numbers and evidence
ex: user fee of $50 should reduce doctor utilization rates by 10%
3 Characteristics of Perfect Competition
Many buyers and sellers- anyone can buy or sell
Identical products
No barriers to entry
Quantity demanded:
The amount of a good or service that a consumer is willing and able to purchase at a given price.
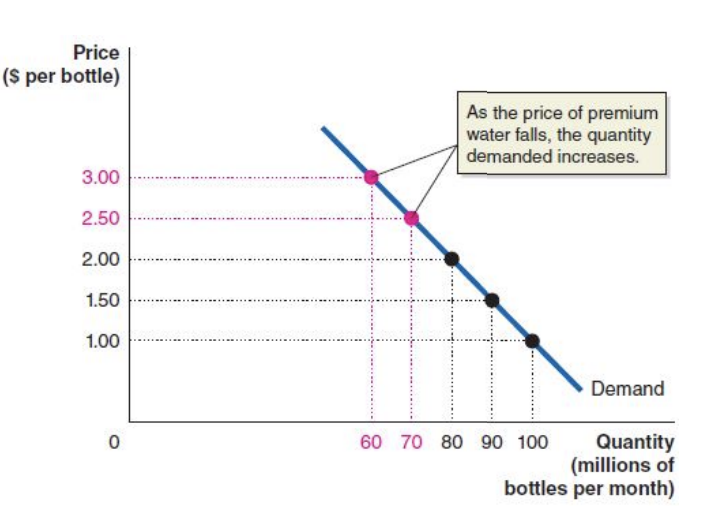
Demand curve:
A curve that shows the relationship between the price of a product and the quantity of the product demanded.
inverse relationship
Market demand:
the demand by all the consumers of a given good or service.
Ceteris Paribus
The assumption that all other variables are constant when analyzing the relationship between two variables—such as price and quantity demanded.
The Law of Demand
when the price falls quantity demanded will rise (all else equal). Implication: Demand curve slopes downward, inverse relationship
Substitution effect:
The change in the quantity demanded due to a change in price making the good more or less expensive relative to other goods that are substitutes.
(the price of a product falls, consumer can now choose it over other similar products)
Income effect:
The change in the quantity demanded due to the effect of a change in the good’s price on consumers’ purchasing power
(the price of a product falls, consumer can now buy more)
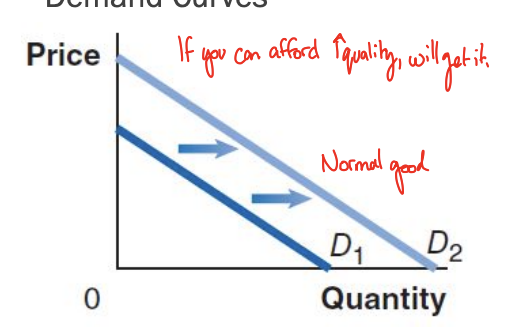
A change in something other than price will cause…
the entire demand/supply curve to shift. Right = increase, left = decrease.
Factors that Shift Market Demand
consumer income
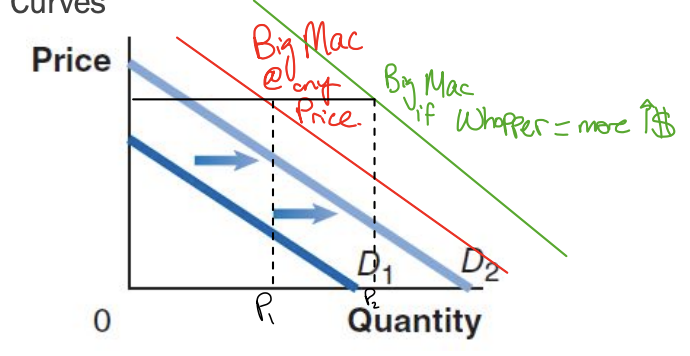
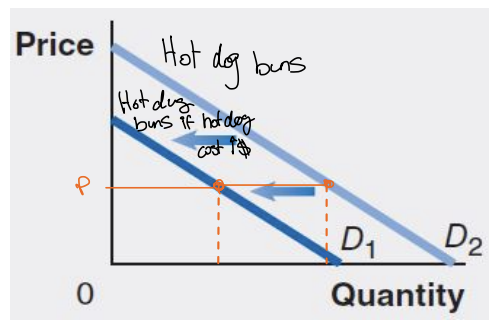
Prices of related goods
increase if products are substitutes, decreases if compliments
tastes
population + demographics
expectations
Normal good:
A good for which the demand increases as income rises, and decreases as income falls
if you can afford good quality, you’ll buy it
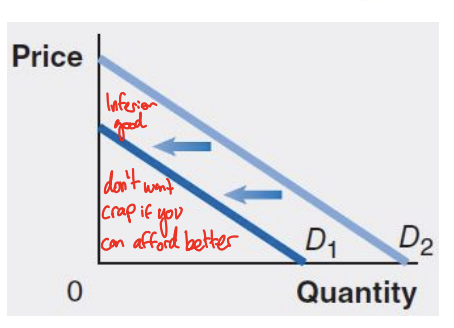
Inferior good:
A good for which the demand decreases as income rises, and increases as income falls.
if you can afford good quality, you won’t get back quality
or, lesser income = poorer quality
Substitutes:
Goods and services that can be used for the same purpose
Complements:
Goods and services that are used together.
How do expectations about future prices affect demand?
An expected increase in the price tomorrow increases demand today (gas going up tomorrow = fuel up today)
An expected decrease in the price tomorrow decreases demand today. (gas down tomorrow = fuel tomorrow)
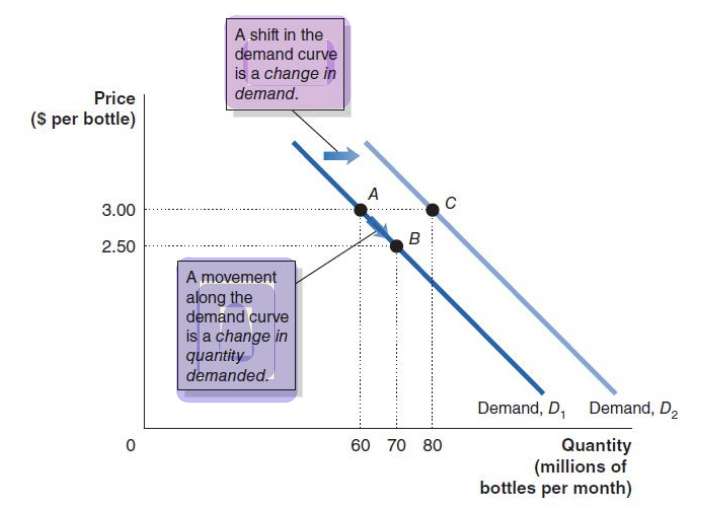
Change in quantity demanded vs change in demand.
CIQD: A change in the price of the product being examined causes a movement along the demand curve.
CID: Any other change affecting demand causes the entire demand curve to shift.
Quantity supplied:
The amount of a good or service that a firm is willing and able to supply at a given price.
Supply curve:
A curve that shows the relationship between the price of a product and the quantity of the product supplied.
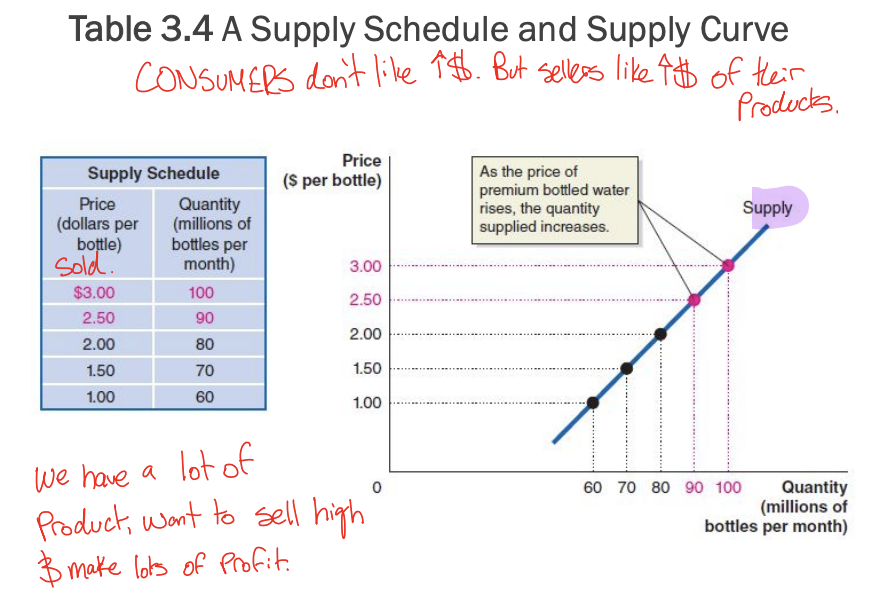
The law of supply:
Holding everything else constant, when price rises quantity supplied increases. Implication: supply curves slope upward.
Variables that Shift Market Supply
Prices of inputs (labour cost)
Technological change (ease of production)
Prices of substitutes in production
Number of firms in the market (competition)
Expected future prices (sellers wait till high price to sell lots)
What are “inputs”
Inputs are things used in the production of a good or service.
increase in price to produce = less profit = less supply
cheap labour = make lots = sell lots
Change in Supply vs. Change in Quantity Supplied
CIQS: A change in the price of the product being examined causes a movement along the supply curve
CIS: Any other change affecting supply causes the entire supply curve to shift
Market Equilibrium
a situation in which quantity demanded equals quantity supplied.
Consumer surplus vs surplus
above equilibrium price = “surplus”
CS: more demand than supply
Surplus: more supply than demand
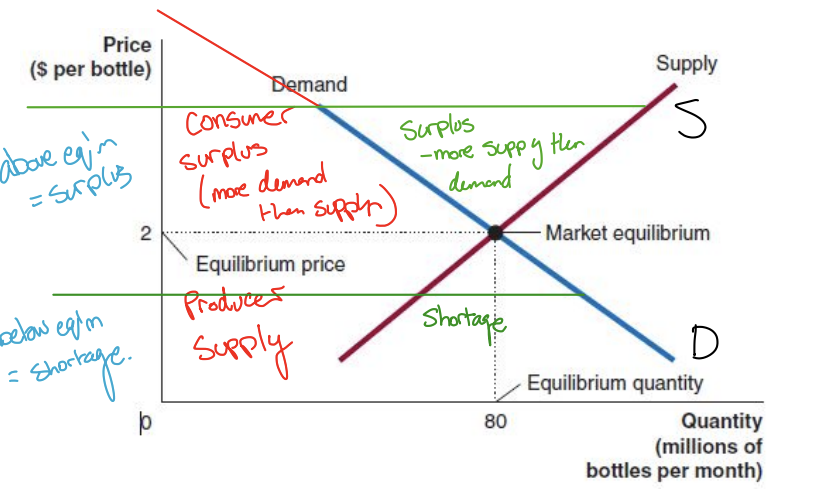
producer supply vs. shortage
below equilibrium price = “shortage”
PS: the amount that producers want to sell is less than the amount that consumers want to buy
Shortage: quantity demanded is greater than quantity supplied.
T/F: decrease in price will cause an increase in demand
FALSE:
The decrease in price will cause a movement along with demand curve, but not an increase in demand.
The demand curve already describes how much of the good consumers want to buy, at any given price.
Gross domestic product (GDP)
the market value of all final goods and services produced within a country in a given time period. (total income of nation)
best single measure of a society’s economic well-being
Circular Flow Diagram for GDP
INCOME = EXPENDITURE
T/F: GDP includes ONLY the value of final goods
True: The value of intermediategoods is already included in the prices of the final goods.
(you don’t count paper + book, only book)
intermediate goods vs final goods:
good is produced and is added to a firm’s inventory of goods to be used or sold later
you buy flour = final good
bakery buys flour = intermediate good
Components of GDP equation:
Y = C + I + G + NX
GDP = Consumption + Investment + Gov. purchases + Net Exports (export - import)
determine how much GDP and each of its components is affected:
Debbie spends $200 to buy her husband dinner at a toronto restaurant:
Consumption increases by $200
therefore GDP increases by $200
determine how much GDP and each of its components is affected:
Sarah spends $1800 on a new laptop to use in her publishing business. The laptop was built in China.
Investment rises by $1800, net exports fall by $1800, GDPis unchanged.
determine how much GDP and each of its components is affected:
Jane spends $1200 on a computer to use in her editing business. She got last year’s model on sale for a great price from a local manufacturer.
Current GDP and investment do not change because the computer was built last year.
determine how much GDP and each of its components is affected:
General Motors builds $500 million worth of cars, butconsumers only buy $470 million worth of them.
Consumption rises by $470 million, inventory investment rises by $30 million, and GDP rises by $500 million
THE COMPONENTS OF GDP:
Consumption
spending by households on goods and services,except for purchases of new housing.
THE COMPONENTS OF GDP:
Investment
spending on capital equipment, inventories, and structures, including household purchases of new housing
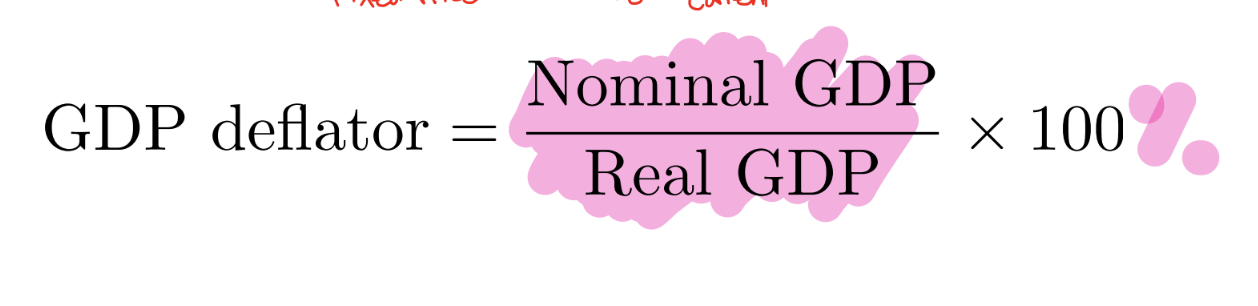
Nominal GDP:
the production of goods and services valued at current prices.
=P(now) * Q(now)
Real GDP
the production of goods and services valued atconstant prices
=P(base) * Q(now)
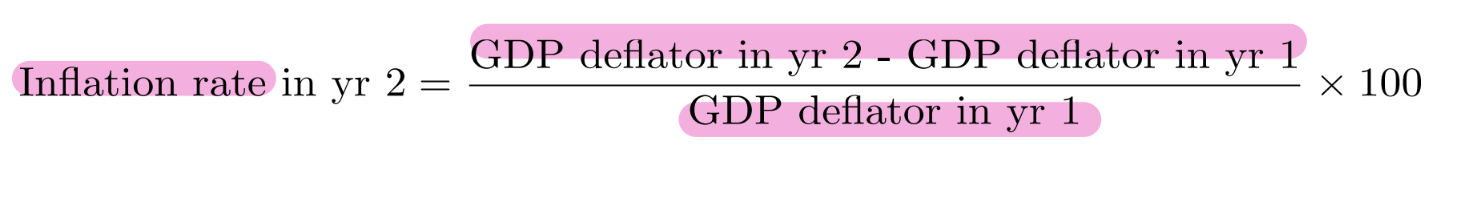
GDP Deflator
price level calculatedas the ratio of nominal GDP to real GDP times 100.
Inflation rate
percentage change in some measure of the price level from one period to the next
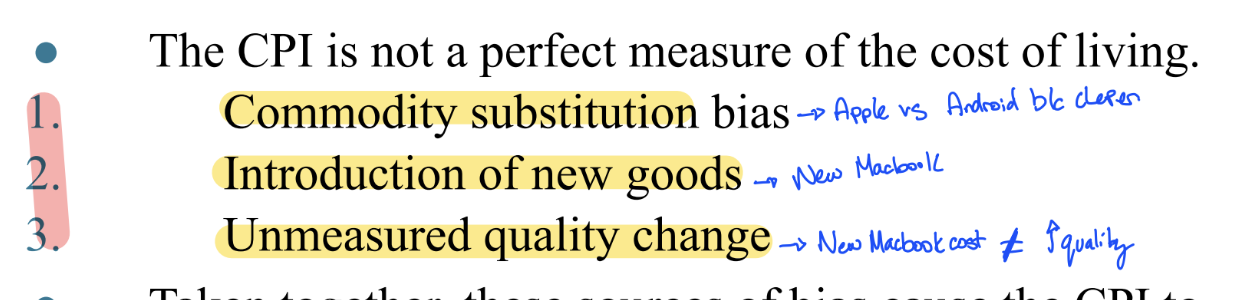
Consumer price index (CPI)
overall measure of the cost of the goods and services bought by a typical consumer
ANY good, not necessarily this country/year
FIVE STEPS TO COMPUTING THE CPI AND THE INFLATION RATE
Determine the basket.
Find prices of each G&S of Basket @ each time
Compute Basket @ diff times
CPI = basket cost (now) / basket cost (base)
inflation rate = [CPI2-CPI1 ] / CPI1 or $basket2-$basket1 / basket1
![<ol><li><p><span>Determine the basket.</span></p></li><li><p><span>Find prices of each G&S of Basket @ each time</span></p></li><li><p><span>Compute Basket @ diff times</span></p></li><li><p><span>CPI = basket cost (now) / basket cost (base)</span></p></li><li><p><span>inflation rate = [CPI<sub>2</sub>-CPI<sub>1</sub> ] / CPI</span><sub>1</sub><span> or $basket</span><sub>2</sub><span>-$basket</span><sub>1</sub><span> / basket</span><sub>1</sub></p></li></ol>](https://knowt-user-attachments.s3.amazonaws.com/06611cf5-7b19-4024-8c4f-54c56687abb9.png)
3 problems with CPI as not a measure of standard of living
Commodity substitution bias
Introduction of new goods
Unmeasured quality change
Indexation
the automatic correction of a dollar amount for the effects of inflation by law or contract
COLA (cost-of-living allowance)
automatically raises the wage when the CPI raises (only for gov’t employees)
Nominal interest rate:
the interest rate that is usually reported WITHOUT a correction for the effects of inflation
Real interest rate:
the interest rate that is corrected for the effects of inflation
Shoeleather costs
resources wasted when inflation encourages people to reduce their money holdings.
Menu costs
costs of changing prices.
How does inflation tend to raise the tax burden on income earned from savings?
income tax treats the nominal interest earned on savings as income, even though part of the nominal interest rate merely compensates for inflation.
Labour force:
sum of employed + unemployed workers in the economy
Employed persons:
did paid work, unpaid work for a family business, or worked for themselves (or were temporarily away from their jobs).
Unemployed persons:
Someone who is not currently at work but who is available for work and who has actively looked for work during the previous four weeks.
How old is the “working age”
15+ years old
Problems with Measuring the Unemployment Rate
may understate unemployment (judgement b/w unemployed/not in labour force)
underemployment (nothing to measure part time vs full time)
overstate unemployment (people lie for tax evasion)
The four types of unemployment are:
Frictional unemployment
Structural unemployment
Cyclical unemployment
Seasonal unemployment
Frictional unemployment:
Short-term unemployment that arises from the process of matching workers with jobs.
job searching
Structural unemployment:
Unemployment that arises from a persistent mismatch between the skills and attributes of workers and the requirements of jobs.
Cyclical unemployment:
Unemployment caused by a business cycle recession.
aka being “laid off”