Year 1 stats
1/13
Earn XP
Description and Tags
- [ ] Single variable data, scatter diagrams & correlation, measures of central tendency & variation, standard deviation, outliers, coding NEED to add correlation and regression linear and exponential
Name | Mastery | Learn | Test | Matching | Spaced | Call with Kai |
|---|
No analytics yet
Send a link to your students to track their progress
14 Terms
Measures of location are
Single values that describe a position in a data set eg percentiles, maximum, mean
Measures of central tendency are
Values that describe the centre of the data eg mean, mode, median
Measures of spread are
To do with how the data is distributed eg range, standard deviation, IQ range
Symbol for mean on calculator
X with a line on top
How to find the position of the median for listed data
1) n/2
2) if a decimal round up, If a whole use halfway between this item and the next
When do you use linear interpolation
When finding a specific value that is in a class interval on a frequency table eg when finding the median
What is something to lookout for when doing linear interpolation
The class width is rounded so then need to use upper and lower limits
In grouped data what value do you use for the median
N/2
(AND JUST LEAVE IT LIKE THAT)
Describe variance in words
Average squared distance from the mean
Or the mean of the squares minus the square of the mean (msmsm)
When coding what effect does addiction and subtraction have on variance
No effect
When coding what effect does multiplication by k have on variance
Multiplies the variance by k²
When coding what does any linear transformation do to the mean eg y = mx+c
It transforms the mean in the same way
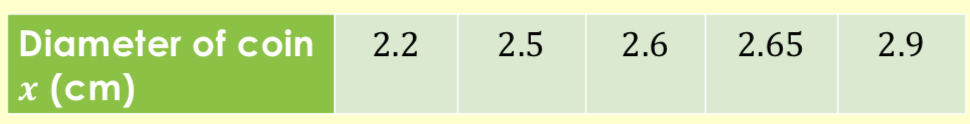
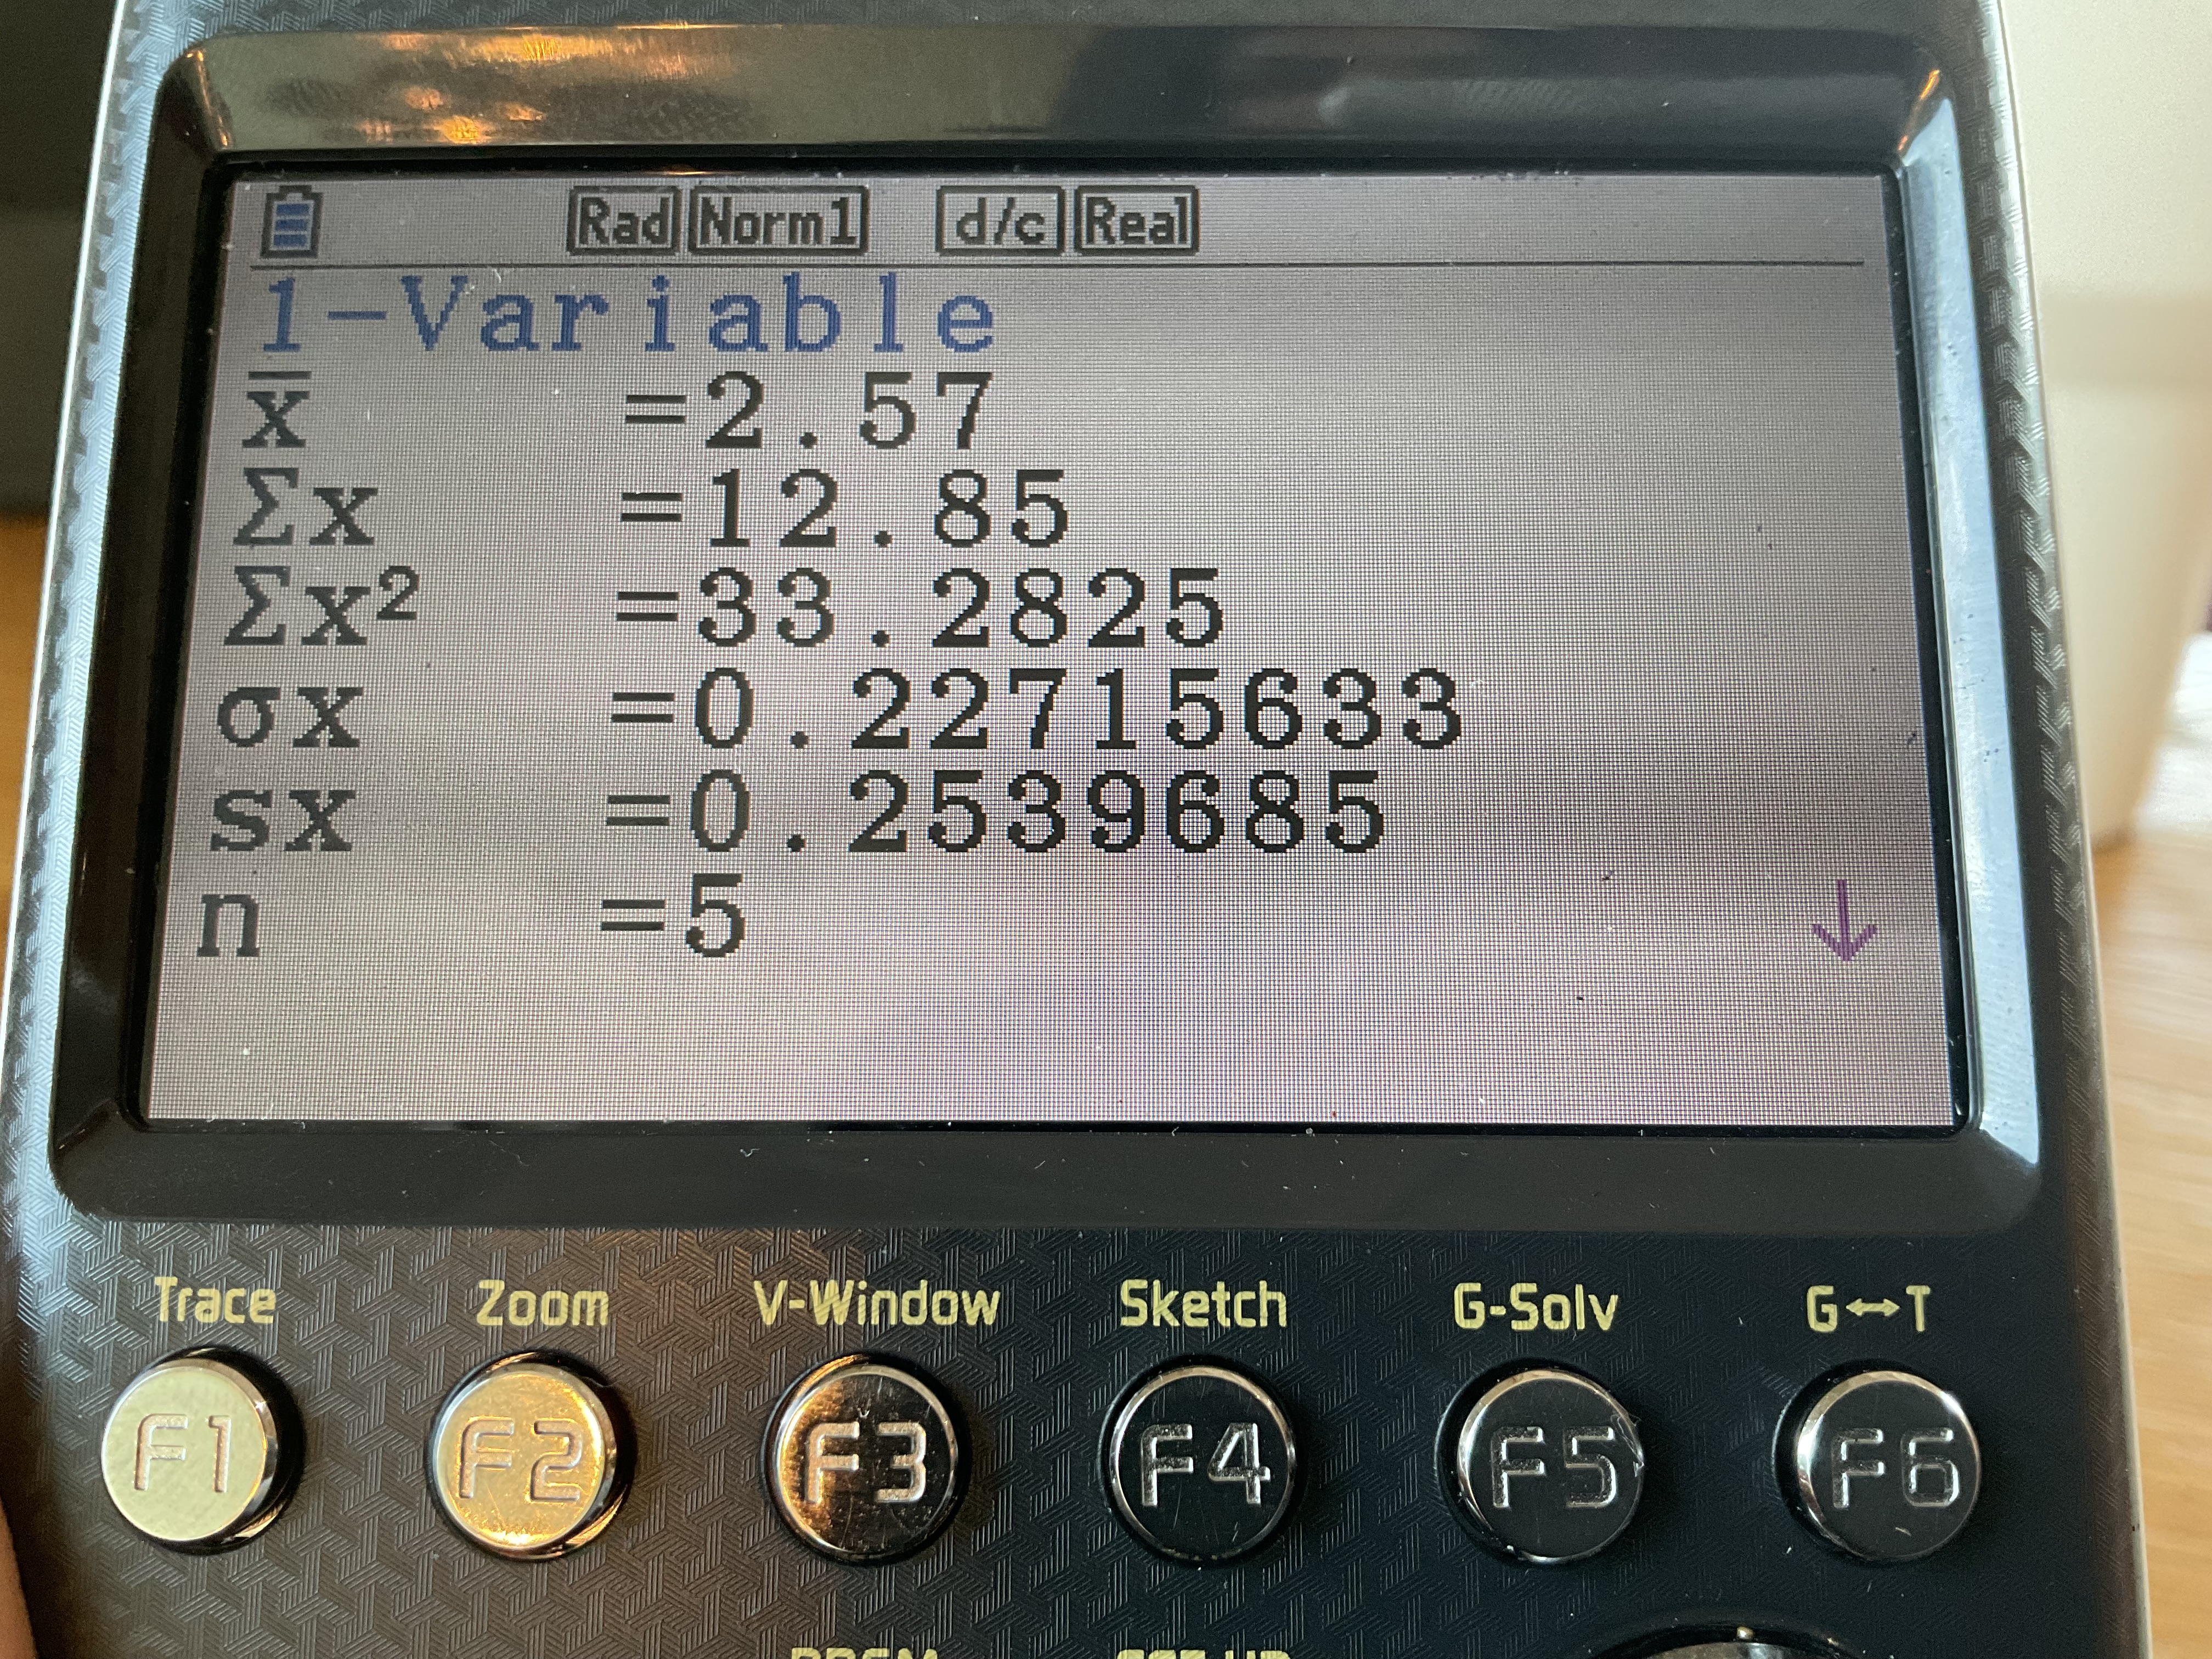
How to calculate statistics of data on a calculator for 1 variable
Enter numbers into list 1
F2 - calc
F1 - 1-VAR
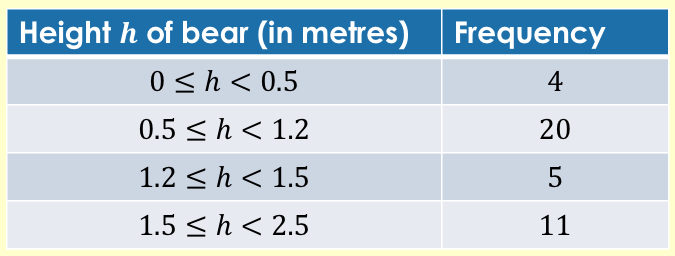
Find the mean using calculator
List 1 - enter the midpoint of each hight group
List 2 - enter the frequencies
F2 - Calc
F6 - set
1 var X list : list b1
1 Var freq list 2
F1 - 1 var
Mean = 1.16875