Looks like no one added any tags here yet for you.
Ecological community
Group of species that occupy an area and interact.
Species interactions
Can affect the distribution and abundance of a species.
Species richness (S)
The number of different species represented in a community.
Species evenness (E)
A measure of how equal the abundances of the species are.
Relative abundance (p)
The proportion of each species relative to the total number of species.
Rank abundance diagram
A graphical representation of the relative abundance of species in a community.
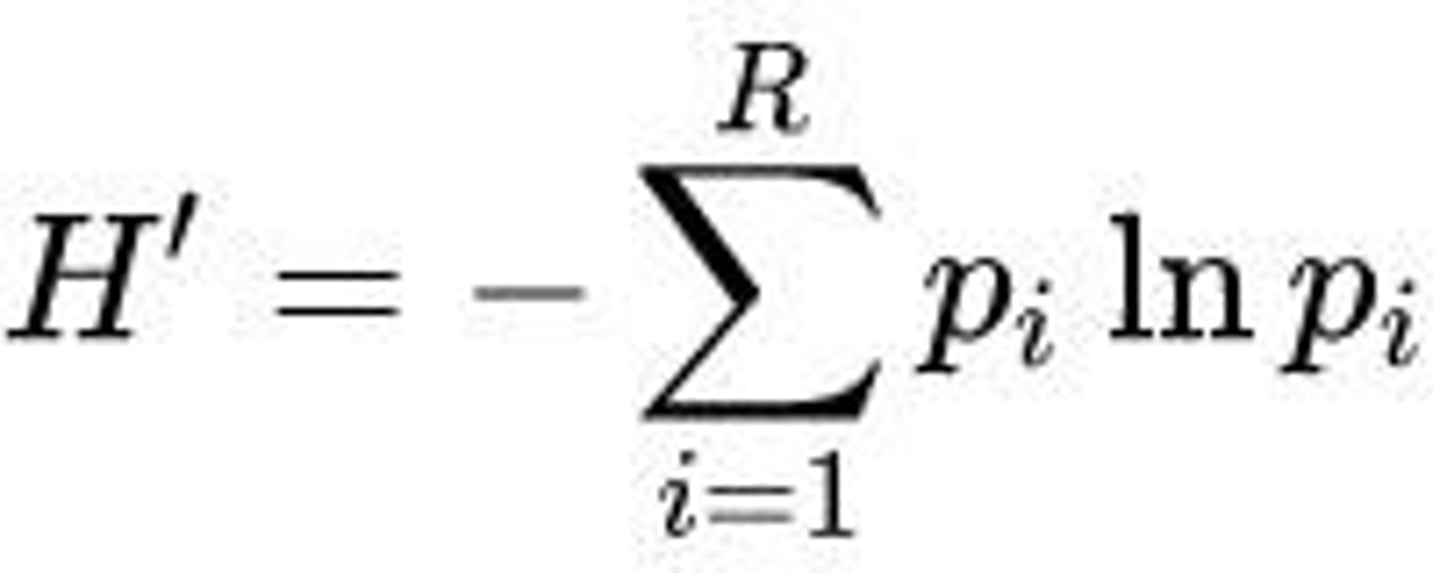
Shannon-Weiner Index (H')
A measure of species diversity that accounts for both abundance and evenness.
Shannon Weiner (H’)
A measure of diversity that considers both richness and evenness of species.
Dominance
The degree to which a few species dominate the community.
Keystone species
A species that has a disproportionately large effect on its environment relative to its abundance.
Trophic levels
The hierarchical levels in an ecosystem, comprising producers, consumers, and decomposers.
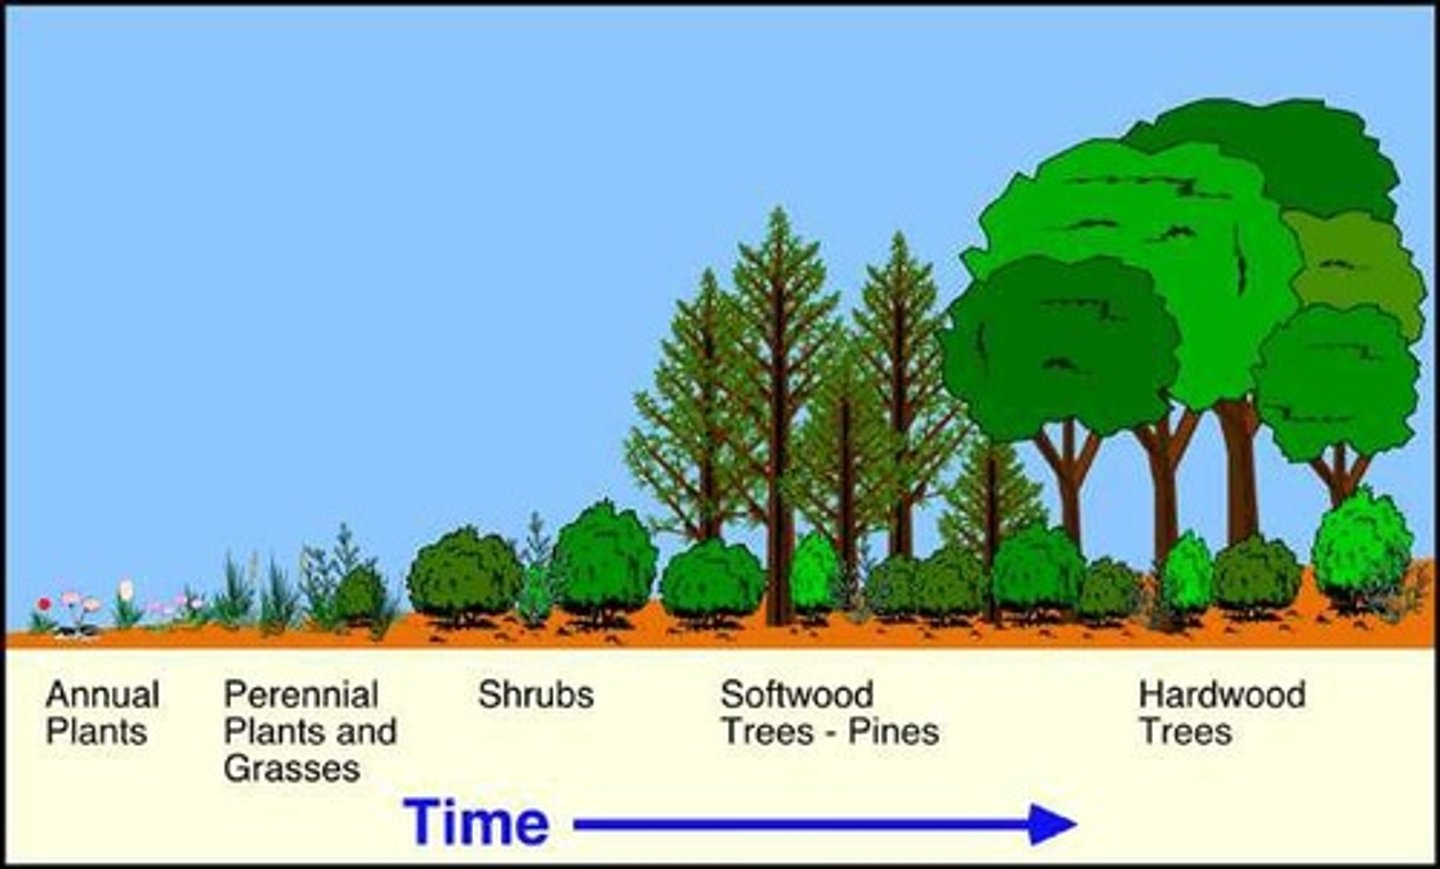
Ecological succession
The process of change in the species structure of an ecological community over time.
Disturbance
An event that disrupts the structure of an ecosystem, community, or population.
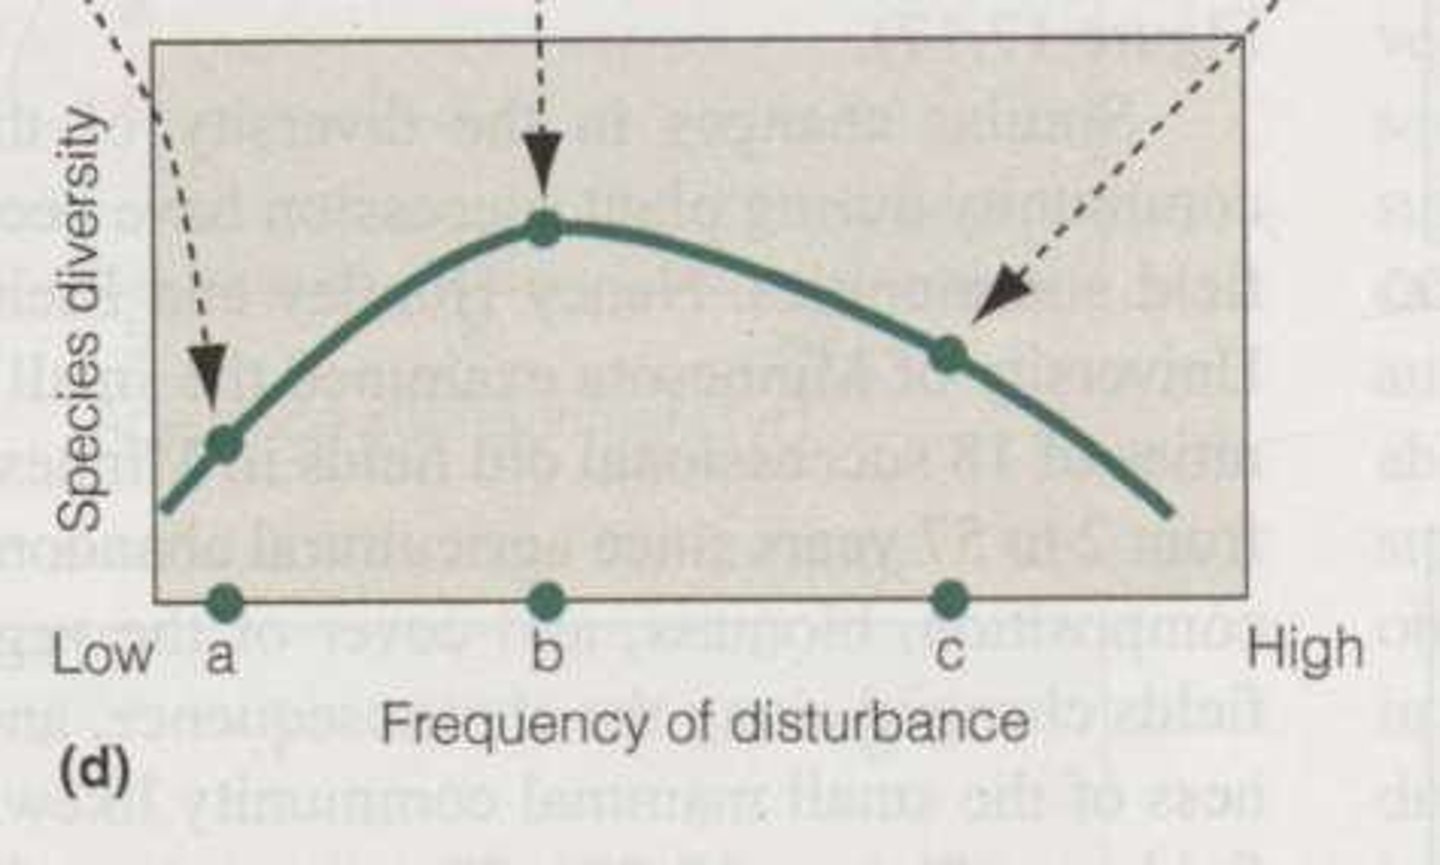
Intermediate Disturbance Hypothesis
The hypothesis that ecosystems experiencing intermediate levels of disturbance will have higher levels of diversity.
Island Biogeography Theory
A theory that explains the number of species on an island based on its size and distance from the mainland.
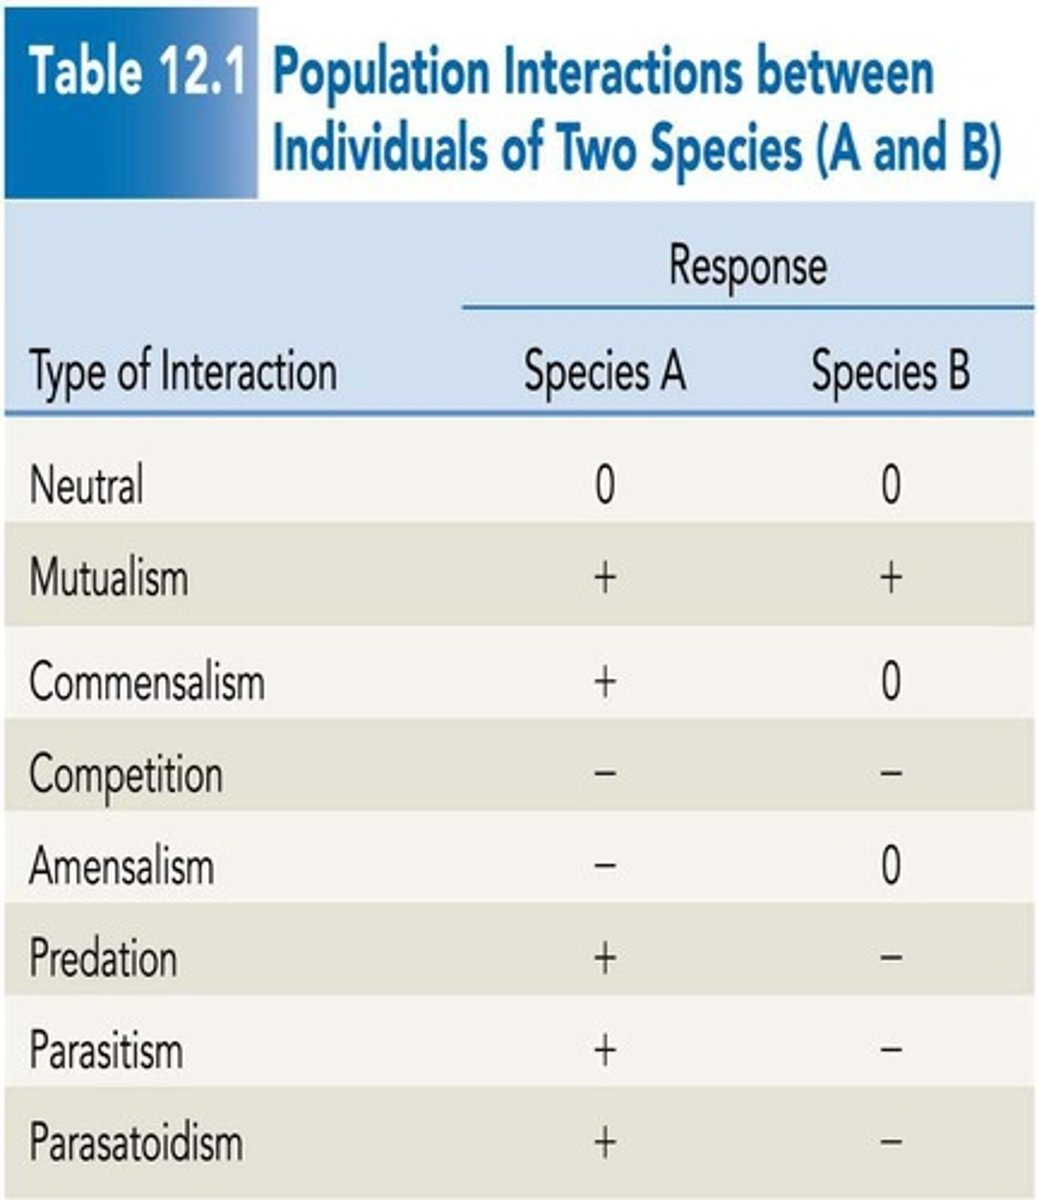
Neutral interaction (0/0)
When neither species affects the other.
Mutualism (+/+)
When both species mutually benefit from the interaction.
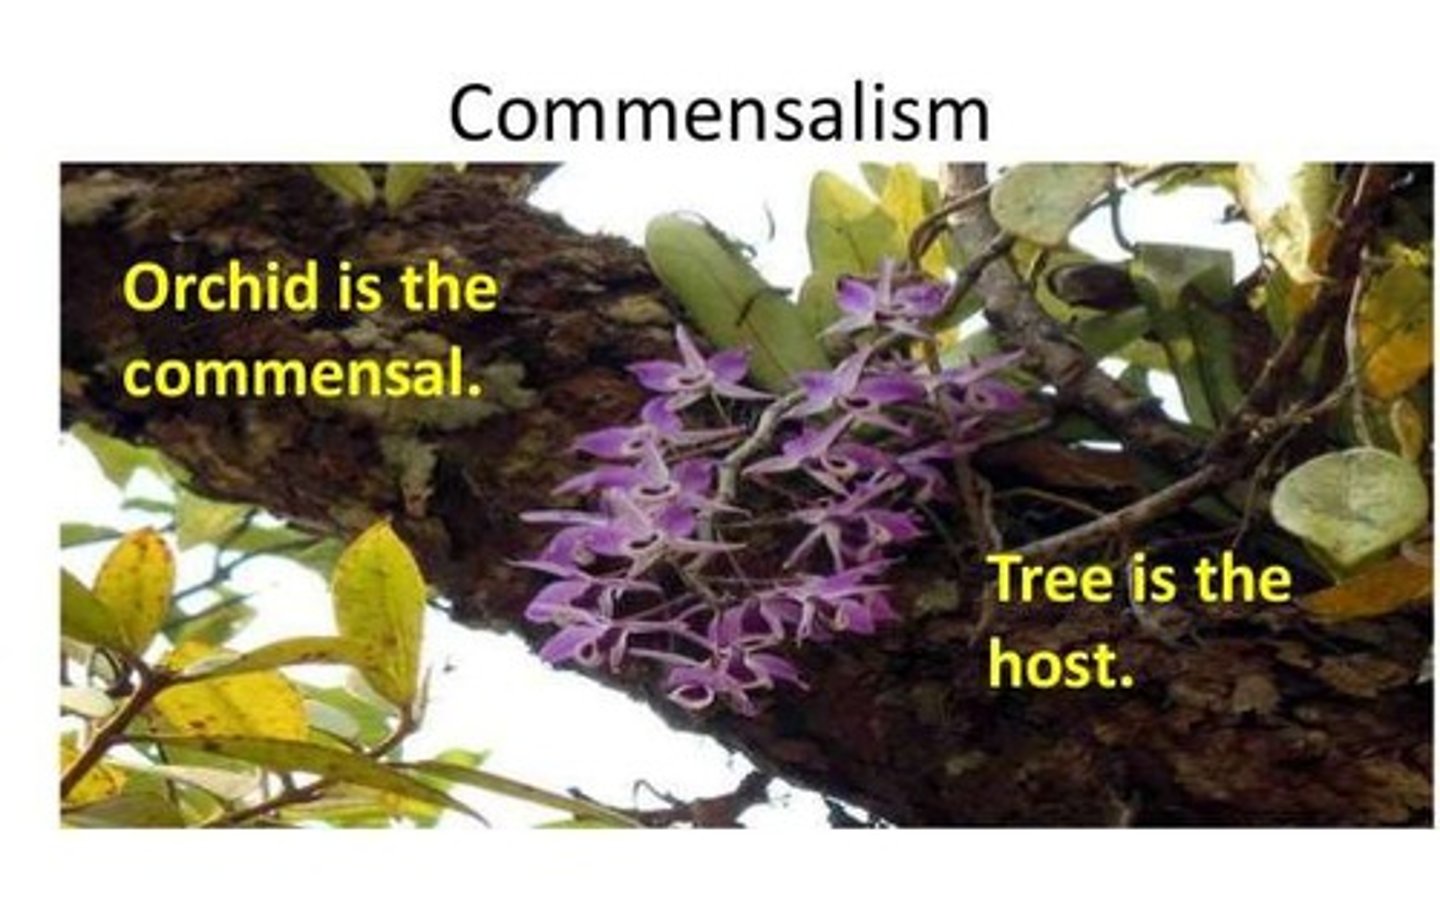
Commensalism (+/0)
When one species benefits and the other is unaffected.
Competition (-/-)
An interaction where both species are harmed due to limited resources.
Amensalism (-/0)
Detrimental to one species while the other is unaffected.
Predation (+/-)
One species feeds on another, killing it.
Parasitism (+/-)
One species feeds on another, reducing its fitness but not killing it.
Parasitoidism (+/-)
An organism that lives on or in a host organism and ultimately kills the host.
Coevolution
Two species undergo reciprocal evolutionary change through natural selection.
Species Richness (S)
The number of species in the community.
Species Evenness (E)
How equally individuals are distributed among the species.
Relative Abundance
The proportion of the abundance of each species relative to the total number of individuals across all species in the community.
pi
Proportion of individuals of species i.
ni
Number of individuals of species i.
N
Total number of individuals of all species.
Shannon-Weiner Index (H')
Quantifies the uncertainty in predicting the species identity of an individual that is taken at random from the dataset.
H'max
Maximum value of H' calculated as ln(S).
Simpson's Index (D)
Probability that two randomly selected individuals from the community will belong to the same species.
D = Σpi
Derived from D = Σni(ni -1)/N(N-1).
Simpson's Reciprocal Index
The reciprocal of Simpson's index, calculated as 1/D.
Evenness (E)
A fraction that can be calculated from an index.
E = index value / max possible index value
Formula for calculating evenness.
ED
(1/D) / S.
EH
H' / ln(S).
Complete Evenness
A value of '1' equals complete evenness.
D = 1
Indicates no diversity.
D approaches 0
Indicates higher diversity.
Values for D
Range between 0 and 1.
Values for H'
Usually range from 1.5 to 3.5.
Community 1
N = 1000, S = 5.
Community 2
N = 1000, S = 20.
Community 3
N = 500, S = 25.
1/D
The reciprocal of Simpson's index.
H'
Shannon-Weiner Index value.
Curve for Equal Abundance
What would the curve for a community look like if each species was equally abundant?
Longer Curve
Indicates greater species richness.
Gradual Slope
Indicates greater species evenness.
Rank Abundance Diagram
Plots rank abundance (x-axis) against corresponding relative abundance (y-axis).
Simpson's reciprocal index
1/D
Evenness (ED)
(1/D)/S
Community 1 Diversity
S = 150, 1/D = 50, ED = 1/3
Community 2 Diversity
S = 100, 1/D = 50, ED = ½
Keystone Species
A species that has a disproportionate impact on the community relative to its abundance.
Impact of Keystone Species Removal
Their removal causes change in the community structure and often a significant loss in diversity.
Trophic level
All organisms at the same number of feeding levels away from the energy source (sun).
Autotrophs
Primary producers that usually derive energy from sunlight.
Heterotrophs
Consumers that derive energy from consuming plant and animal tissues.
Ecological Succession
Change in species composition over time.
Primary Succession
Occurs on previously unoccupied sites by any community.
Secondary Succession
Occurs on previously occupied sites after disturbance.
Example of Primary Succession
Succession after glacial retreat.
Example of Secondary Succession
Succession after clear cut.
Autogenic change
Direct result of the presence and activities of organisms within the community.
changes in an ecosystem driven by the biotic factors within that ecosystem, such as plants, animals, and microorganisms, rather than external, non-living factors
Primary succession is the classic case of autogenic change
Early Successional Species
Shorter lifespans, smaller size, high dispersal ability, high rates of population growth.
Late Successional Species
Longer lifespans, larger size, lower dispersal ability, low rates of population growth.
Species Diversity During Succession
Species diversity changes as the community progresses through different stages of succession.
Trade-off in Growth Rates
High rates of growth under high light vs. slow rates of growth under shade.
Dominant Early Successional Species
Fast growers that are more energy-efficient but cannot survive under canopy.
Shade-tolerant Species
Slow growers that can germinate and grow under the canopy.
Mean Percentage Cover
Measured in a graph showing early, mid, and late succession.
Successional Time
The number of years it takes for succession stages to occur.
Herb Stage
The initial stage of succession characterized by herbaceous plants.
Shrub Stage
The intermediate stage of succession characterized by shrubs.
Tree Stage
The final stage of succession characterized by tree growth.
Biodiversity Index
A measure of biodiversity in an area, such as urban tolerance in L.A.
Presence of Rare Species
Indicator of biodiversity health in a community.
Species Richness
The number of different species represented in a given ecological community.
Colonization
The process by which species establish themselves in a new area, increasing species richness.
Species Replacement
The process over time where existing species are replaced by new species, leading to a decrease in richness.
Mid-Successional Stages
The period during succession when species diversity peaks before early successional species are replaced.
Heterotrophs
Organisms that cannot produce their own food and rely on other sources for nutrition.
Landscape Ecology
The study of the composition, structure, and function of landscapes.
Spatial Heterogeneity
The variation in the composition and structure of a landscape, often referred to as patchiness.
Ecological Disturbance
A normal event that disrupts ecosystem, community, or population structure and changes resource availability.
Human Disturbance
Disturbances caused by human activities, such as fire, clearcuts, and grazing.
Intermediate Disturbance Hypothesis
The theory that species diversity is highest at intermediate levels of disturbance.
Prescribed Fire
A human-induced fire management practice used to maintain healthy ecosystems.
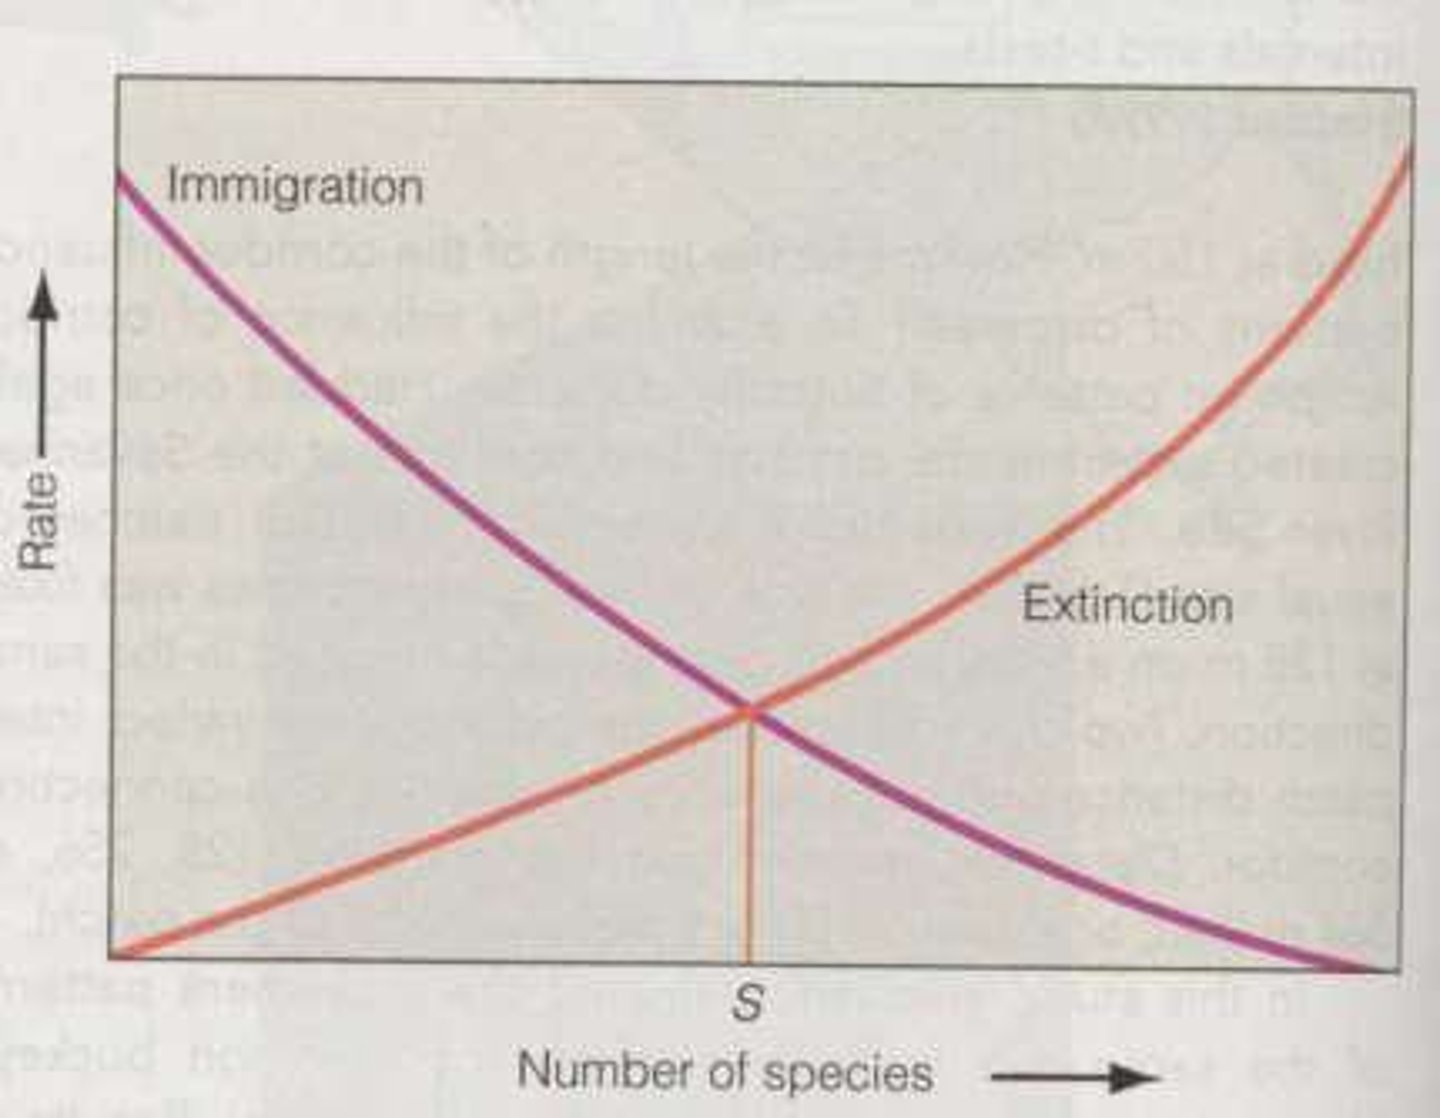
Theory of Island Biogeography
A theory that explains species richness on islands as a balance between immigration and extinction rates.
Equilibrium Species Richness (S)
The number of species where the immigration rate equals the extinction rate.
Immigration Rate
The rate at which new species arrive at an island from the mainland.
Extinction Rate
The rate at which species disappear from an island.
Island Size
A factor that influences extinction rates; larger islands tend to have lower extinction rates.
Habitat Fragmentation
The process by which larger habitats are broken into smaller, isolated patches.
Metapopulation Theory
A theory that describes a group of spatially separated populations of the same species which interact at some level.
Corridors
Landscapes that connect fragmented habitats, facilitating species movement and gene flow.