MACRO TEST 1
1/62
Earn XP
Description and Tags
CH5-8 + 1-4
Name | Mastery | Learn | Test | Matching | Spaced | Call with Kai |
|---|
No analytics yet
Send a link to your students to track their progress
63 Terms
Why is Real GDP considered a better measure than Nominal GDP?
It uses constant prices to value production, meaning it only shows changes in the actual quantity of goods and services produced.
What is the best measure for comparing the material standard of living between countries?
Real GDP per person is the best measure because it accounts for both inflation and population size.
What is Potential GDP?
The level of real production achieved when all inputs like labour and capital are fully employed.
How do increases in "human capital" impact economic growth?
They improve the quality of labour through education and training, thereby increasing the economy's capacity to produce.
How is productivity defined in macroeconomics?
The quantity of real GDP produced per hour of labour.
What defines the "recession" stage of a business cycle?
A recession is defined as two or more successive quarters where real GDP decreases.
What is a recessionary gap?
Occurs when actual real GDP is below potential GDP, signifying that some resources are unemployed.
What is an example of a negative external economic shock?
A pandemic that causes the government to mandate the shutdown of production is an example of a negative external shock.
How is the official unemployment rate calculated?
Dividing the number of unemployed people by the total labour force and multiplying by 100.
What is cyclical unemployment?
It is "unhealthy" unemployment that arises specifically due to fluctuations in the business cycle.
What types of unemployment exist when the economy is at the "natural rate of unemployment"?
The natural rate includes only frictional, structural, and seasonal unemployment, with zero cyclical unemployment.
How does an inflationary gap affect the unemployment rate?
It causes it to fall below the natural rate as inputs work overtime to meet high demand.
Why does the CPI often overstate the true increase in the cost of living?
It fails to account for consumers switching to cheaper substitutes when prices for specific items rise.
What is the Real Interest Rate formula?
Nominal Interest Rate - Inflation Rate.
What is the difference between disinflation and deflation?
Disinflation is a slowing down of the rate at which prices rise, while deflation is a persistent fall in the average price level.
What causes cost-push inflation?
It is caused by supply shocks that increase production costs, leading to higher prices and higher unemployment simultaneously.
What is stagflation?
The "double dose" of bad news where an economy experiences both high inflation and a recession with high unemployment.
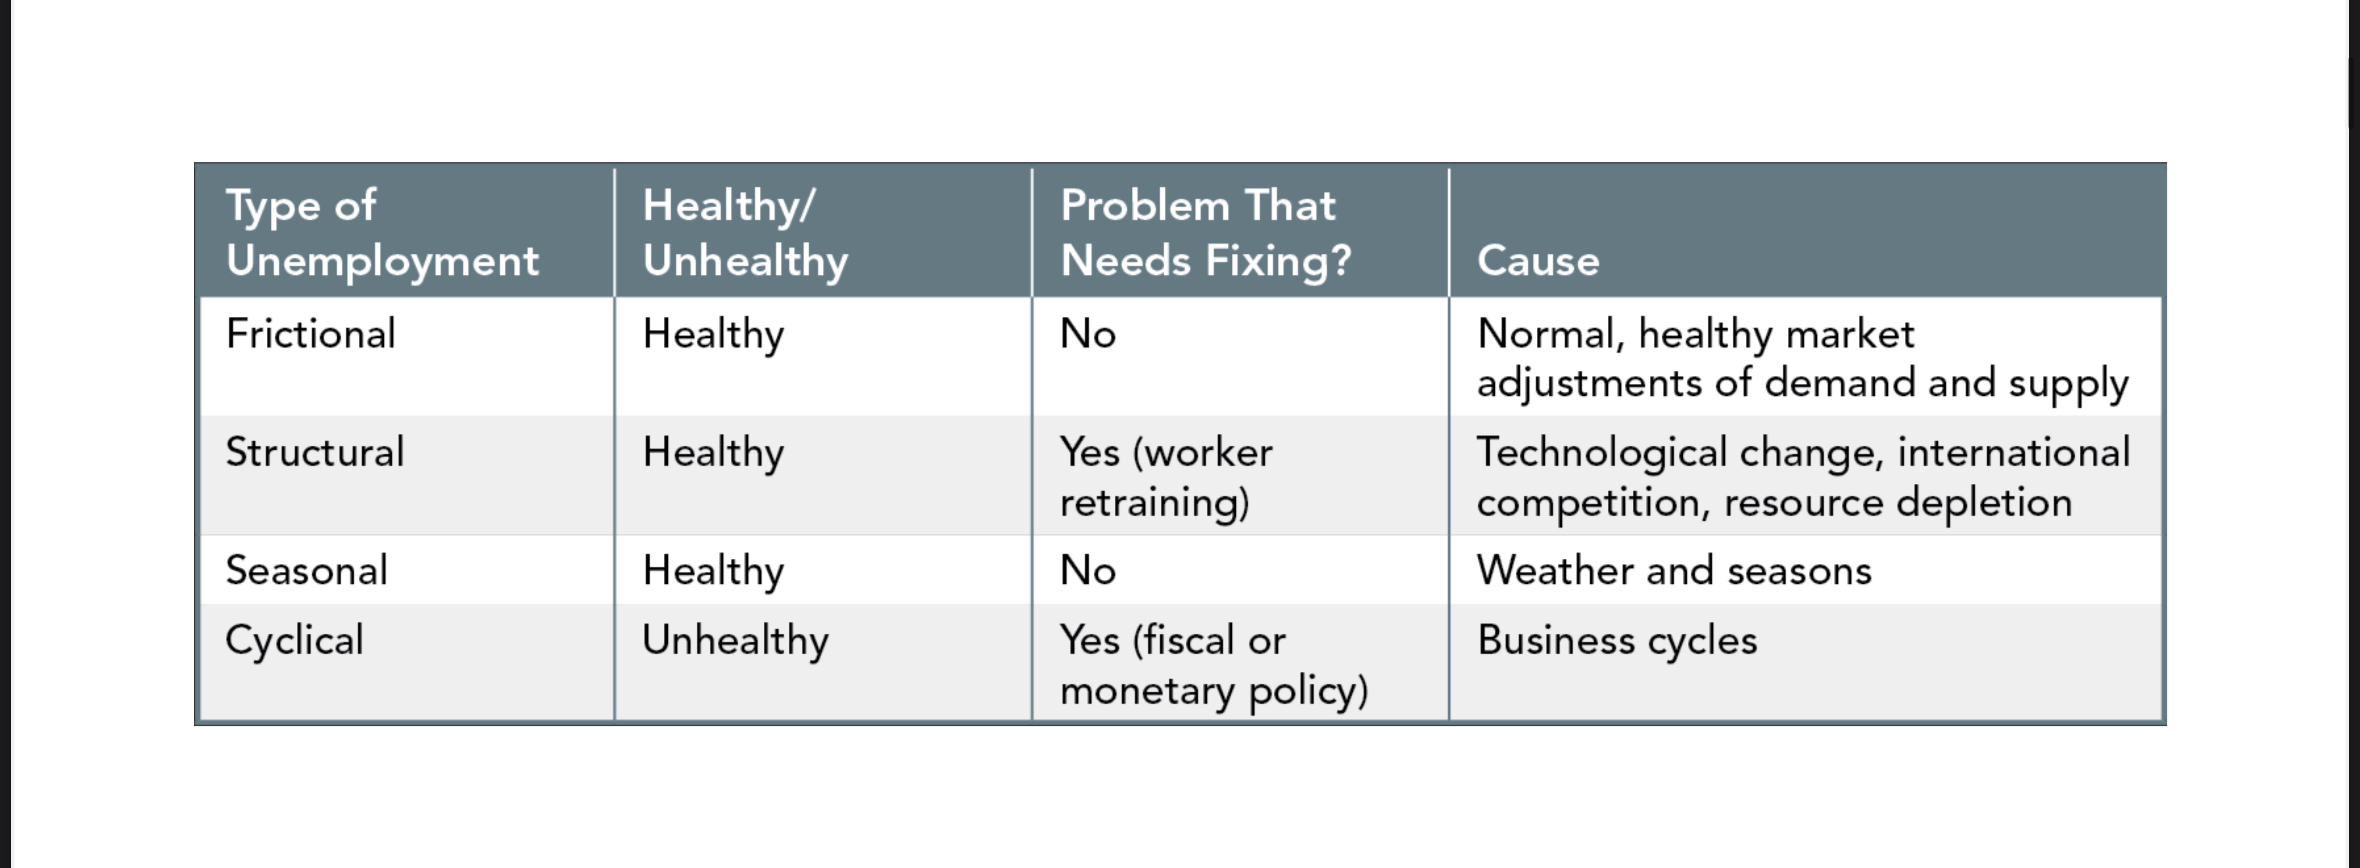
Types of unemployment
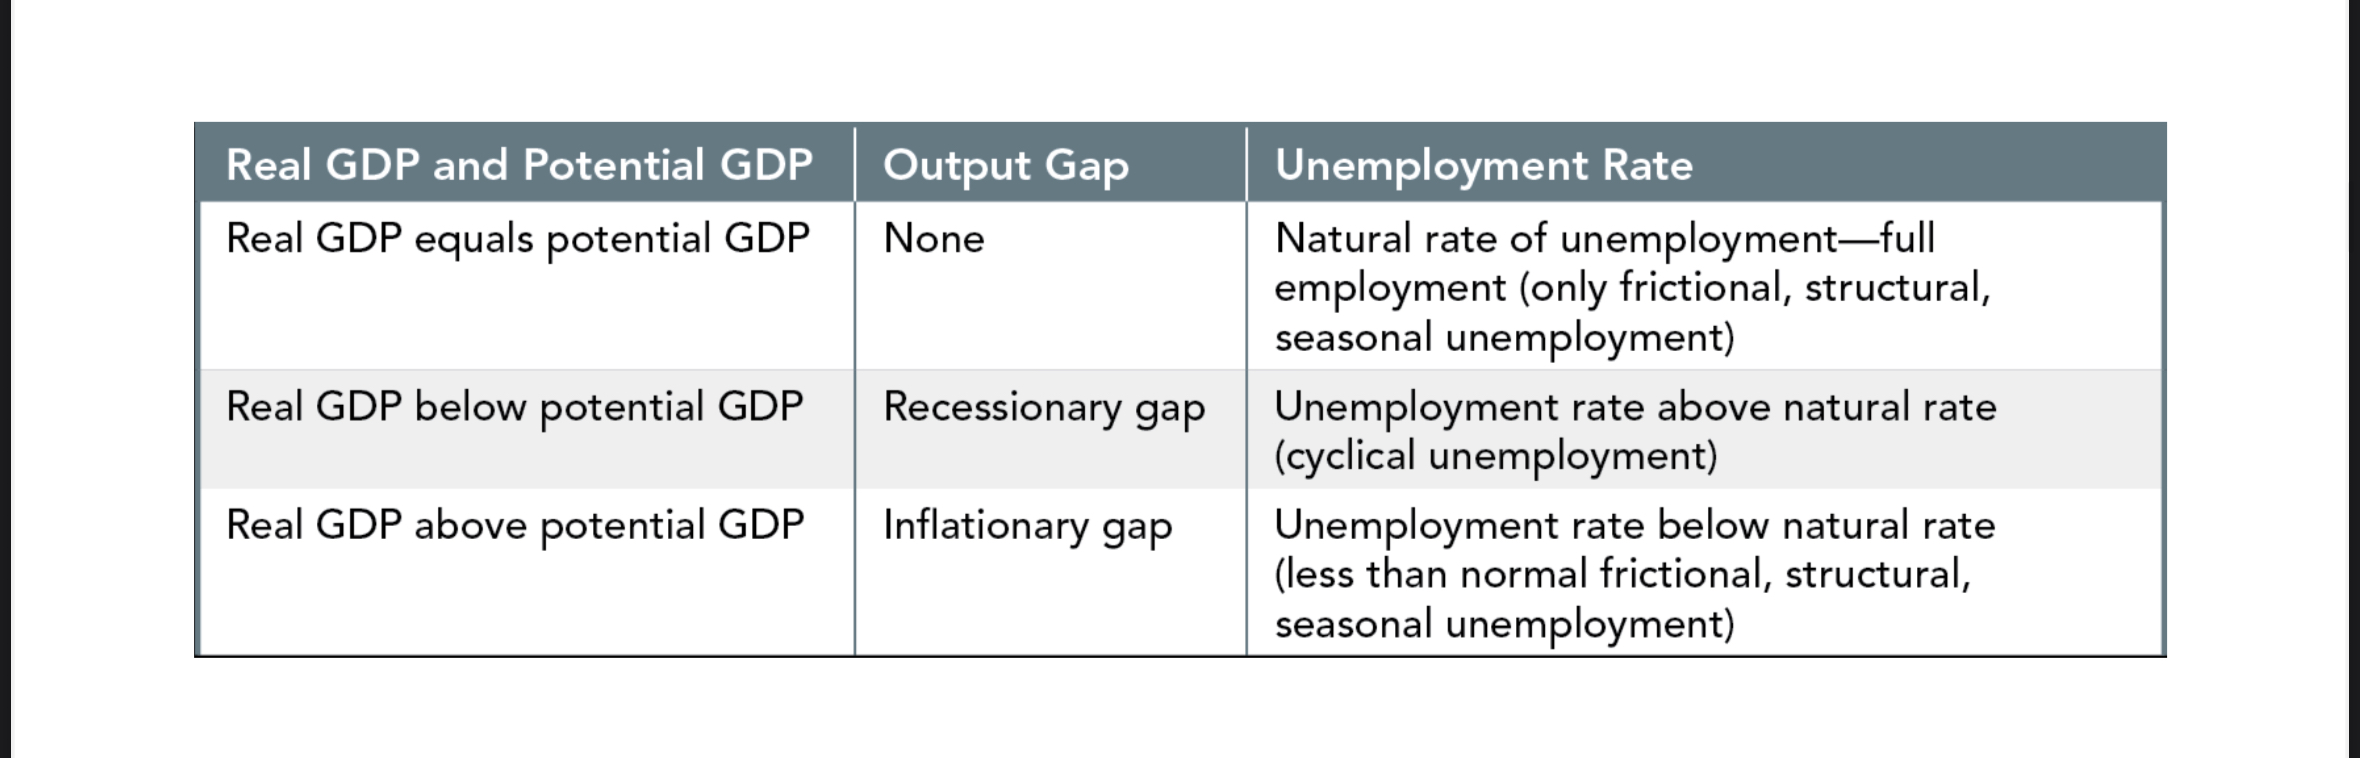
Output gaps and unemployment
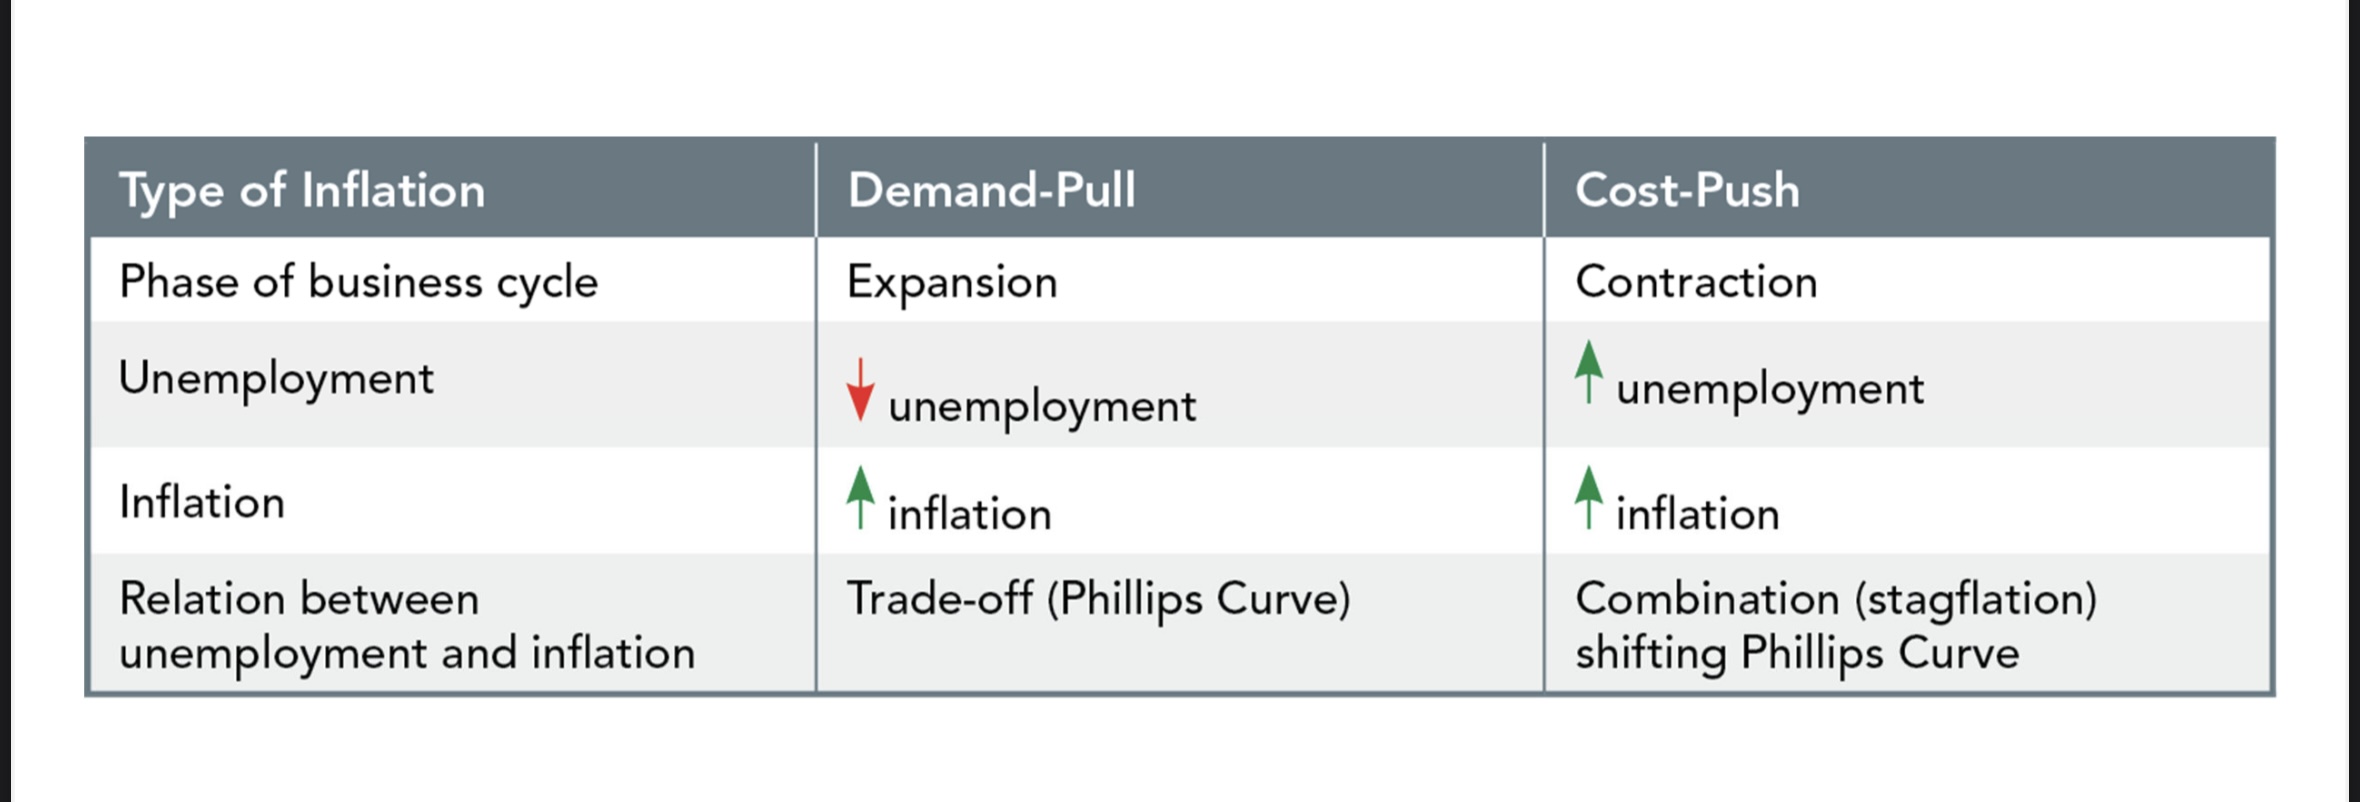
Demand pull vs cost push
What is PPF and what does it illustrate?
Max combos producible with resources.
On curve = efficient; inside = inefficient; outside = impossible.
Shows trade-offs & opportunity cost.
PPF Comparison: Jill can produce 40 loaves of bread OR 20 logs of wood. Marie can produce 20 loaves of bread OR 40 logs of wood. Their PPFs illustrate their differing production capabilities and trade-offs.
What is the circular flow model?
Players: Households, businesses, governments.
Input Markets: Households sell (labour/resources), businesses buy.
Output Markets: Businesses sell goods/services, households buy.
Government sets rules & participates.
Marginal Benefit (MB) vs. Total Benefit(diamond-water paradox)
Marginal Benefit is the additional benefit derived from a choice. MB changes with circumstances.
Total Benefit is the benefit from all units consumed/chosen. Economic decisions are based on MB, not total benefit.
Diamond-Water Paradox: Water has a low marginal benefit because it is abundant, even though its total benefit is essential (high). Diamonds are scarce, so their marginal benefit (and thus willingness to pay) is high.
Marginal cost
The additional opportunity cost of increasing the quantity supplied. MC changes with circumstances. All marginal costs are opportunity costs.
To buy input, businesses must pay the price matching the best OC of the input owner.
Scenario: A bakery owner calculates the MC of baking one extra loaf of bread by summing up the costs of the additional labor, flour, and energy required for that single loaf.
Marginal Opportunity Cost
The complete term for any cost relevant to a smart decision. MOC typically increases as you increase quantity supplied because inputs are generally not equally productive in all activities.
Sunk Costs
Past expenses that cannot be recovered. Sunk costs are not part of opportunity costs.
Thinking Like an Economist (Sunk Cost Rule): You bought a non-refundable concert ticket for £50. When the day comes, you realize you hate the band. The £50 is a sunk cost; it should not influence your decision to go or stay home. You should base your decision only on the additional benefits and costs of attending the concert now.
Demand vs. Quantity Demanded/Reading a Demand Curve
Demand summarizes consumers' entire willingness and ability to pay for a product/service. A change in demand is a shift of the entire curve.
Quantity Demanded (QD) is the amount consumers plan to buy at a specific price. A change in price causes a movement along the curve, changing QD
Reading a Demand Curve: Can be read over-and-down from price to quantity demanded. The curve slopes downward.
Reading a Marginal Benefit (MB) Curve
The demand curve is the inverse of the marginal benefit curve. It reflects the consumer's willingness to pay.
Read up-and-over from quantity to the marginal benefit (the price consumers are willing to pay for that unit).
Supply vs Quantity Supplied/Reading a Supply Curve
Supply summarizes businesses' willingness to produce because the price covers all opportunity costs. A change in supply is a shift of the entire curve.Quantity Supplied (QS) is the amount businesses plan to supply at a specific price. A change in price causes a movement along the curve, changing QS.
Reading a Supply Curve: Can be read over-and-down from price to quantity supplied. The Law of Supply states that if price rises, QS increases (direct relationship); the curve slopes upward.
Reading a Marginal Cost (MC) Curve
The supply curve is the inverse of a marginal cost curve. shows the minimum price businesses will accept that covers all marginal opportunity costs.
Reading a MC Curve: Read up-and-over from quantity supplied to the marginal cost. As quantity increases, MC generally rises.
Normal vs Inferior goods/Compliments vs Substitute
Normal; when income goes up, you buy more; clothing, electronics.
Inferior; when income goes up, you buy less; public transit, cheap food.
Law of demand
Decreases if price of product/service rises
Increases if price of product/service falls
Demand decreases if…
- preference decrease
- price of substitute falls
- price of compliment rises
- if normal good, income decreases
- if inferior good, income increases
- expected future price falls
- number of consumers decrease
Demand increases if…
preferences increase
- price of substitute rises
- price of compliment falls
- if normal good, income increases
- if inferior good, income decreases
- expected future price rise
- number of consumers increase
Law of Supply/Supply vs Quantity Supplied
- decreases if price of product/service falls
- increases if price of product/service rises
Supply; willingness to produce a product/service
Quantity supplied; quantity you actually plan to apply at a given price
Supply decreases if…
- price of related product/service rises
- price of an input rises
- expected future price rises
- number of businesses decreases
- environmental change harms productions
Supply increases if…
- tech improves
- price of a related product/service falls
- price of an input falls
- expected future price falls
- number of businesses increases
- environment changes help production
Market Clearing Price / Equilibrium Price(PEQ)/ The Invisible Hand
The price that equalizes quantity demanded and quantity supplied. It balances the competitive forces so there is no tendency for change. Price signals create incentives
Graphically, PEQ is found at the intersection of the demand (MB) curve and the supply (MC) curve.
Invisible Hand; Price signals in markets create incentives that guide self-interested individuals to make choices.
Demand/Supply changes when ____ changes
Demand
- preferences
- prices of related products
- income
- expected future prices
- number of consumers
Supply
- technology
- prices of related products
- prices of inputs
- expected future prices
- number of businesses
- environment
When changes in both supply and demand occur…
Increase in both; EQ quantity increases, EQ price is ambiguous
Decrease in both; EQ quantity decreases, EQ price is ambiguous
Decrease Supply/Increase Demand; EQ price increases, EQ quantity is ambiguous
Decrease Demand/Increase Supply; EQ price decreases, EQ quantity is ambiguous
- you can only predict change in either the equilibrium price or equilibrium quantity
- you need exact numbers/magnitude to predict the ambiguous outcome
The Macroeconomist's Mantra
This is the core logic used to isolate variables in measurement.
Real GDP holds PRICES constant (using base-year prices) to isolate and measure changes in quantities produced.
Consumer Price Index (CPI) holds QUANTITIES constant (using a fixed shopping basket) to isolate and measure changes in prices.
Value Added Calculation
The value of a business's output minus the value of intermediate products and services bought from other businesses.
Example: If a business sells output for $2,000 and bought $500 in materials, the value added is $1,500. Wages and profits are NOT subtracted; they are the components of value added paid out as income.
Quantity Theory of Money (Assumptions)
To explain the link between money supply and inflation (M V = P Q), this theory assumes that the velocity of money (V) is fixed and real output (Q) is fixed at potential GDP.
Under these assumptions, any increase in the quantity of money (M) leads to an equal percentage increase in average prices (P).
Structural Unemployment
This is a healthy type of unemployment caused by technological change or international competition that makes a worker's skills obsolete. There is a mismatch between existing skills and those required for new jobs.
Example: Digital dictation making shorthand obsolete. While healthy for growth, it needs fixing through worker retraining.
Cyclical Unemployment
The only type of unemployment considered "unhealthy" and a problem requiring policy intervention.
Caused by business cycle fluctuations, specifically contractions or recessions.
Occurs when Real GDP is below Potential GDP (a recessionary gap).
Output Gaps (Positive vs. Negative)
The difference between actual Real GDP and Potential GDP.
A Positive Gap (Inflationary Gap) occurs when Real GDP is above potential, putting upward pressure on prices.
A Negative Gap (Recessionary Gap) occurs when Real GDP is below potential, resulting in unemployed workers and idle factories.
The Original Phillips Curve Trade-off
This graph shows an inverse relationship where lower unemployment is associated with higher inflation.
This trade-off is consistent with demand-pull inflation, where high spending "pulls" the economy toward expansion, creating jobs but driving up prices. Economists believed this was stable until the 1970s.
Cost-Push Inflation
This is caused by negative supply shocks (like rising oil prices) that "push" up business costs.
This causes prices to rise even as the economy enters a contraction (falling Real GDP).
The result is stagflation—the simultaneous occurrence of high inflation and high unemployment.
Macro Production Possibilities Frontier (PPF) Shifts
Represents the economy's potential GDP. A movement from inside to a point represents a reduction in unemployment.
It shifts outward (economic growth) only when there is an increase in the quantity or quality of inputs (labour, capital, resources, or technology), not changes in output prices.
Nominal vs. Real GDP Performance
Measured at current prices,
vs
Measured at constant prices.
A rise in nominal GDP does not guarantee economic growth; it can increase purely due to inflation while physical production falls. Real GDP must increase to confirm a physical growth in "stuff".
Discouraged Workers
They want a job but has given up actively searching. Because they are no longer actively seeking work, they are removed from the labour force.
This causes the official unemployment rate to fall, which can make the economy look stronger even if no new jobs were created.
Internal vs. External Shocks
Originate from within, such as disruptions in financial markets or changing expectations.
Vs
Come from outside the market economy, such as natural disasters or changes in government policy.
Hands-On economists emphasize internal shocks, while Hands-Off economists emphasize external ones.
Core Inflation
This is the inflation rate calculated by excluding volatile categories like fresh food and energy.
Removing these temporary price spikes/drops allows the Bank of Canada to better identify the underlying long-term trend in the cost of living.
Real Interest Rate Formula
The nominal rate adjusted for inflation. Formula: $Real Interest Rate = Nominal Interest Rate - Inflation Rate$.
Example: If you earn 5% interest on savings but inflation is 3%, your real purchasing power has only increased by 2%.
The Rule of 70
A shortcut to determine how many years it takes for a variable to double.
Formula: $70 /Annual Percentage Growth Rate.
Example: At a 7% growth rate, real GDP per person will double in 10 years (70 / 7 = 10).
Intermediate Products
An input bought from one business to be used in the production of another good (e.g., steel for a car).
GDP only counts the value of final products sold to users to avoid double counting, as the intermediate value is already "captured" in the final price.
Injections vs. Leakages
Spending added to the flow from sources other than households: Investment (I), Government Spending (G), and Exports (X).
VS
Spending that leaves the flow before reaching output markets: Saving (S), Net Taxes (T), and Imports (IM).
Net Taxes
The total taxes paid by households to the government minus transfer payments (like Employment Insurance) received from the government.
It represents the actual "drain" on household income by the government sector.
Consumer Price Index (CPI)
Measures the cost of a fixed shopping basket relative to a base year (where CPI = 100).
Formula: (Cost of Basket Current Year/ Cost of Basket Base Year) * 100.
Example: If a basket costs $1,050 now and $700 in the base year, the CPI is 150.
Demand-Pull Inflation
Rising average prices caused by increases in demand. This typically occurs during the expansion phase of a business cycle, where high spending creates shortages, "pulling" up prices and decreasing unemployment.
Labor Force Participation Rate
This measures the percentage of the working-age population (15+) that is either employed or unemployed.
Formula: (Labour Force /Working-Age Population) *100.
Example: If the labor force is 20 million and the working-age population is 30 million, the rate is 66.7%.
Long Division for Macro Measures
Example: Real GDP of $2,000 / Population of 8 = 250$.
Steps: 8 into 20 goes twice, remainder 4; 8 into 40 goes 5 times; 8 into 0 goes zero times.
Inflation calculation using cpi
Difference/base value = rate