Unit 6: Inference for Categorical Data: Proportions
1/60
Name | Mastery | Learn | Test | Matching | Spaced | Call with Kai | Chat |
|---|
No analytics yet
Send a link to your students to track their progress
61 Terms
What is a point estimator?
a statistic that provides an estimate of a population parameter
What is a point estimate?
the value of a statistic from a sample
What is a confidence interval?
the estimate of a parameter given as an interval of values
What does confidence level C give?
the overall success rate of the method used to calculate the confidence interval; in C% of all possible samples, the interval computed from the sample data will capture the true parameter value
How do you interpret a C% confidence interval for an unknown parameter?
“We are C% confidence that the interval from ____ to ____ captures the [parameter in context]”
What does margin of error describe?
how far, at most, we expect the estimate to vary from the true population
What is the distance between the point estimate and true parameter value in a C% confidence interval in relation to the margin of error?
it will be less than the margin of error in C% of all samples
How do you interpret a confidence level?
“If we were to select many random samples of the same size from a population and construct a C% confidence interval using each sample, about C% of the intervals would capture the [parameter in context]”
What are the 2 ways to reduce the margin of error of a confidence interval?
decrease the confidence level and increasing sample size n
What must you be willing to accept if you obtain a smaller margin of error from data?
less confidence
What is the general formula for a confidence interval?
statistic ± (critical value) x (standard deviation of statistic)
What is a critical value?
a multiplier that makes the interval wide enough to have the stated captures rate
What is the formula for a C% confidence interval if the three conditions are met?
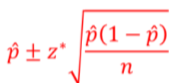
What are the three conditions for constructing a confidence interval for a proportion?
Random
Large Counts
10%
What is the standard error of the statistic?
the result when the standard deviation of a statistic is estimated from data
How do you interpret the standard error of a sample proportion?
“In repeated SRSs of size [n], the sample proportion of […..] typically varies from the population proportion by about [SE]”
What does standard error describe?
how close the sample proportion (p-hat) will typically be from the true population proportion p in repeated samples of the same size
What does critical value z* measure?
how many standard errors we need to extend above/below to reach out desired confidence level
What are the four steps of constructing confidence intervals?
State
Plan
Do
Conclude
What is the State step of constructing confidence intervals?
state the parameter you want to estimate and the confidence level
“C% confidence for p = the true proportion of […]”
What is the Plan step of constructing confidence intervals?
identify the appropriate inference method and check conditions
“One-sample z interval for p
Random: […]
10%: […]
Large Counts: […]”
What is the Do step of constructing confidence intervals?
if the conditions are met, perform calculations
(use confidence interval formula)
What is the Conclude step of constructing confidence intervals?
interpret your interval in the context of the problem
“We are C% confident that the interval from ____ to ____ captures p = the true proportion of […]”
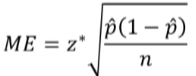
What is the formula for margin of error?
How do you choose a value for p̂ when solving for the sample size?
use a guess for p̂ based on a pilot study, or use p̂ = 0.5
What is the Random condition for constructing a confidence interval about a difference in proportions?
the data come from two independent random samples or from two groups in a randomized experiment
What is the 10% condition for constructing a confidence interval about a difference in proportions?
when sampling without replacement, n1 < 0.10N1 and n₂ < 0.10N₂
What is the Large Counts condition for constructing a confidence interval about a difference in proportions?
the counts of “successes” and “failures” in each group are all at least 10
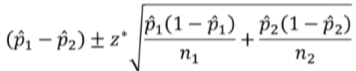
What is the formula for a C% confidence interval for p1-p2?
What is a significance test?
a formal procedure for using observed data to decide between two competing claims (hypotheses)
What is the null hypothesis (H0)?
the claim that we weigh evidence against in a significance test; usually a statement of “no difference”
What is the alternative hypothesis (Ha)?
the claim that we are trying to find evidence for
When is the alternative hypothesis one-sided?
if it states that a parameter is greater or less than the null value
When is the alternative hypothesis two-sided?
if it states that the parameter is different from the null value
What is the p-value of a test?
the probability of getting evidence for the alternative hypothesis Ha as strong or stronger than the observed evidence when the null hypothesis (H0)
True or false: hypotheses always refer to a population, not a sample
true
What conclusion do you make if the p-value is large?
“Because [p-value] > α, we fail to reject H0. We do not have convincing evidence for [Ha in context]”
What conclusion do you make if the p-value is small?
“Because [p-value] < α, we reject H0. We do not have convincing evidence for [Ha in context]
What is significance level α?
the value that we use as a boundary for deciding whether an observed result is unlikely to happen by chance alone when the null hypothesis is true
When does a Type I error occur?
if we reject H0 when Ha is true; the data give convincing evidence that Ha is true when it really isn’t
When does a Type II error occur?
if we fail to reject H0 when Ha is true; the data do not give convincing evidence that Ha is true when it really is
What are the most common significance level α?
0.05, 0.01, and 0.10
What is the probability of a Type I error?
significance level α
How can you reduce the probability of a Type I error?
by using a smaller significance level
What is the drawback of using a smaller significance level?
Type II error increases
What does a standardized test statistic measure?
how far a sample statistic is from what we would expect if the null hypothesis H0 were true, in standard deviation units
What is the formula for a standardized test statistic?

What is the State step of a significance test?
state the hypotheses you want to test and the significance level, and define any parameters you use
What is the Plan step of a significance test?
identify the appropriate inference method and check conditions
What is the Do step of a significance test?
if the conditions are met,
perform calculations
give the sample statistic(s)
calculate the standardized test statistic
find the p-value
What is the Conclude step of a significance test?
make a conclusion about the hypotheses in the context of the problem
What is the power of a test?
the probability that the test will find convincing evidence for Ha when a specific alternative value of the parameter is true
What is the interpretation for p-value?
“Assuming H0 is true (p = ___ ), there is a [p-value] probability of getting a p̂ of ___ or [greater/less
What is the interpretation for power of a test?
“If the true [parameter in context] is […], there is a [power of the test value] probability that [individual/organization] will find convincing evidence for Ha”
What is the power of the test in relation to the probability of Type II error?
power = 1 – P(Type II error)
What is the probability of Type II error in relation to the power of the test?
P(Type II error) = 1 – Power
When will the power of the test be larger?
when:
sample size n is larger
the significance level α is larger
the null and alternative parameter values are further apart
What is the general form of the null hypothesis in a test for comparing two proportions?
H0: p1 – p2 = hypothesized value
What is the formula for p̂C for a test for comparing two proportions?

What is the formula for a standardized test statistic in a test for comparing two proportions?
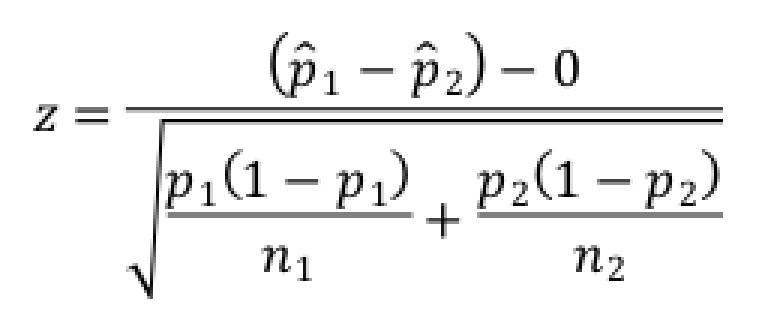
How do you test the hypothesis H0: p1 – p2 = 0?
first find the pooled proportion p̂C of success in both samples combined, then compute the standardized test statistic