Chapter 1 - Basic Economic Concepts
1/73
Earn XP
Description and Tags
Name | Mastery | Learn | Test | Matching | Spaced | Call with Kai |
|---|
No analytics yet
Send a link to your students to track their progress
74 Terms
Economics
The study of choice and scarcity.
Individual Choice
Decisions by individuals about what to do and what not to do.
Economy
A system that coordinates choices about production with choices about consumption, and distributes goods and services to the people who want them.
Market Economy
An economy in which production and consumption are the results of decentralized decisions by many firms and individuals. There is no central authority telling people what to do or where to ship it.
Command Economy
An economy in which industry is publicly owned, and there is a central authority, making production and consumption decisions.
Incentives
Rewards or punishments that motivate particular choices. A problem with command economies is that they have a lack of incentives.
Property Rights
Established ownership and grant individuals to write to trade goods and services with each other, they create many of the incentives in market economies.
Marginal Analysis
In any economy, the decisions of what to do with the next ton of pollution, the next hour of free time, and the next dollar of spending money are marginal decisions. They involve trade-offs at the margin: comparing the costs and benefits of doing a little bit more of an activity versus a little bit less. The gain from doing something one more time is called the marginal benefit. The cost of doing something one more time is the marginal cost. If the marginal benefit of making another car, reading another page, or buying another latte exceeds the marginal cost, the activity should continue. Otherwise, it should not. The study of such decisions is known as marginal analysis, plays a central role in economics because the formula of doing things until the marginal benefit no longer exceeds the marginal cost is the key to deciding "how much" to do of any activity.
Resource
Anything that can be used to produce something else.
What are the four factors of production?
Land, labor, capital, and entrepreneurship.
Land
All resources that come from nature, such as minerals, timber and petroleum.
Labor
The effort of workers.
Capital
Refers to manufactured goods used to make other goods and services.
Human Capital
The skills, knowledge, and experience possessed by an individual, viewed in terms of their value to an organization or economy.
Financial Capital
Money
Entrepreneurship
Describes the efforts of entrepreneurs in organizing resources for production, taking risks to create new Enterprises, and innovating to develop new products and production processes.
Scarcity
The idea that a resource is not sufficient to satisfy all the various ways society wants to use it. You have unlimited wants and needs, but not unlimited resources.
Opportunity Cost
The value of what you must give up when you make a particular choice. For example, by choosing to go to your local college, you forgo the opportunity to attend the large state university, your next best alternative.
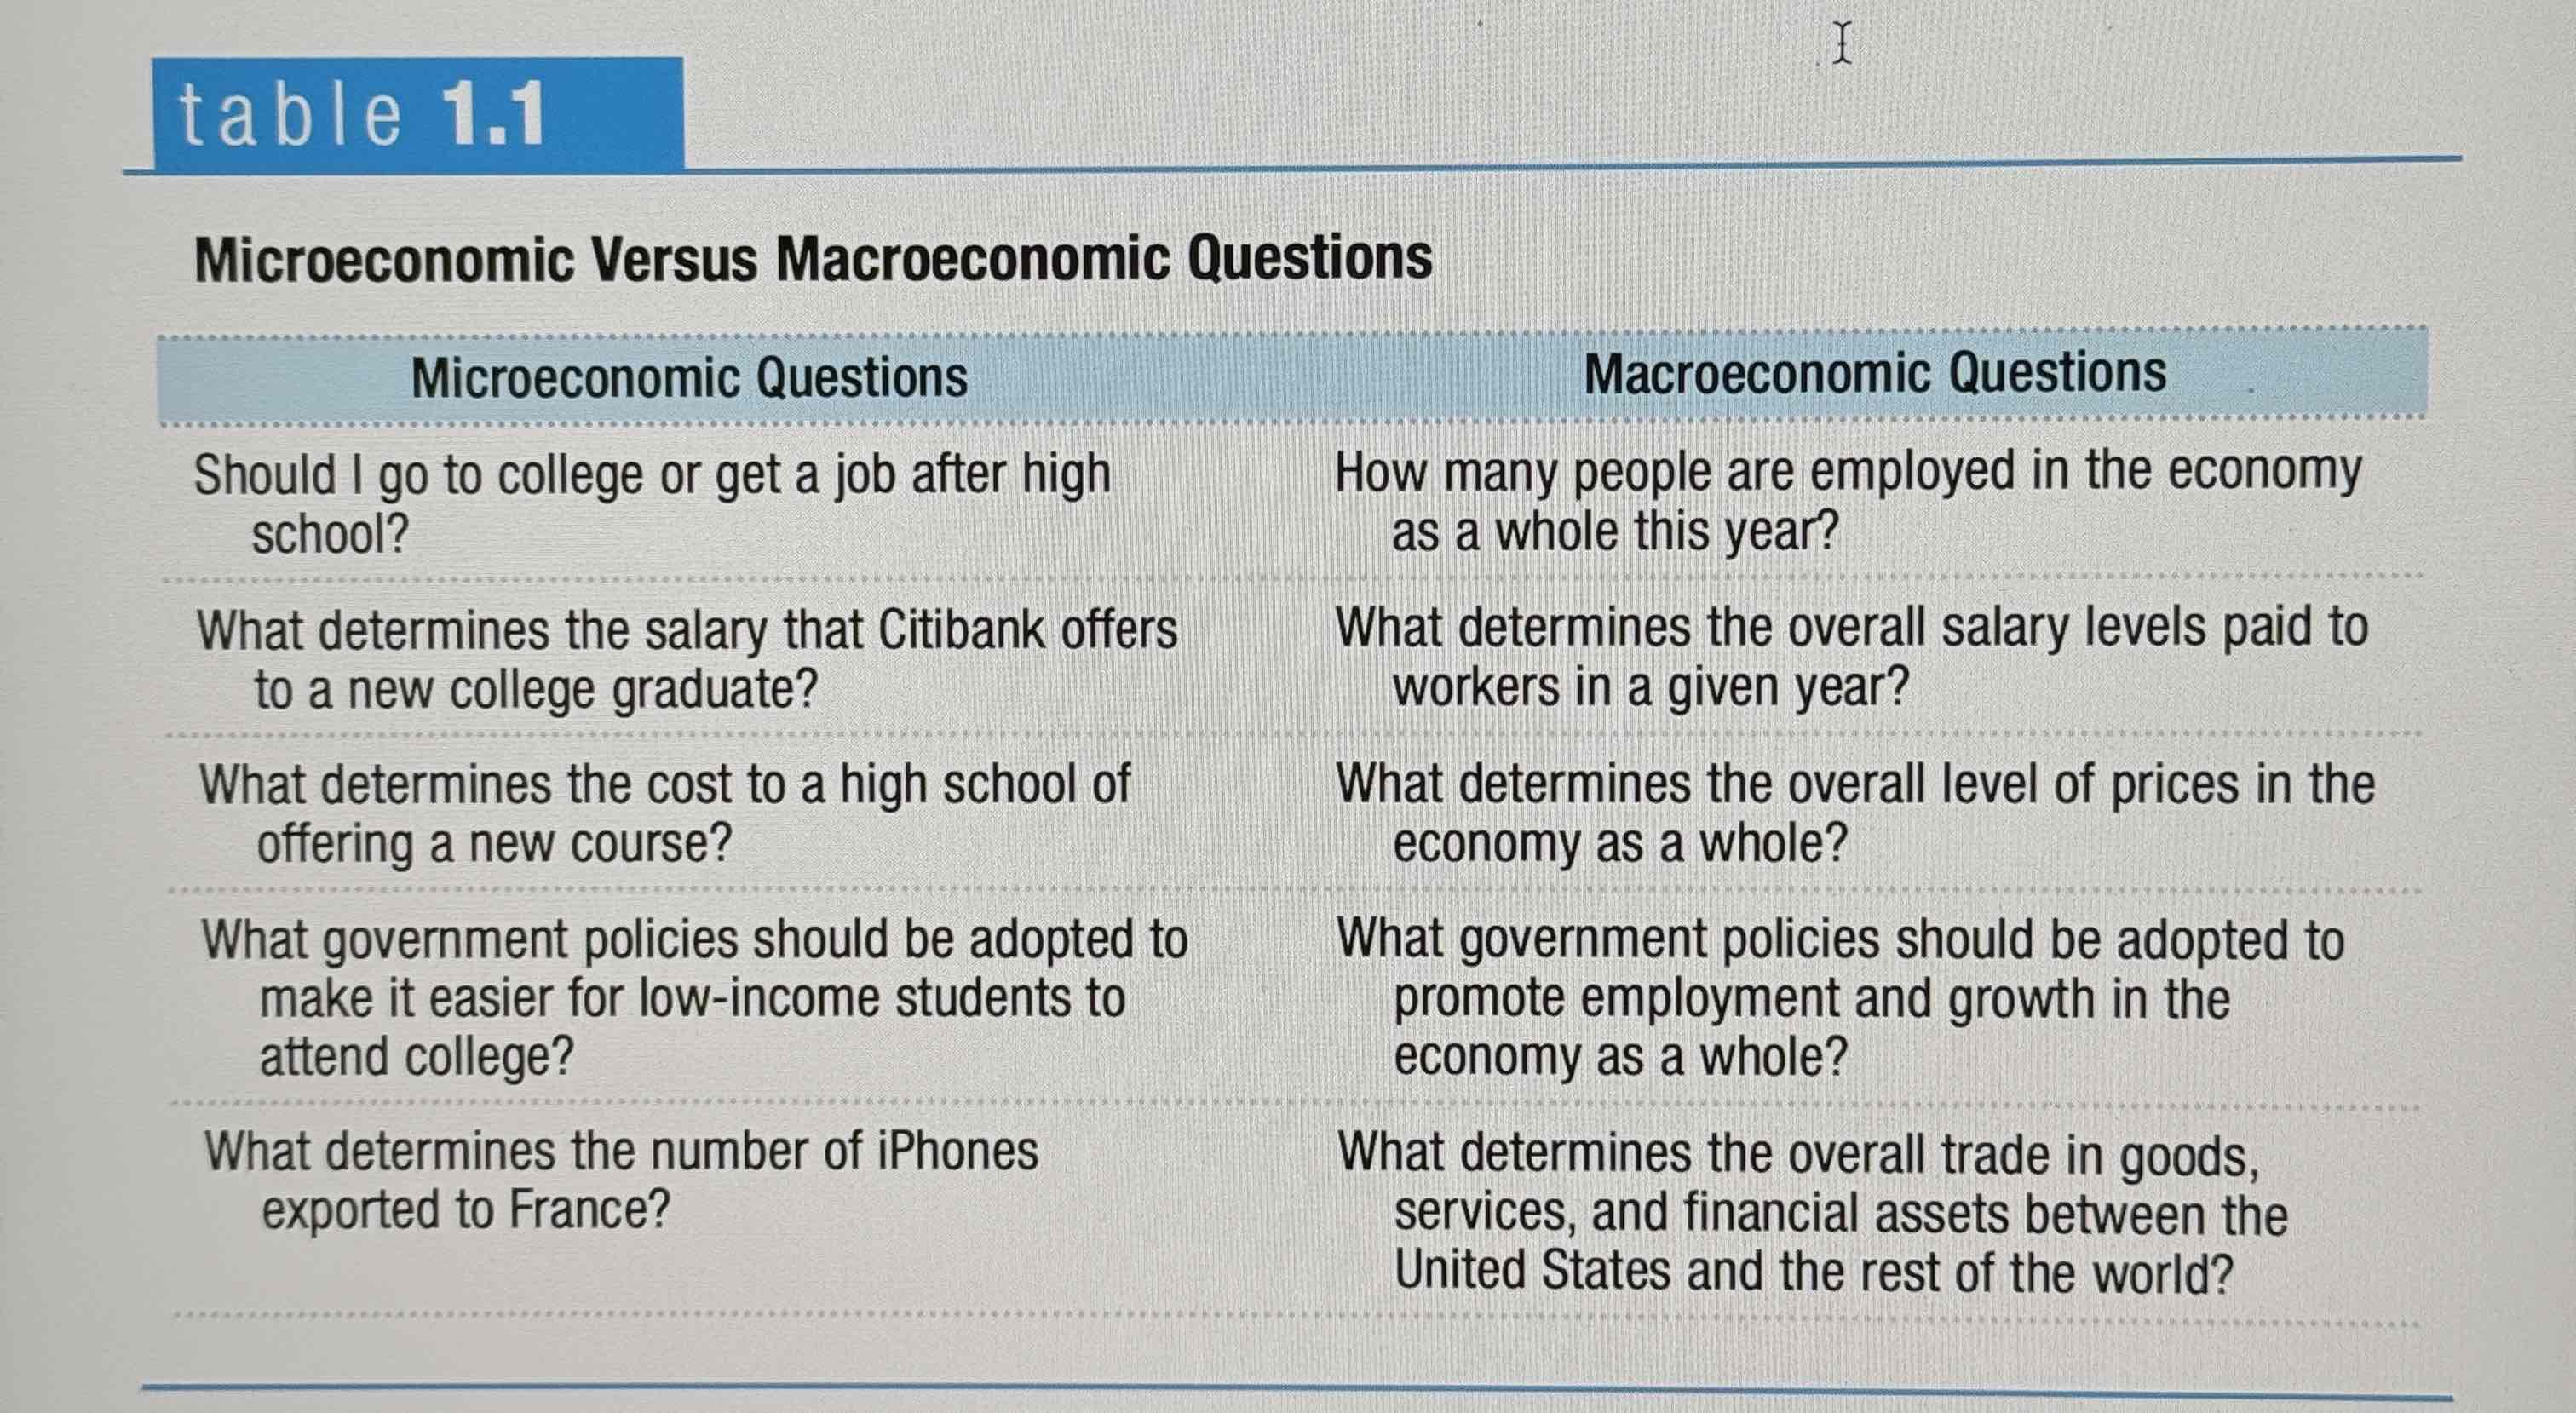
Microeconomics
The study of how people make decisions and how those decisions interact.
Macroeconomics
Concerned with the overall ups and downs in the economy as a whole.
Economic Aggregates
Economic measures that summarize data across many different markets. These include unemployment rate, the inflation rate, and gross domestic products. These are all part of macroeconomics.
Micro vs Macro questions
Ex.
Positive Economics
The branch of economic analysis that describes the way the economy actually works.
Normative Economics
The branch of economic analysis that describes the way the economy should work.
Economic Models
Provide simplified representations of reality, such as graphs or equations. They are especially useful for answering “What If” questions.
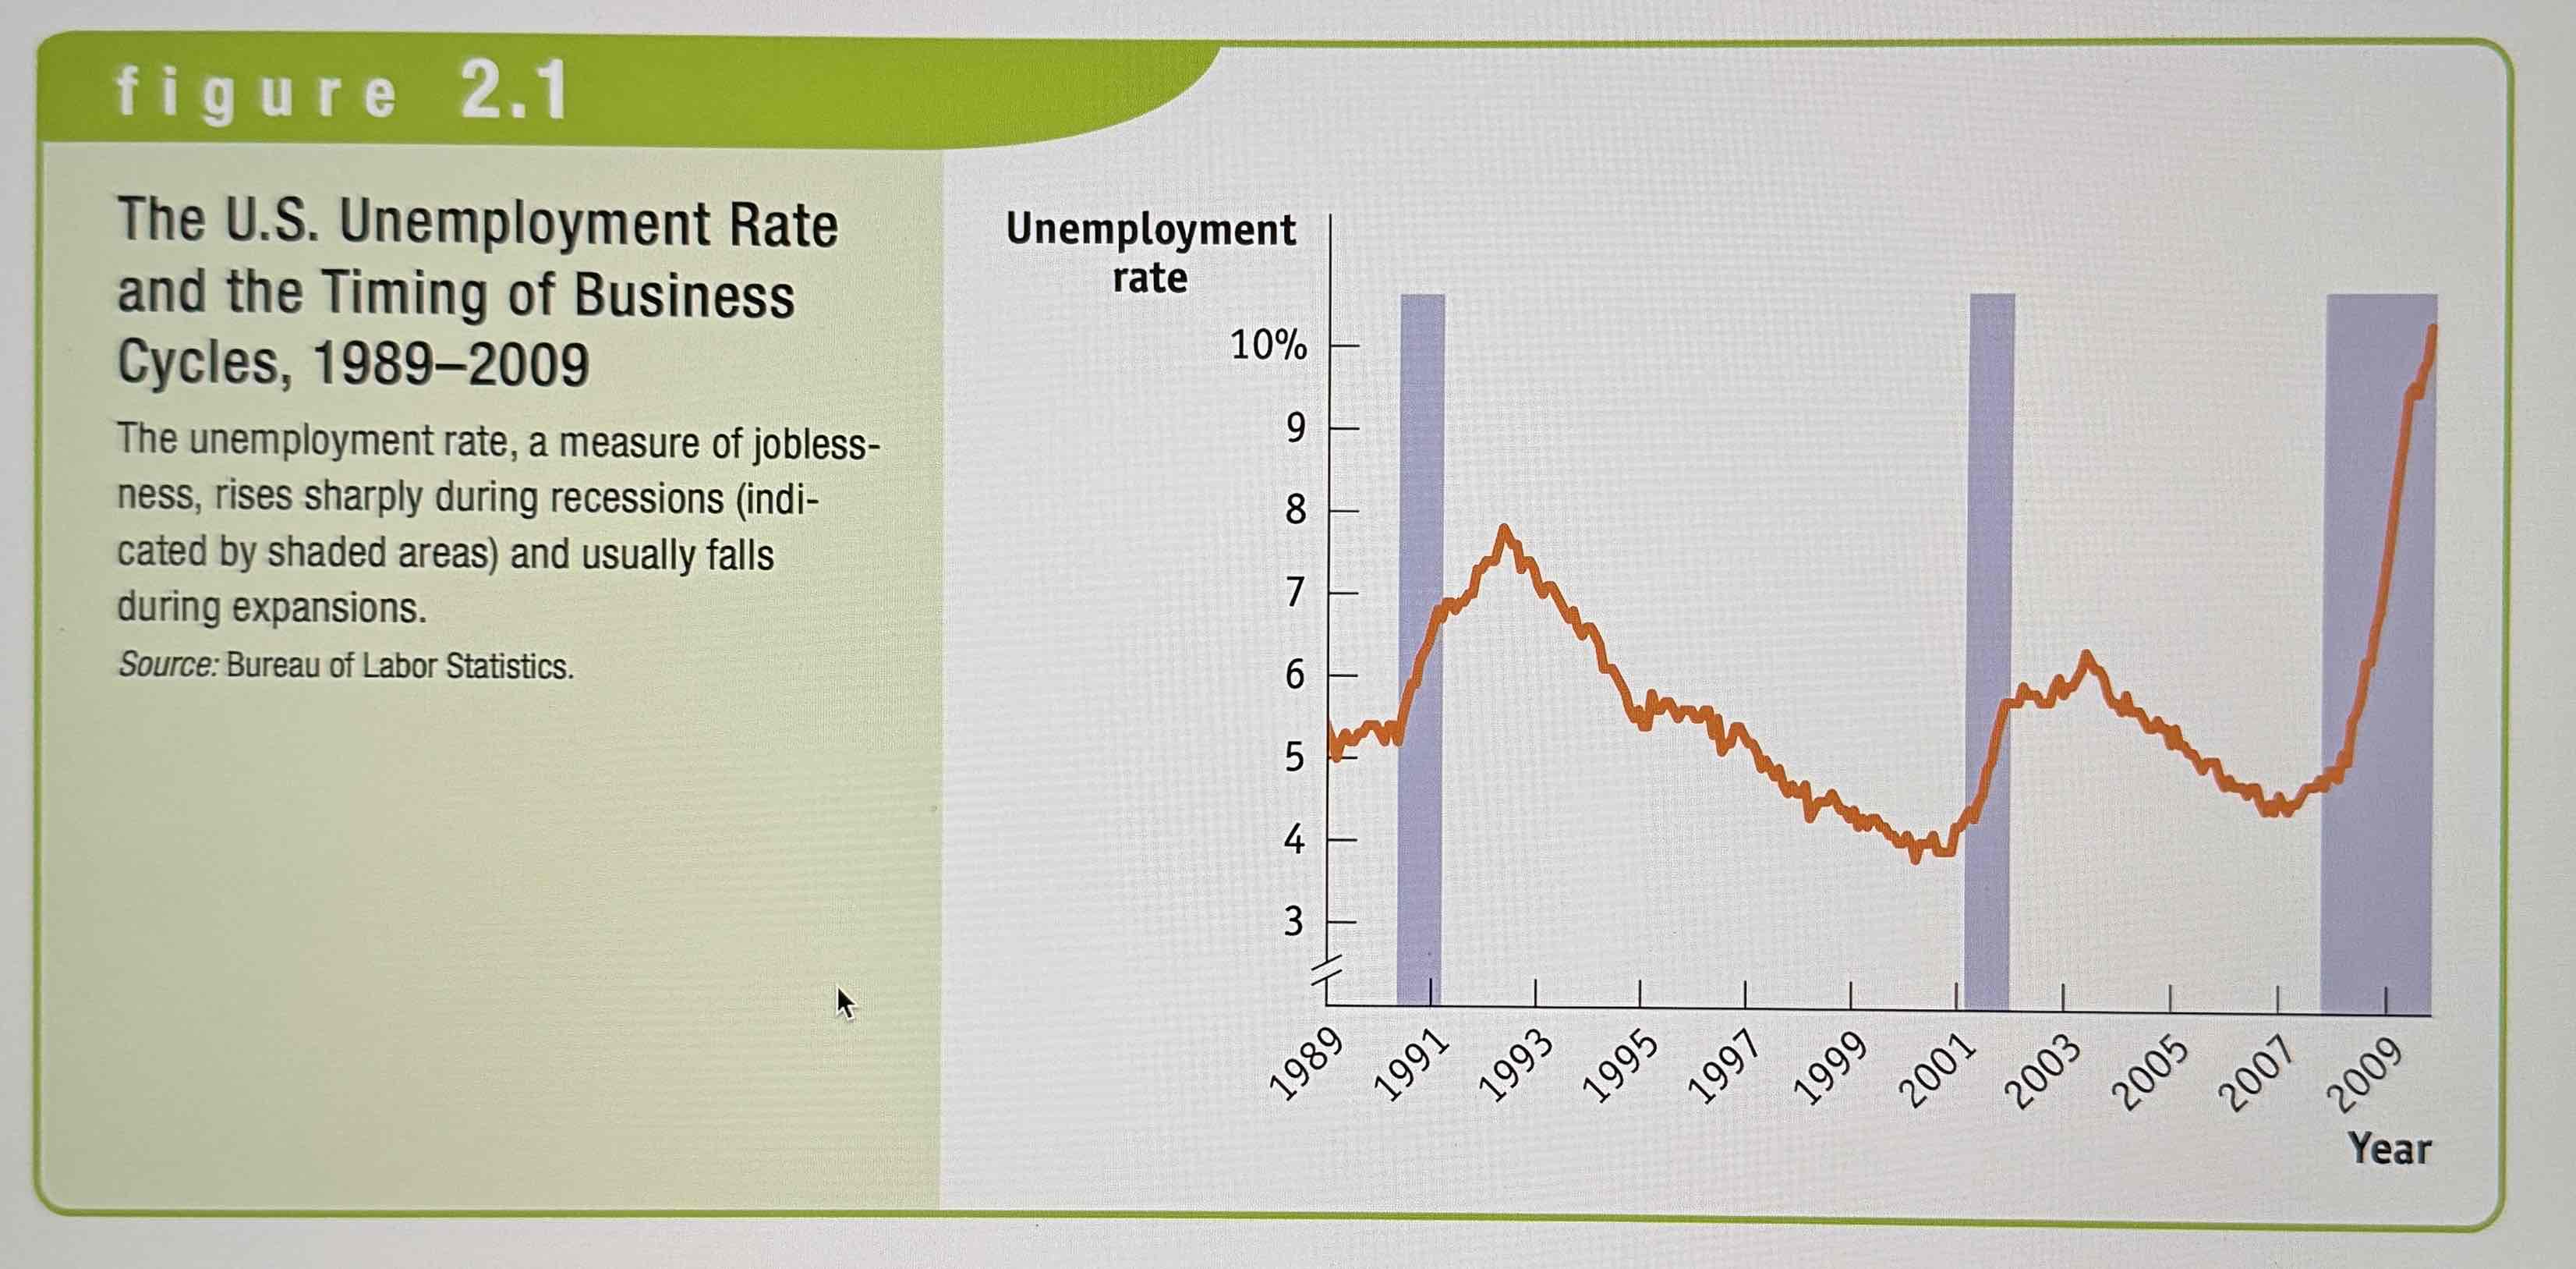
The business cycle
The short run alternation between economic downturns, known as recessions, and economic upturns, known as expansions.
Depression
A very deep and prolonged downturn.
Recession
Periods of economic downturns when output and employment are falling.
Expansion
A.k.a. recoveries, these are periods of economic upturn's when output and employment are rising.
Example of the Business cycle.
Ex.
Employment
The number of people currently employed in the economy.
Unemployment
The number of people who are actively looking for work, but aren't currently employed.
Labor Force
Equal to the sum of employment and unemployment. Everyone who can work.
Unemployment Rate
The percentage of the labor force that is unemployed.
Output
The quantity of goods and services produced.
Aggregate Output
The economies total production of goods and services for a given time.
Inflation
A rising overall price level
Deflation
A falling overall price level
Price Stability
When the aggregate price level is changing only slowly or not at all.
A level economists consider stable.
Economic Growth
An increase in the maximum amount of goods and services an economy can produce.
Model in Economics (Again)
A model is any simplified version of reality that is used to better understand real life situations.
The other things equal assumption
The other things equal assumption means that all other relevant factors remain unchanged. This is also known as the centers paribus assumption.
What does the Production Possibilities Curve (PPC) help you look at?
The trade-offs every economy faces.
Trade-off
You make a trade-off when you give up something in order to have something else.
The Production Possibilities Curve
The production possibilities curve illustrates the trade-offs facing an economy that produces only two goods. It shows the maximum quantity of one good that can be produced for each possible quantity of the other good produced.
PPC Example (Look at the Points)
Ex.
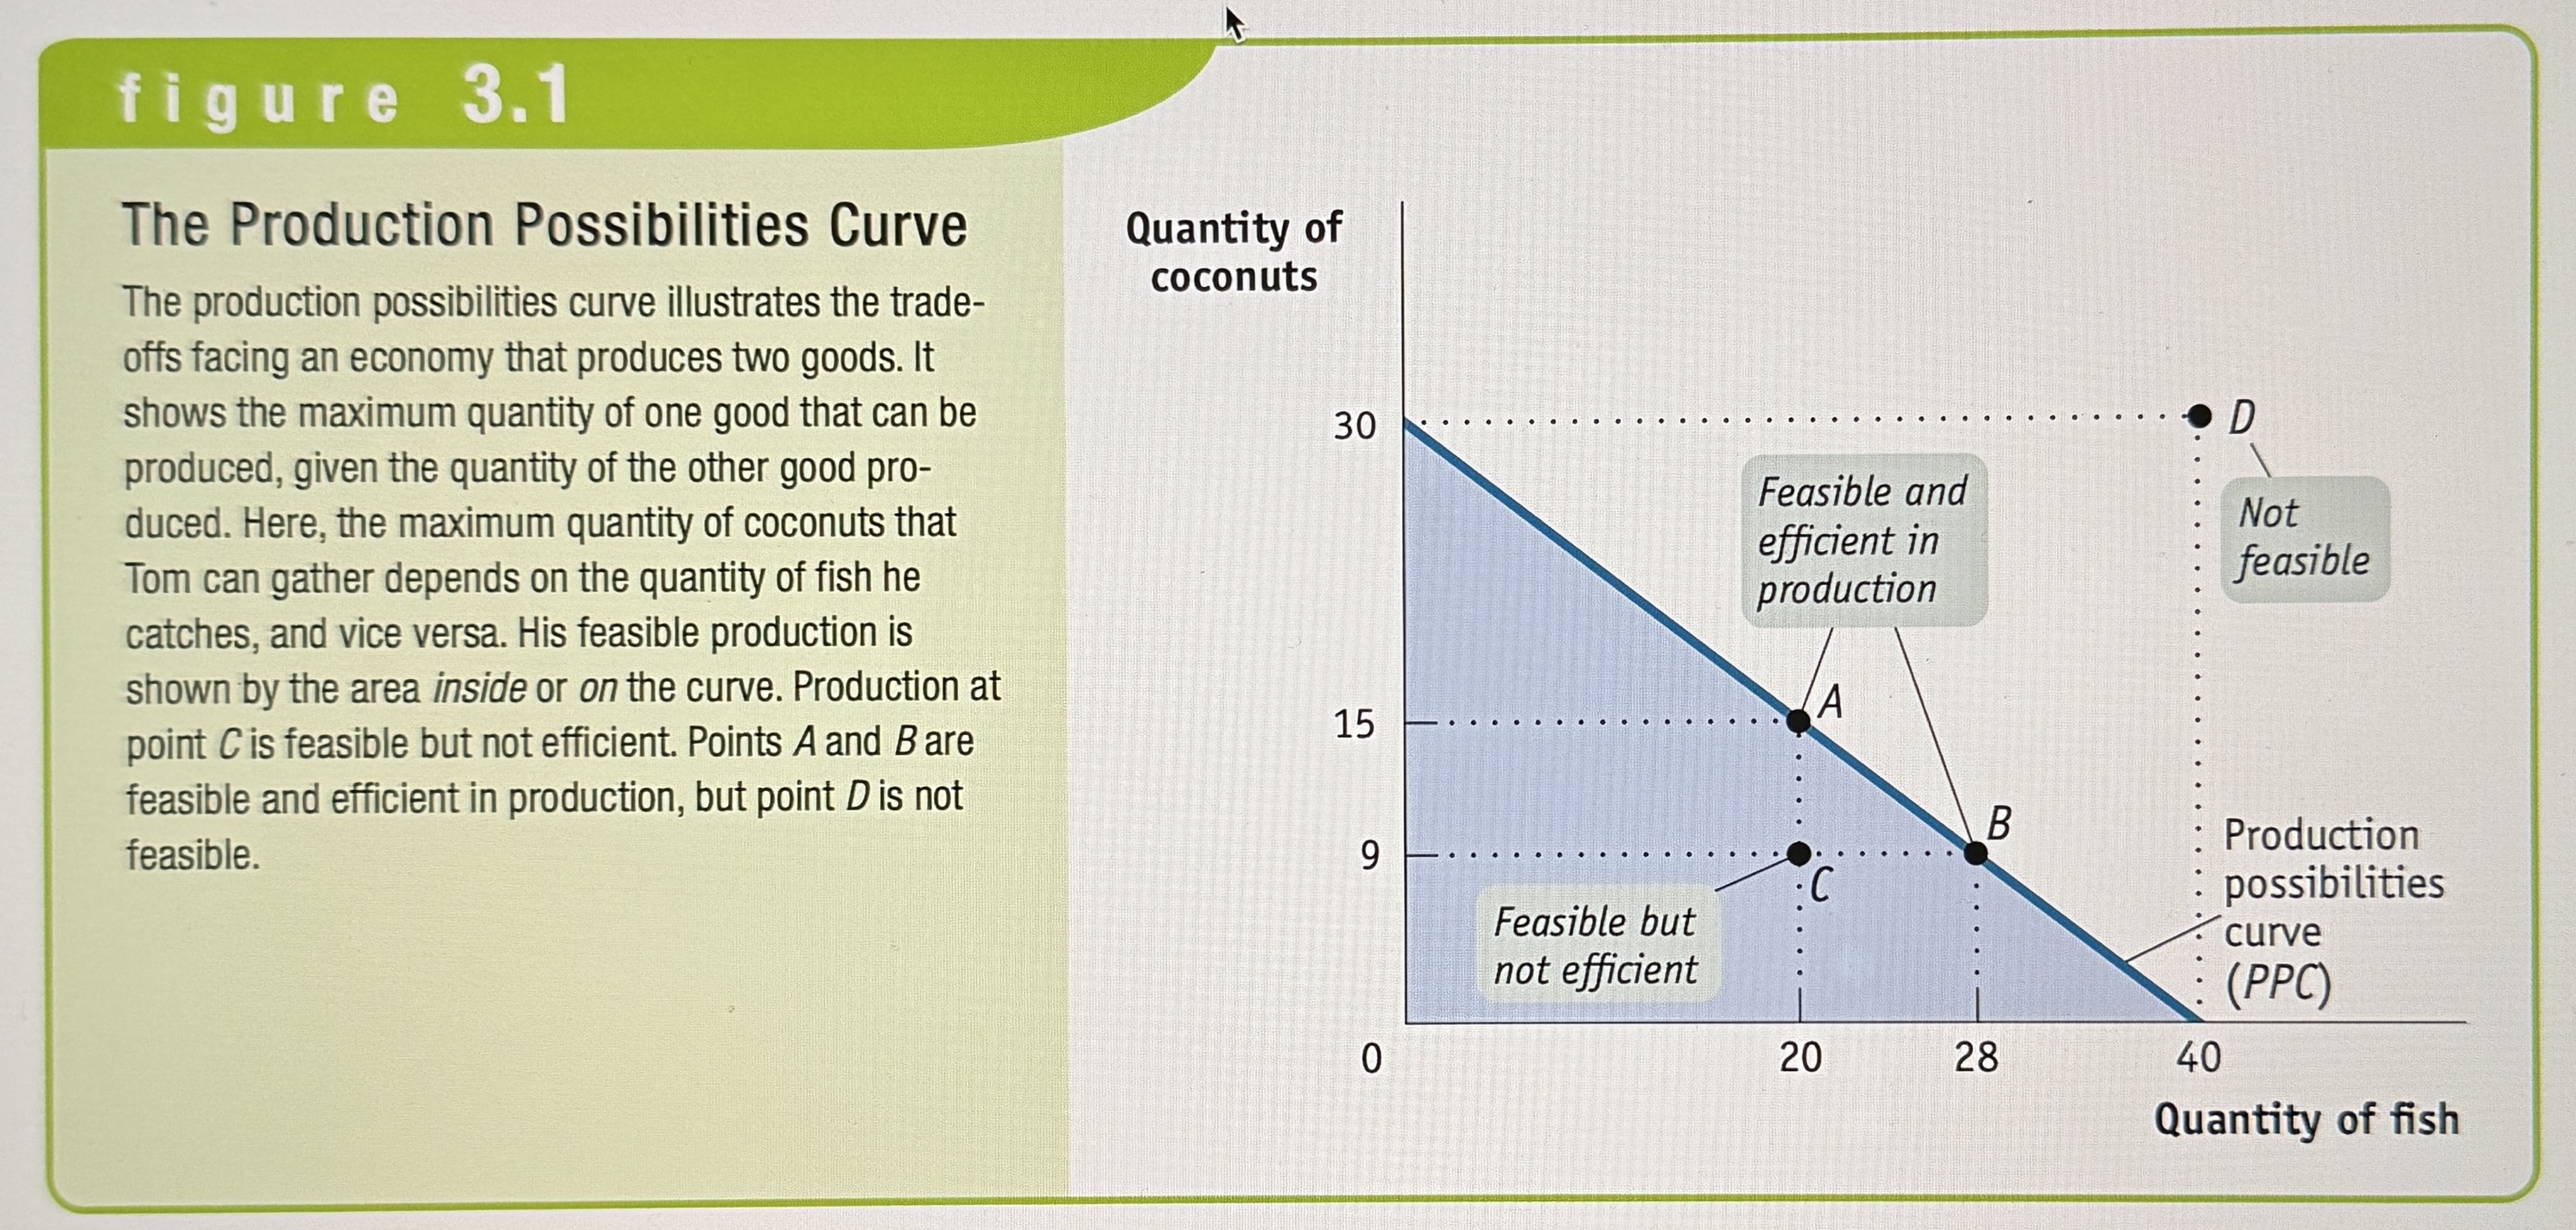
Efficient
an economy is efficient if there are no missed opportunities – meaning that there is no way to make someone people better off without making other people worse off.
Efficient in Production
If an economy is producing at any point on its production possibility curve.
Efficient in Allocation
If an economy allocates its resources so that consumers are as well off as possible. So a point with maximum production of one good may be efficient in production, but not allocation.
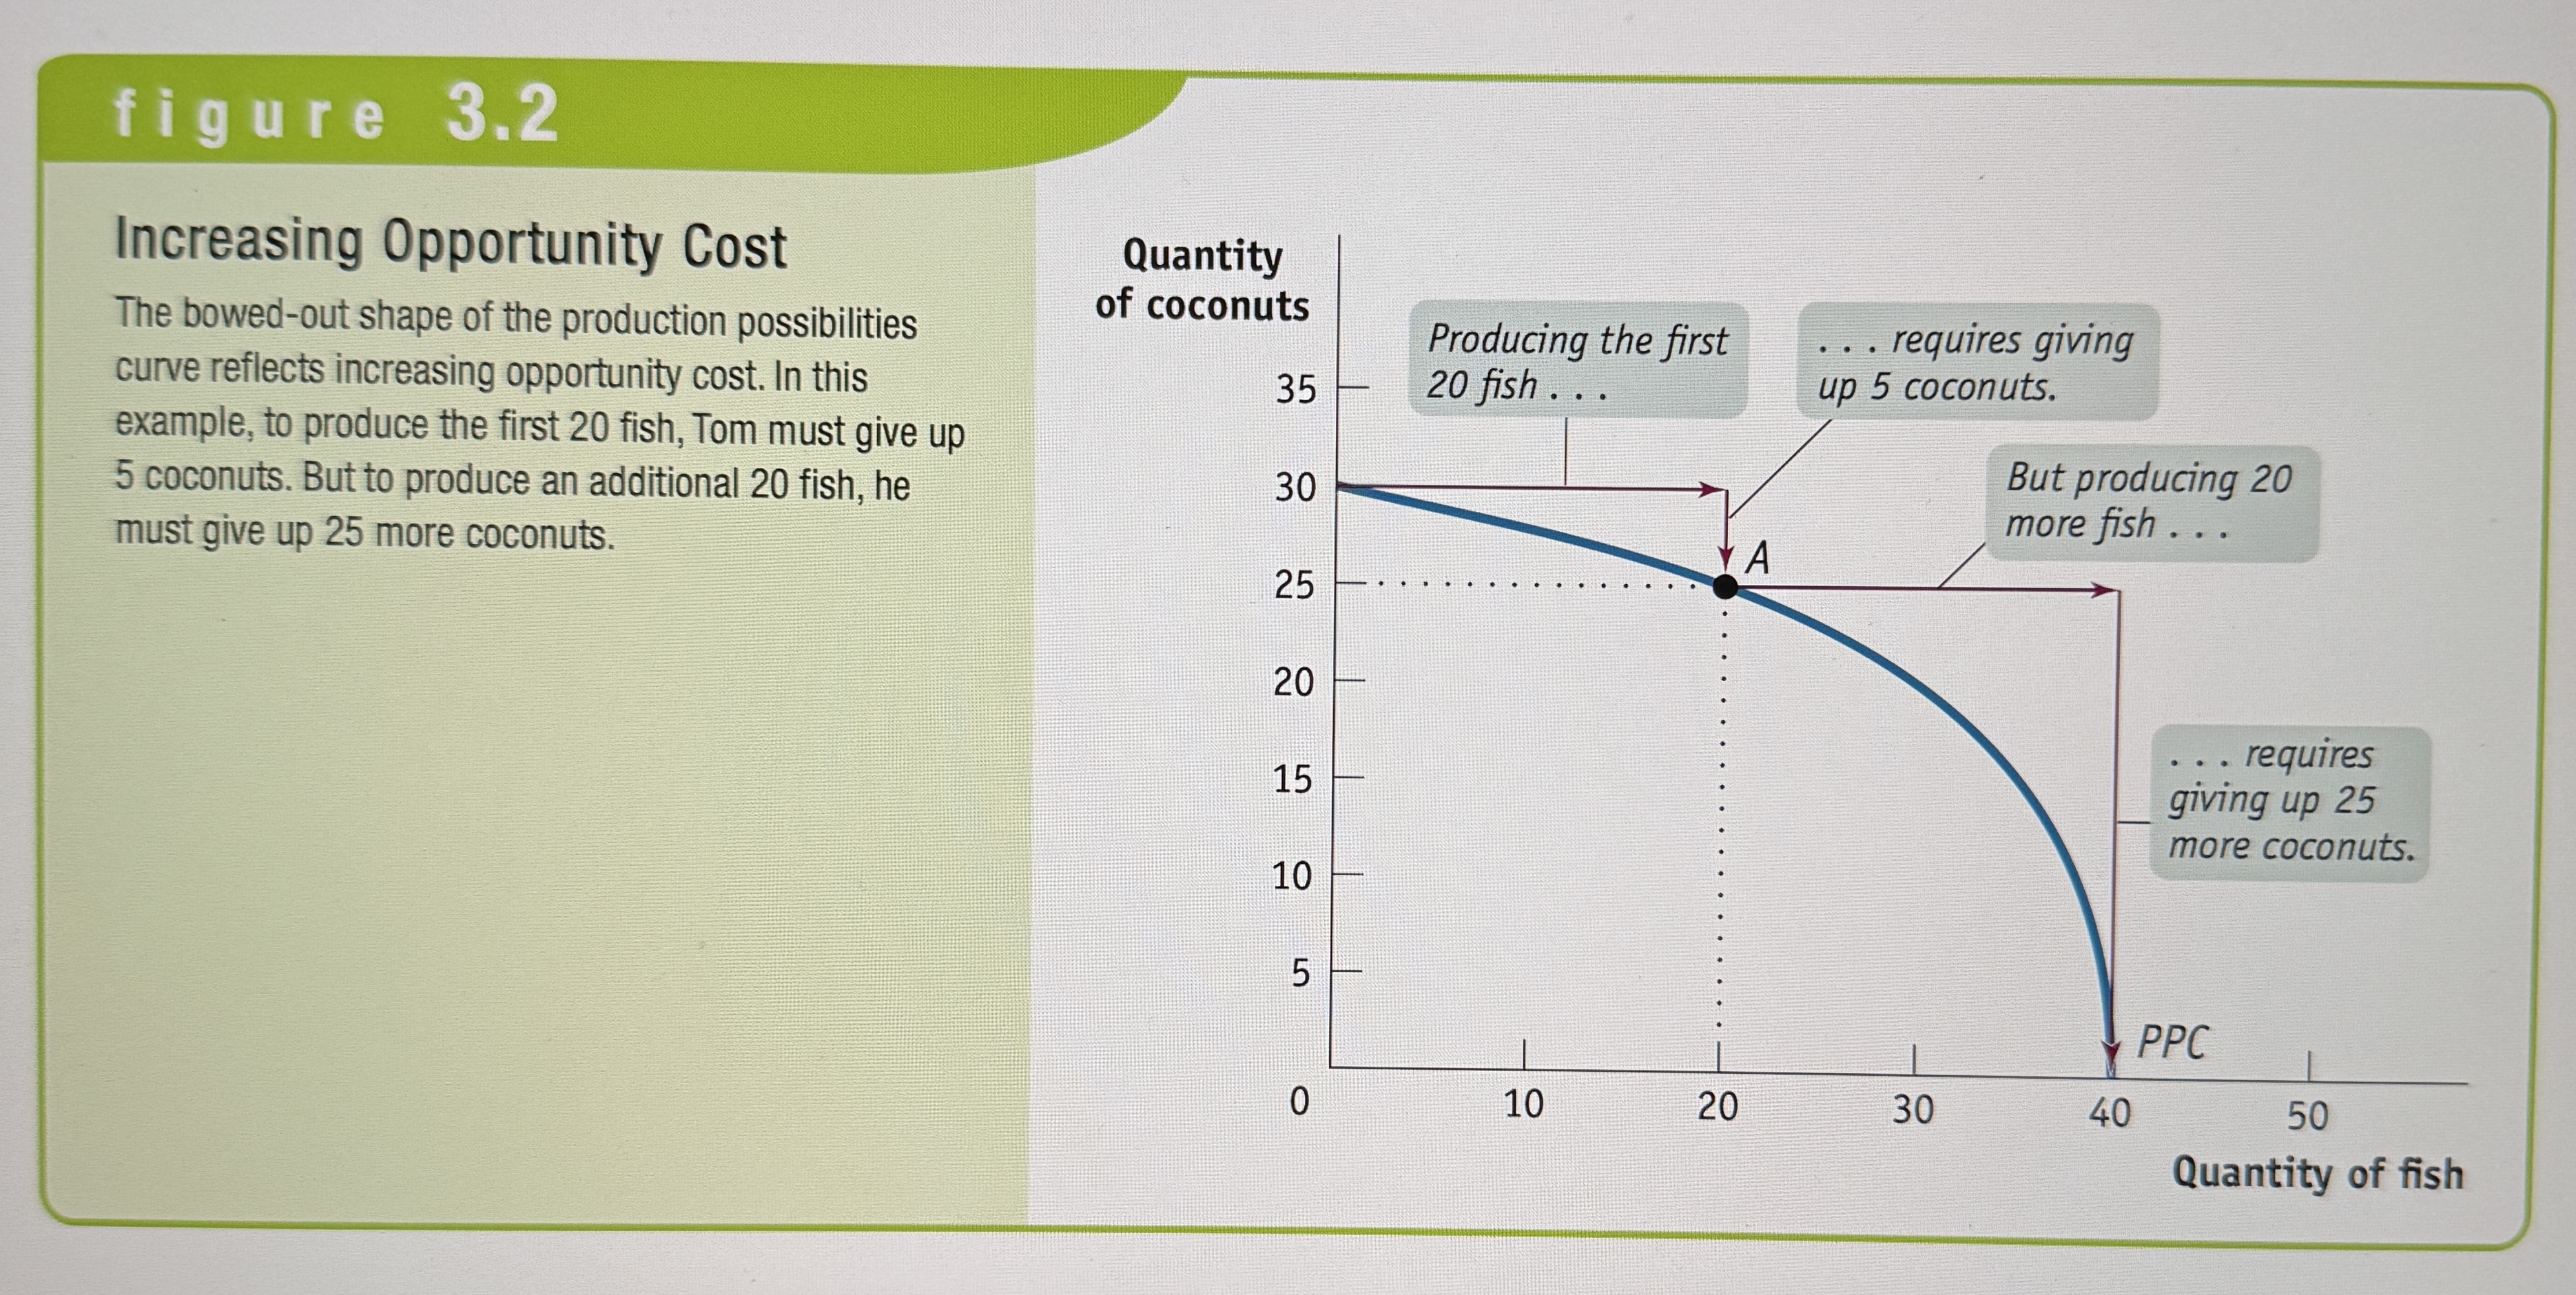
Moving along the PPC helps you find…?
Opportunity Cost (The slope of the line. Can be constant (straight line) or increasing (curved line))
Example of Increasing Opportunity Cost
Ex.
Example of Economic Growth in the PPC
Ex.
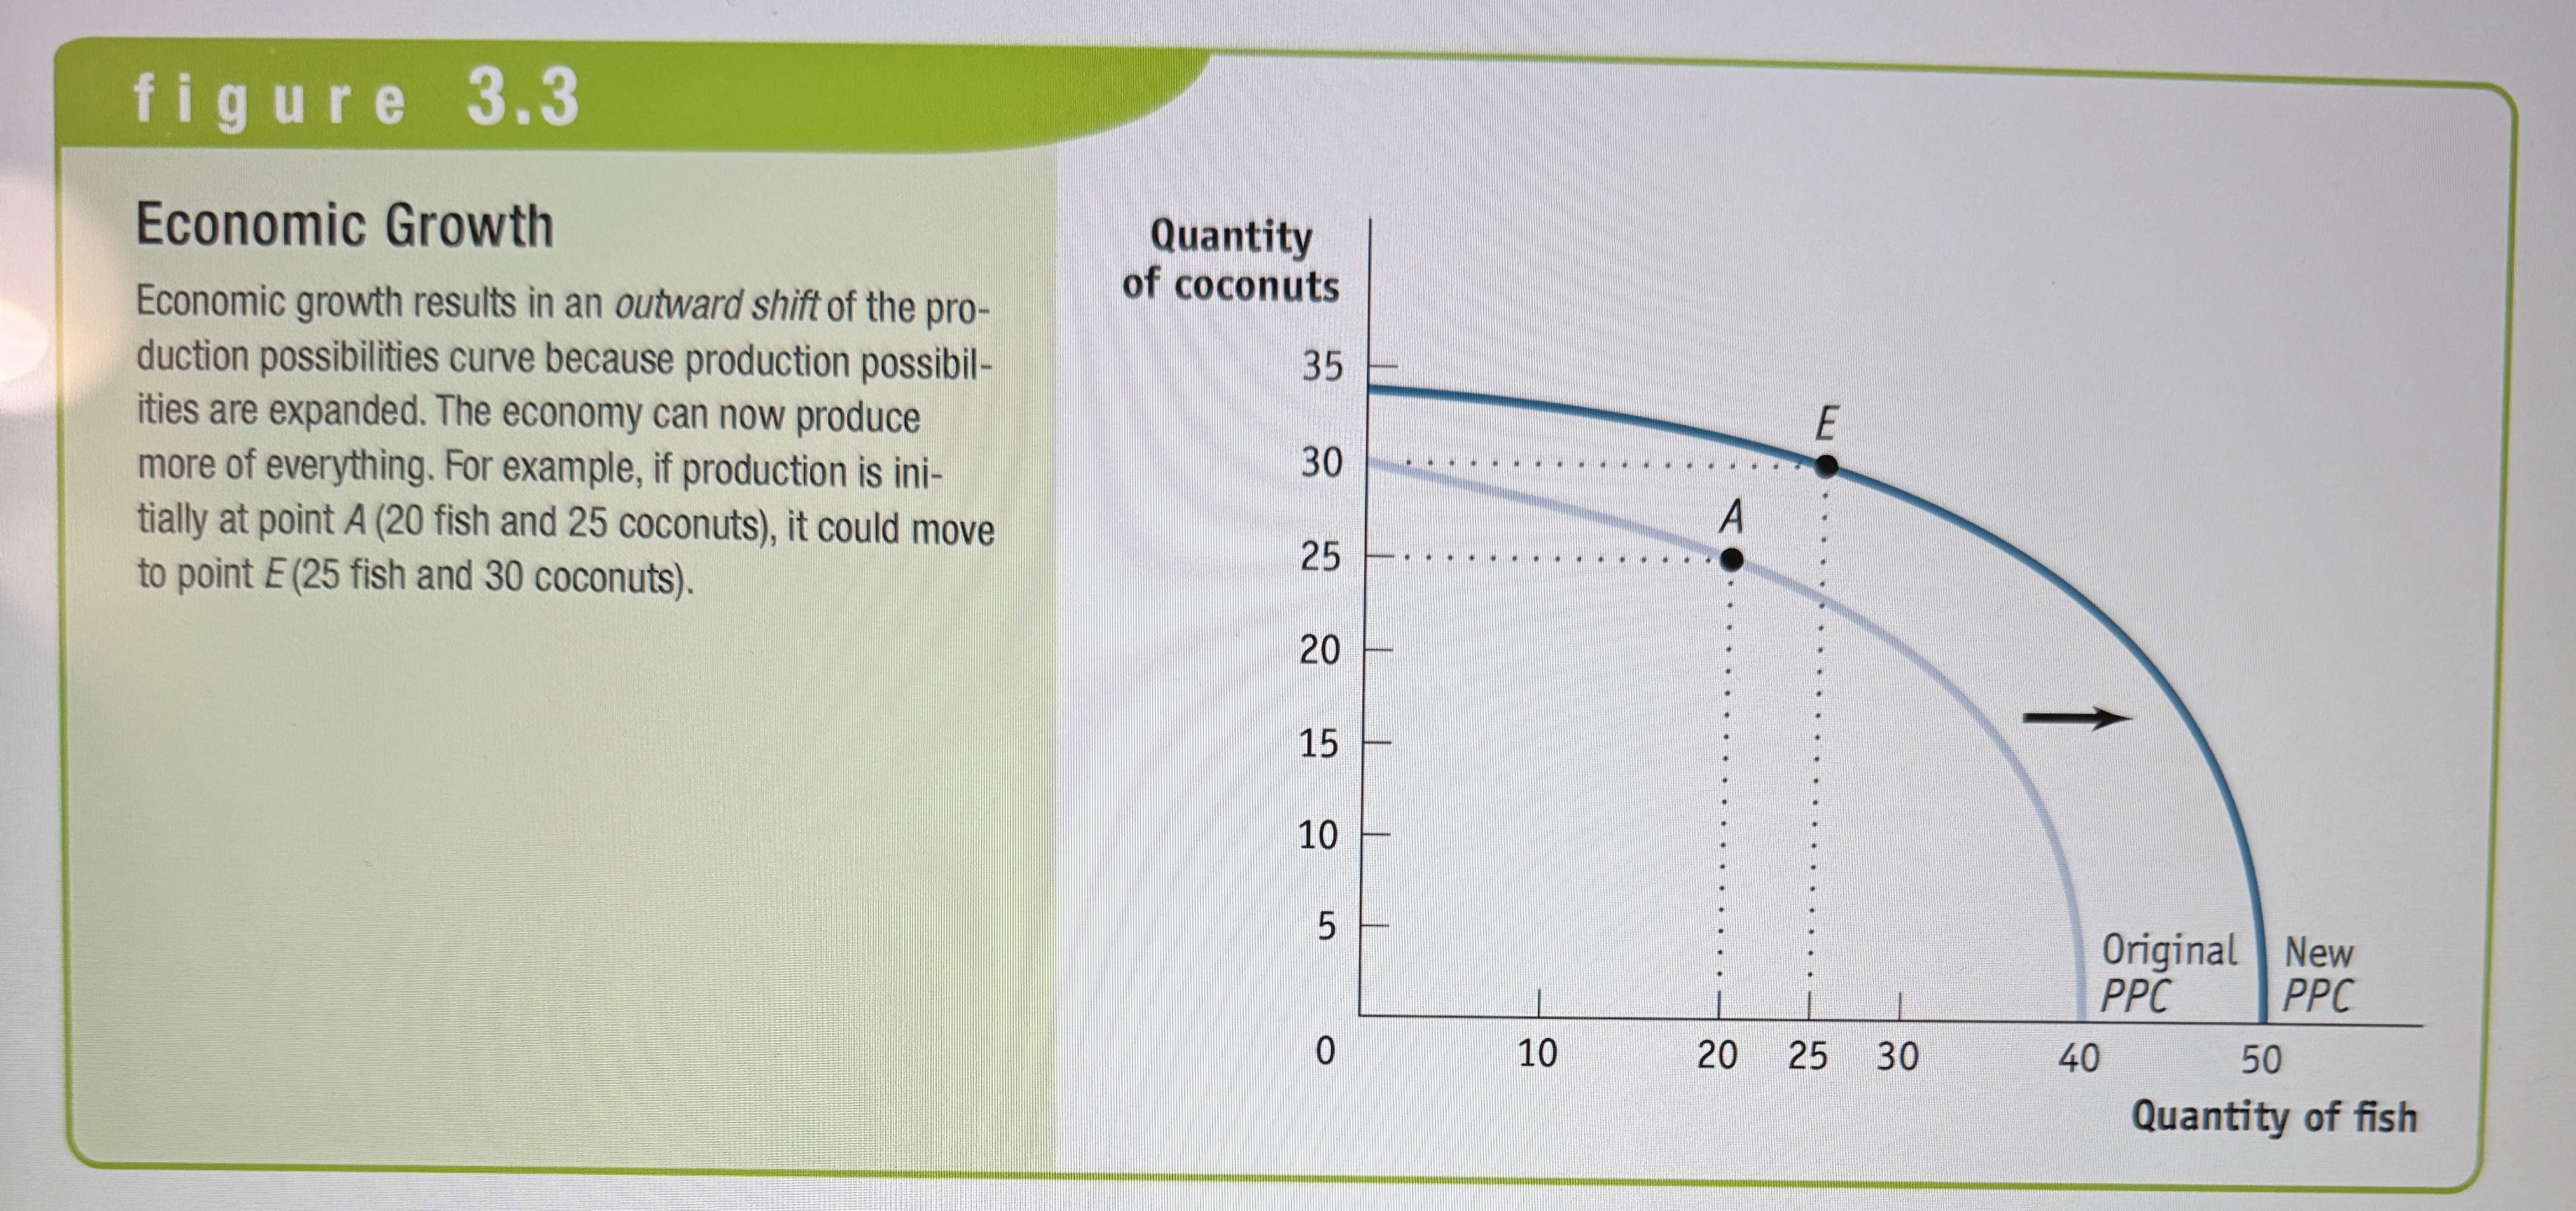
What shifts the PPC?
Increase in resources or progress through technology
Technology
The technical means for producing goods and services.
Trade
Providing goods and services to others and receiving goods and services in return. Necessary in a market economy.
Gains from Trade
People can get more of what they want through trade than they could if they tried to be self-sufficient. This increase in output is due to specialization: each person specializes in the task that he or she is good at performing.
Exploring Comparative Advantage
Ex.
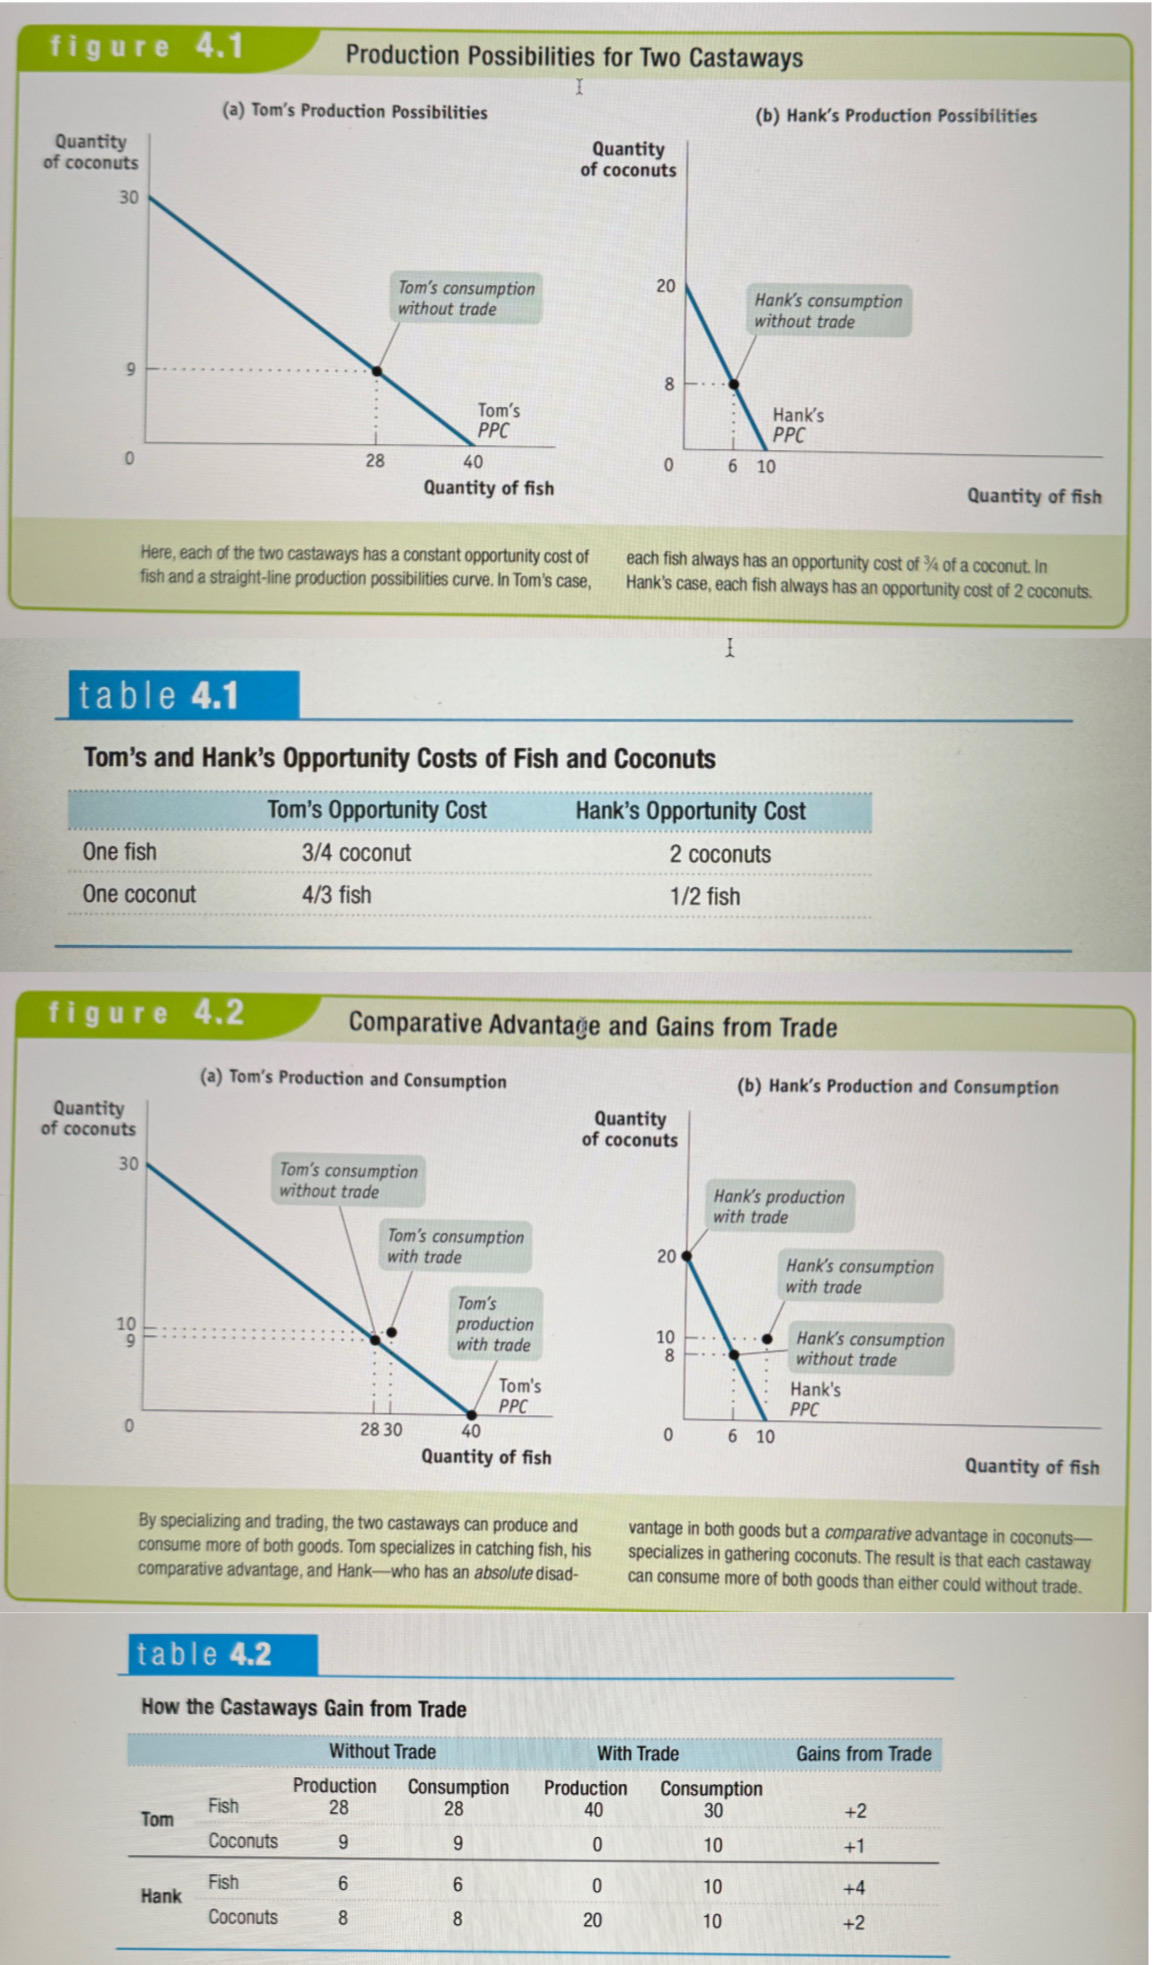
Comparative Advantage
An individual has a comparative advantage in producing a good or service if the opportunity cost of producing the good or service is lower for that individual than the other people.
Absolute Advantage
An individual has an absolute advantage in producing a good or service if he or she can make more of it with a given amount of time and resources. Having an absolute advantage is not the same as having a comparative advantage.
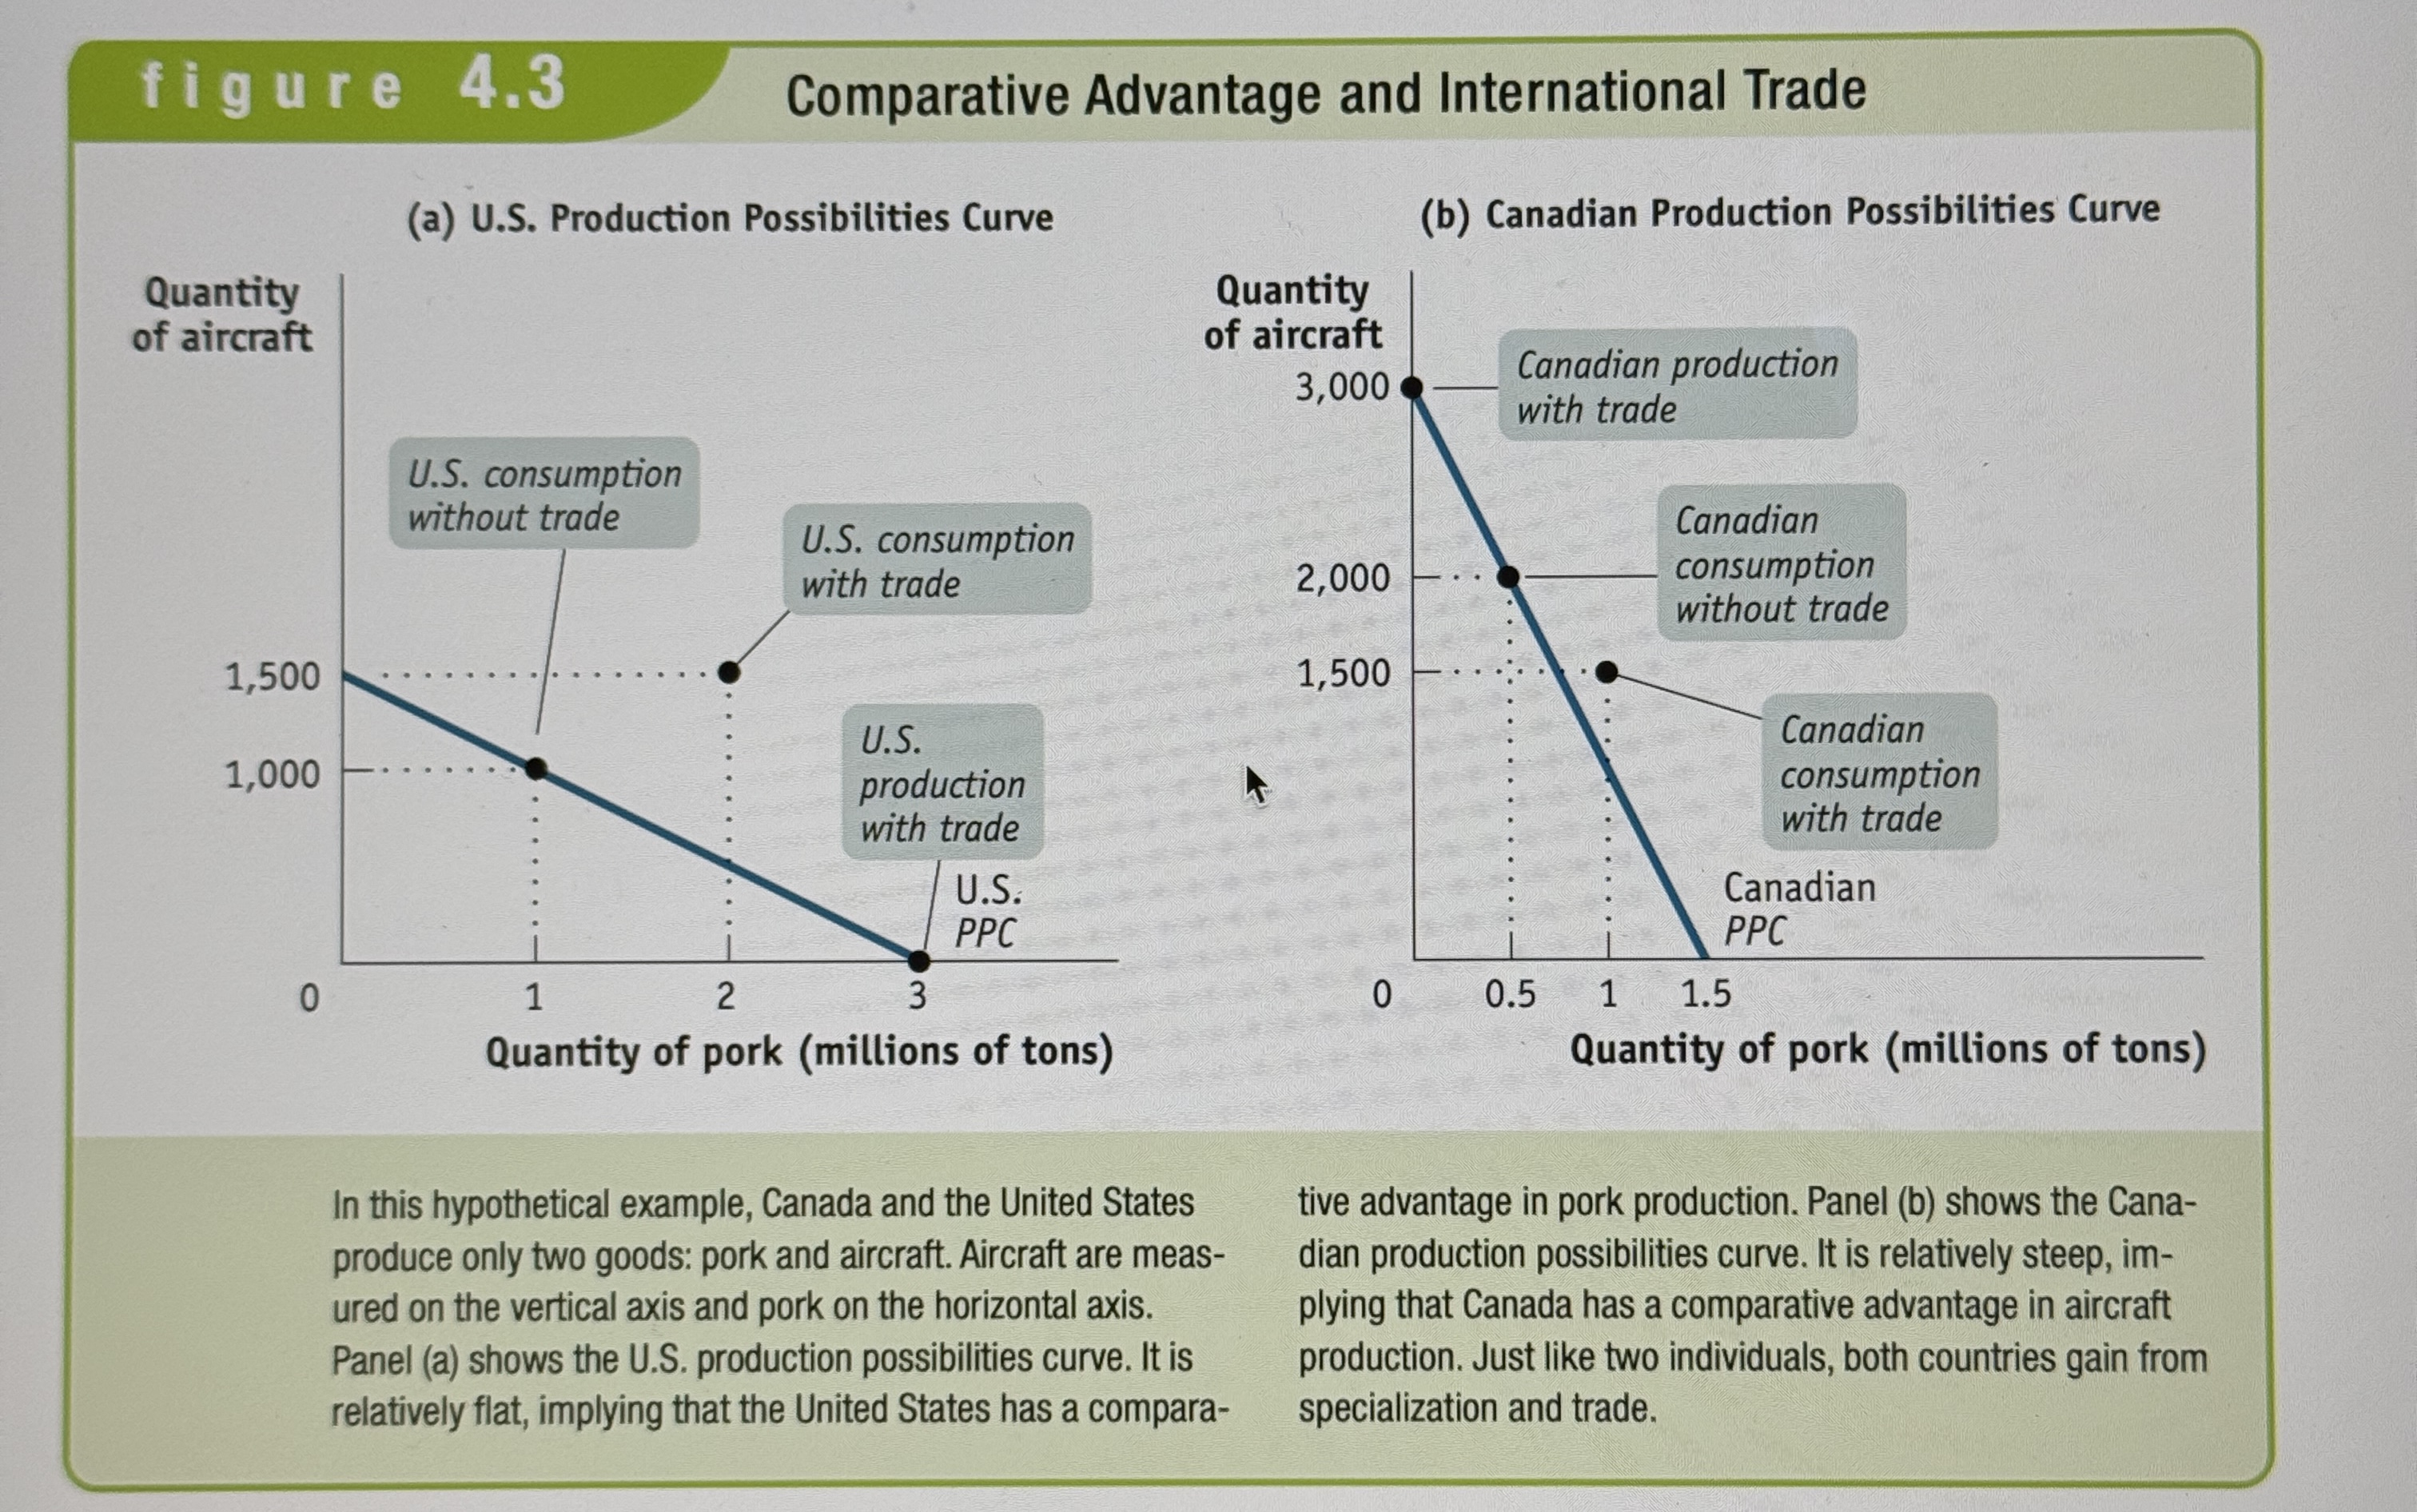
Comparative Advantage and International Trade
Ex.
Variable
A quantity that can take on more than one value, such as the number of years of education a person has. The things you plot on graphs.
Plotting Points on two-variable graphs
Ex.
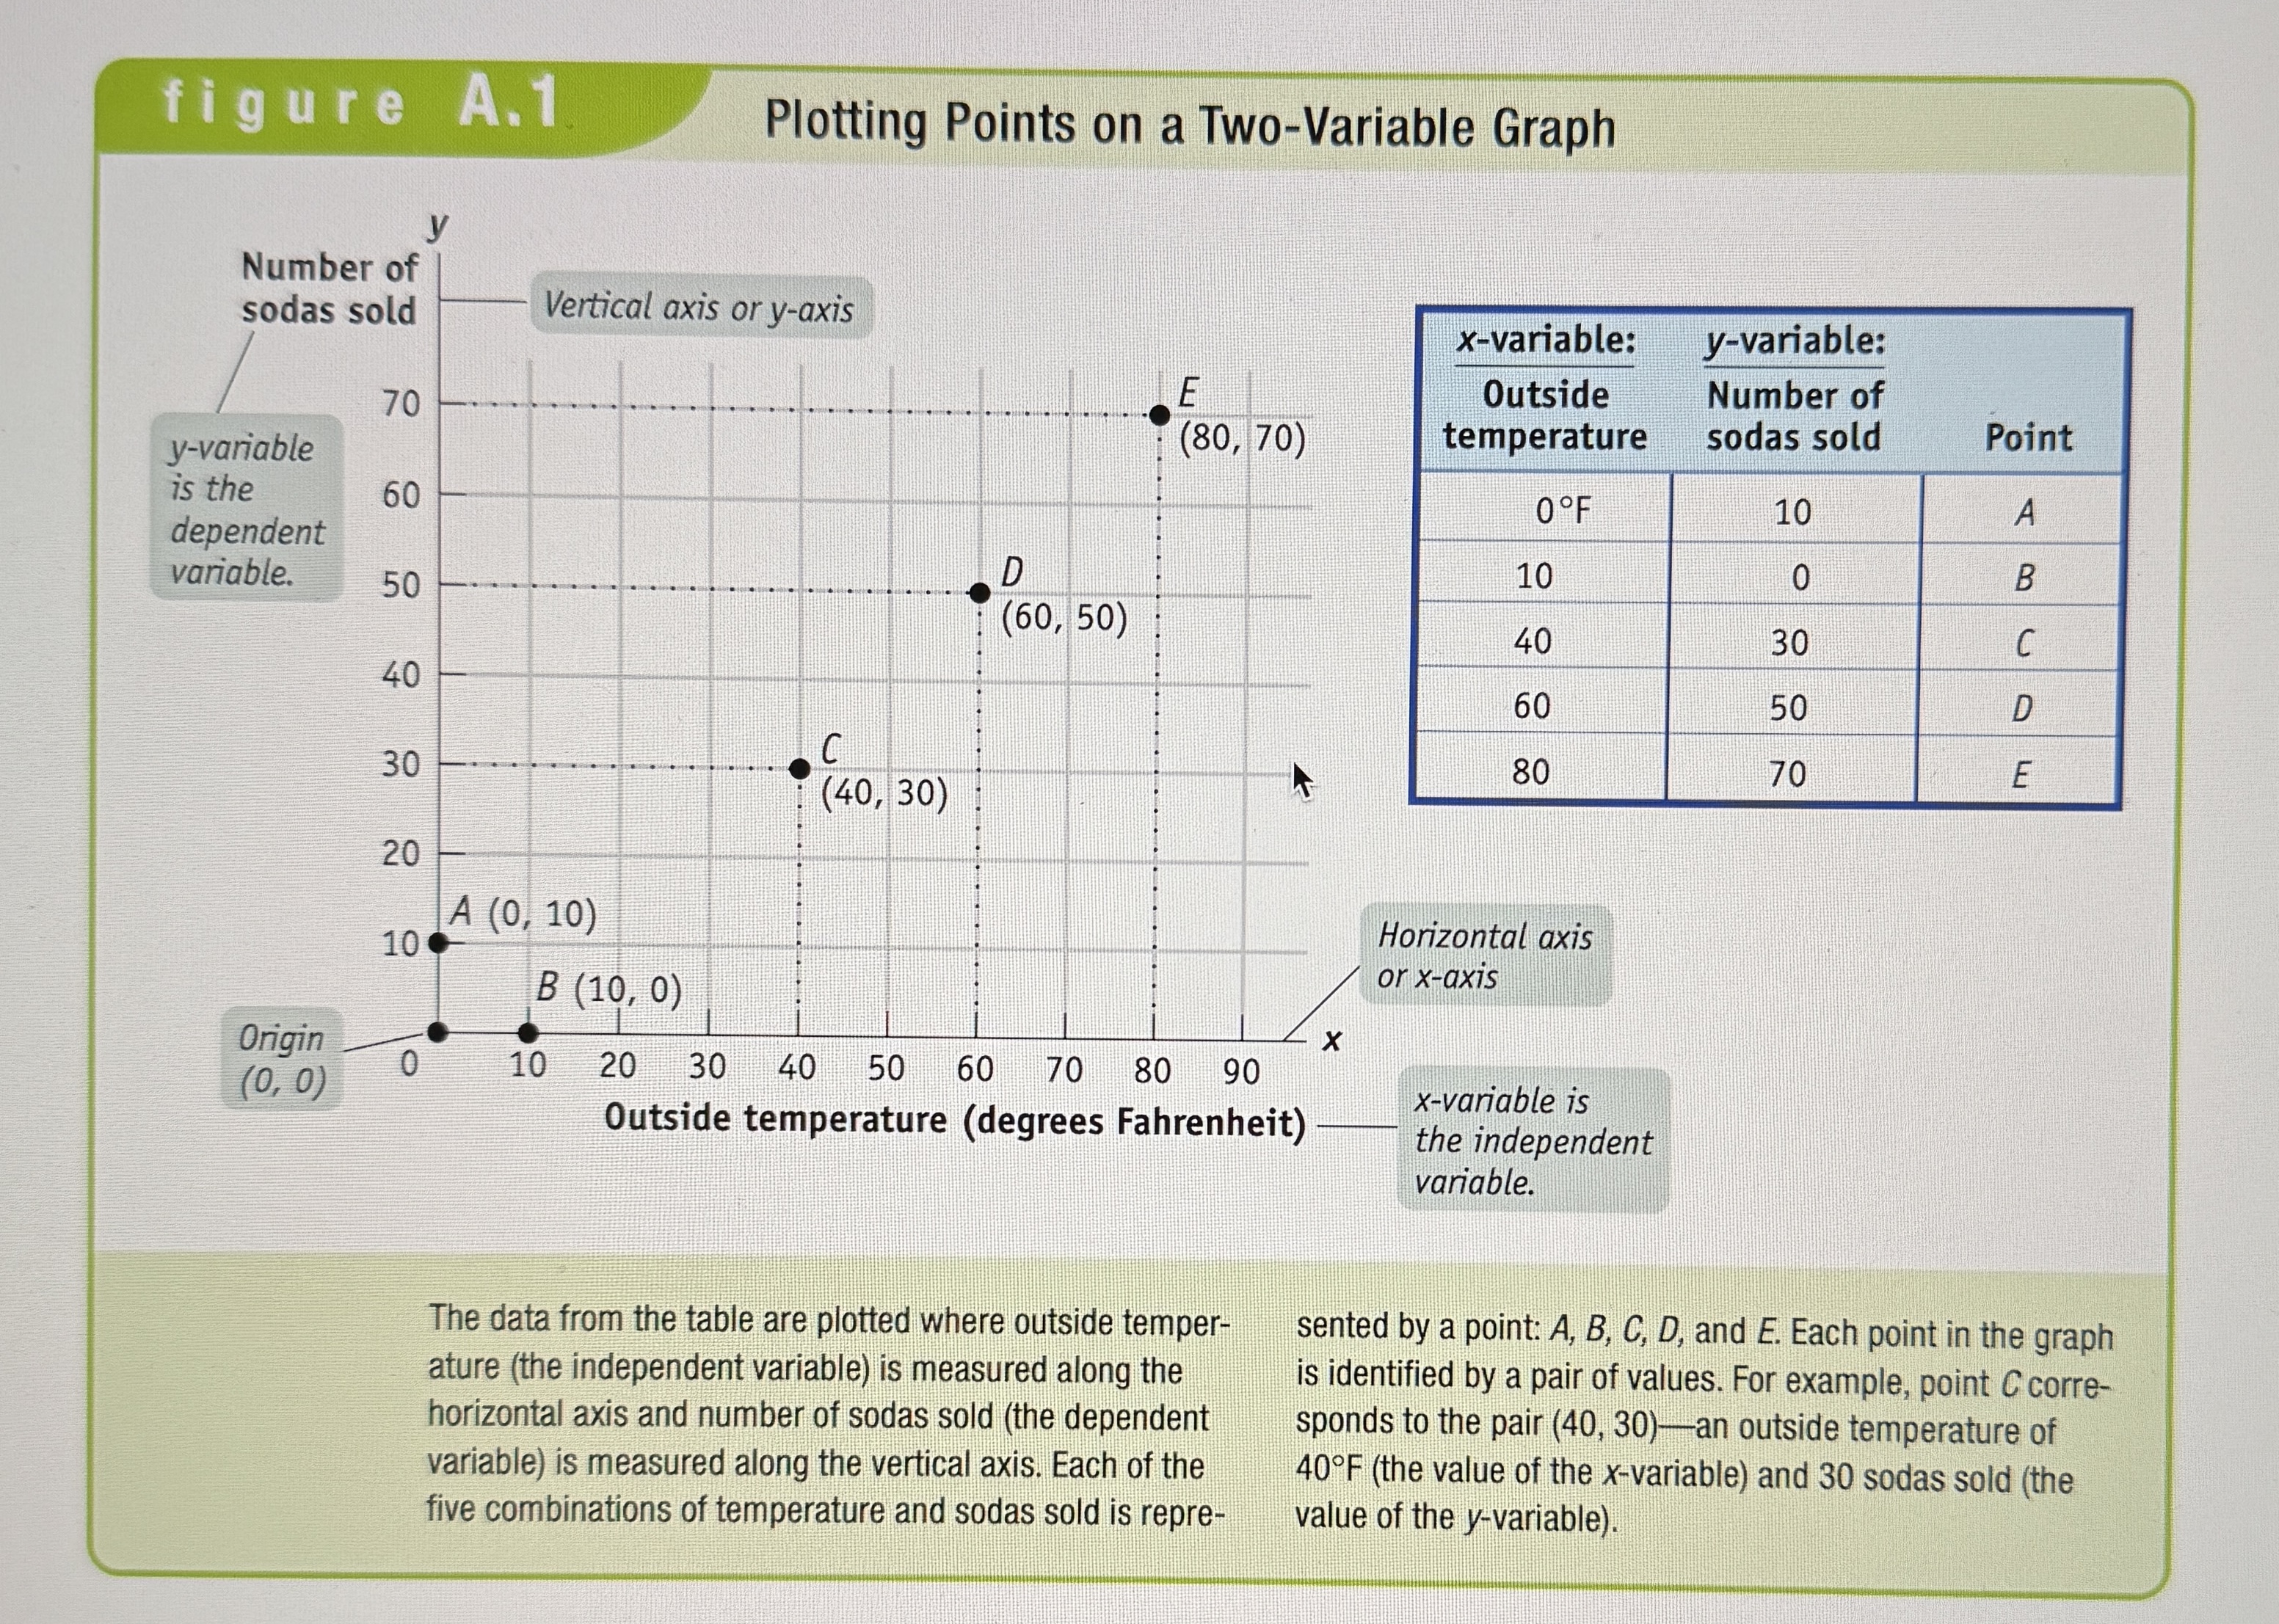
Casual Relationship
Most graphs that depict relationships between two economic variables represent a causal relationship, a relationship in which the value taken by one variable directly influences or determines the value taken by the other variable. In a causal relation-ship, the determining variable is called the independent variable; the variable it determines is called the dependent variable. In our example of soda sales, the outside temperature is the independent variable. It directly influences the number of sodas that are sold, which is the dependent variable in this case.
Curves
A line on a graph is called a curve, regardless of whether it is a straight line or a curved line. If the curve that shows the relationship between two variables is a straight line, or linear, the variables have a linear relationship. When the curve is not a straight line, or nonlinear, the variables have a nonlinear relationship.
When variables are related in this way-that is, when an increase in one variable is associated with an increase in the other variable-the variables are said to have a positive relationship. It is illustrated by a curve that slopes upward from left to right.
When an increase in one variable is associated with a decrease in the other variable, the two variables are said to have a negative relationship.
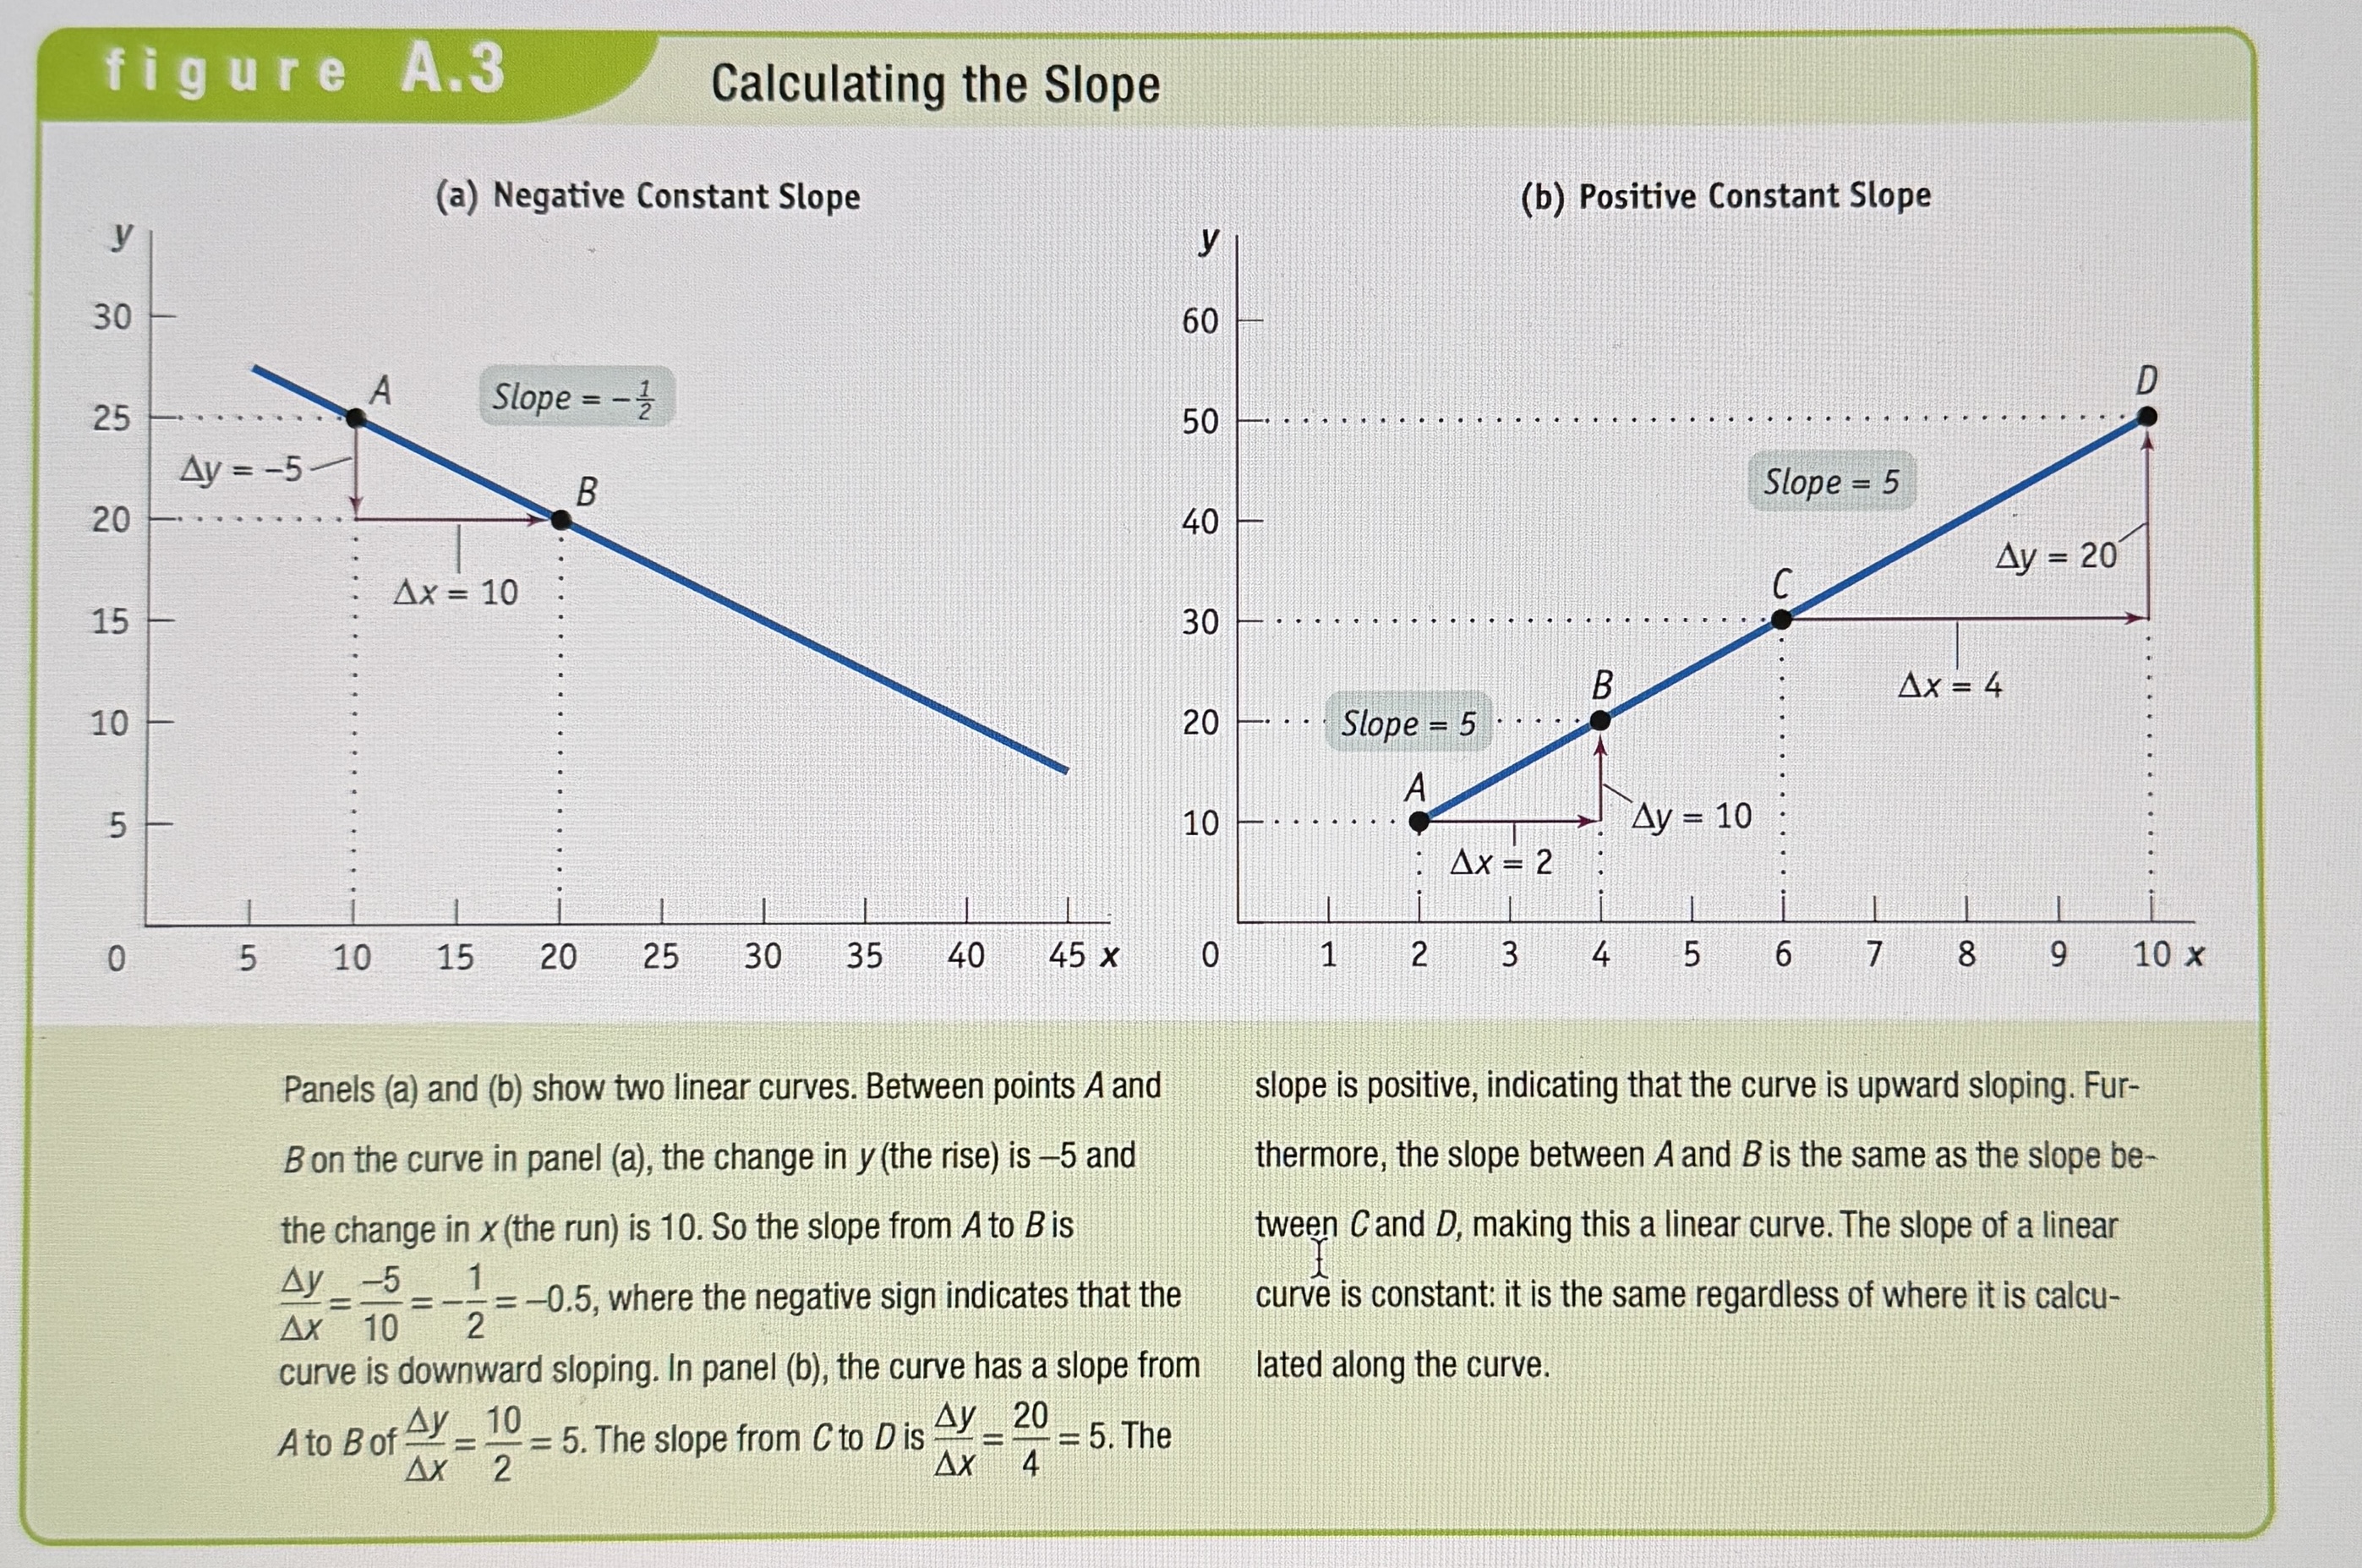
Slope
The measure of how steep a curve is.

Calculating Linear Slope
Ex.
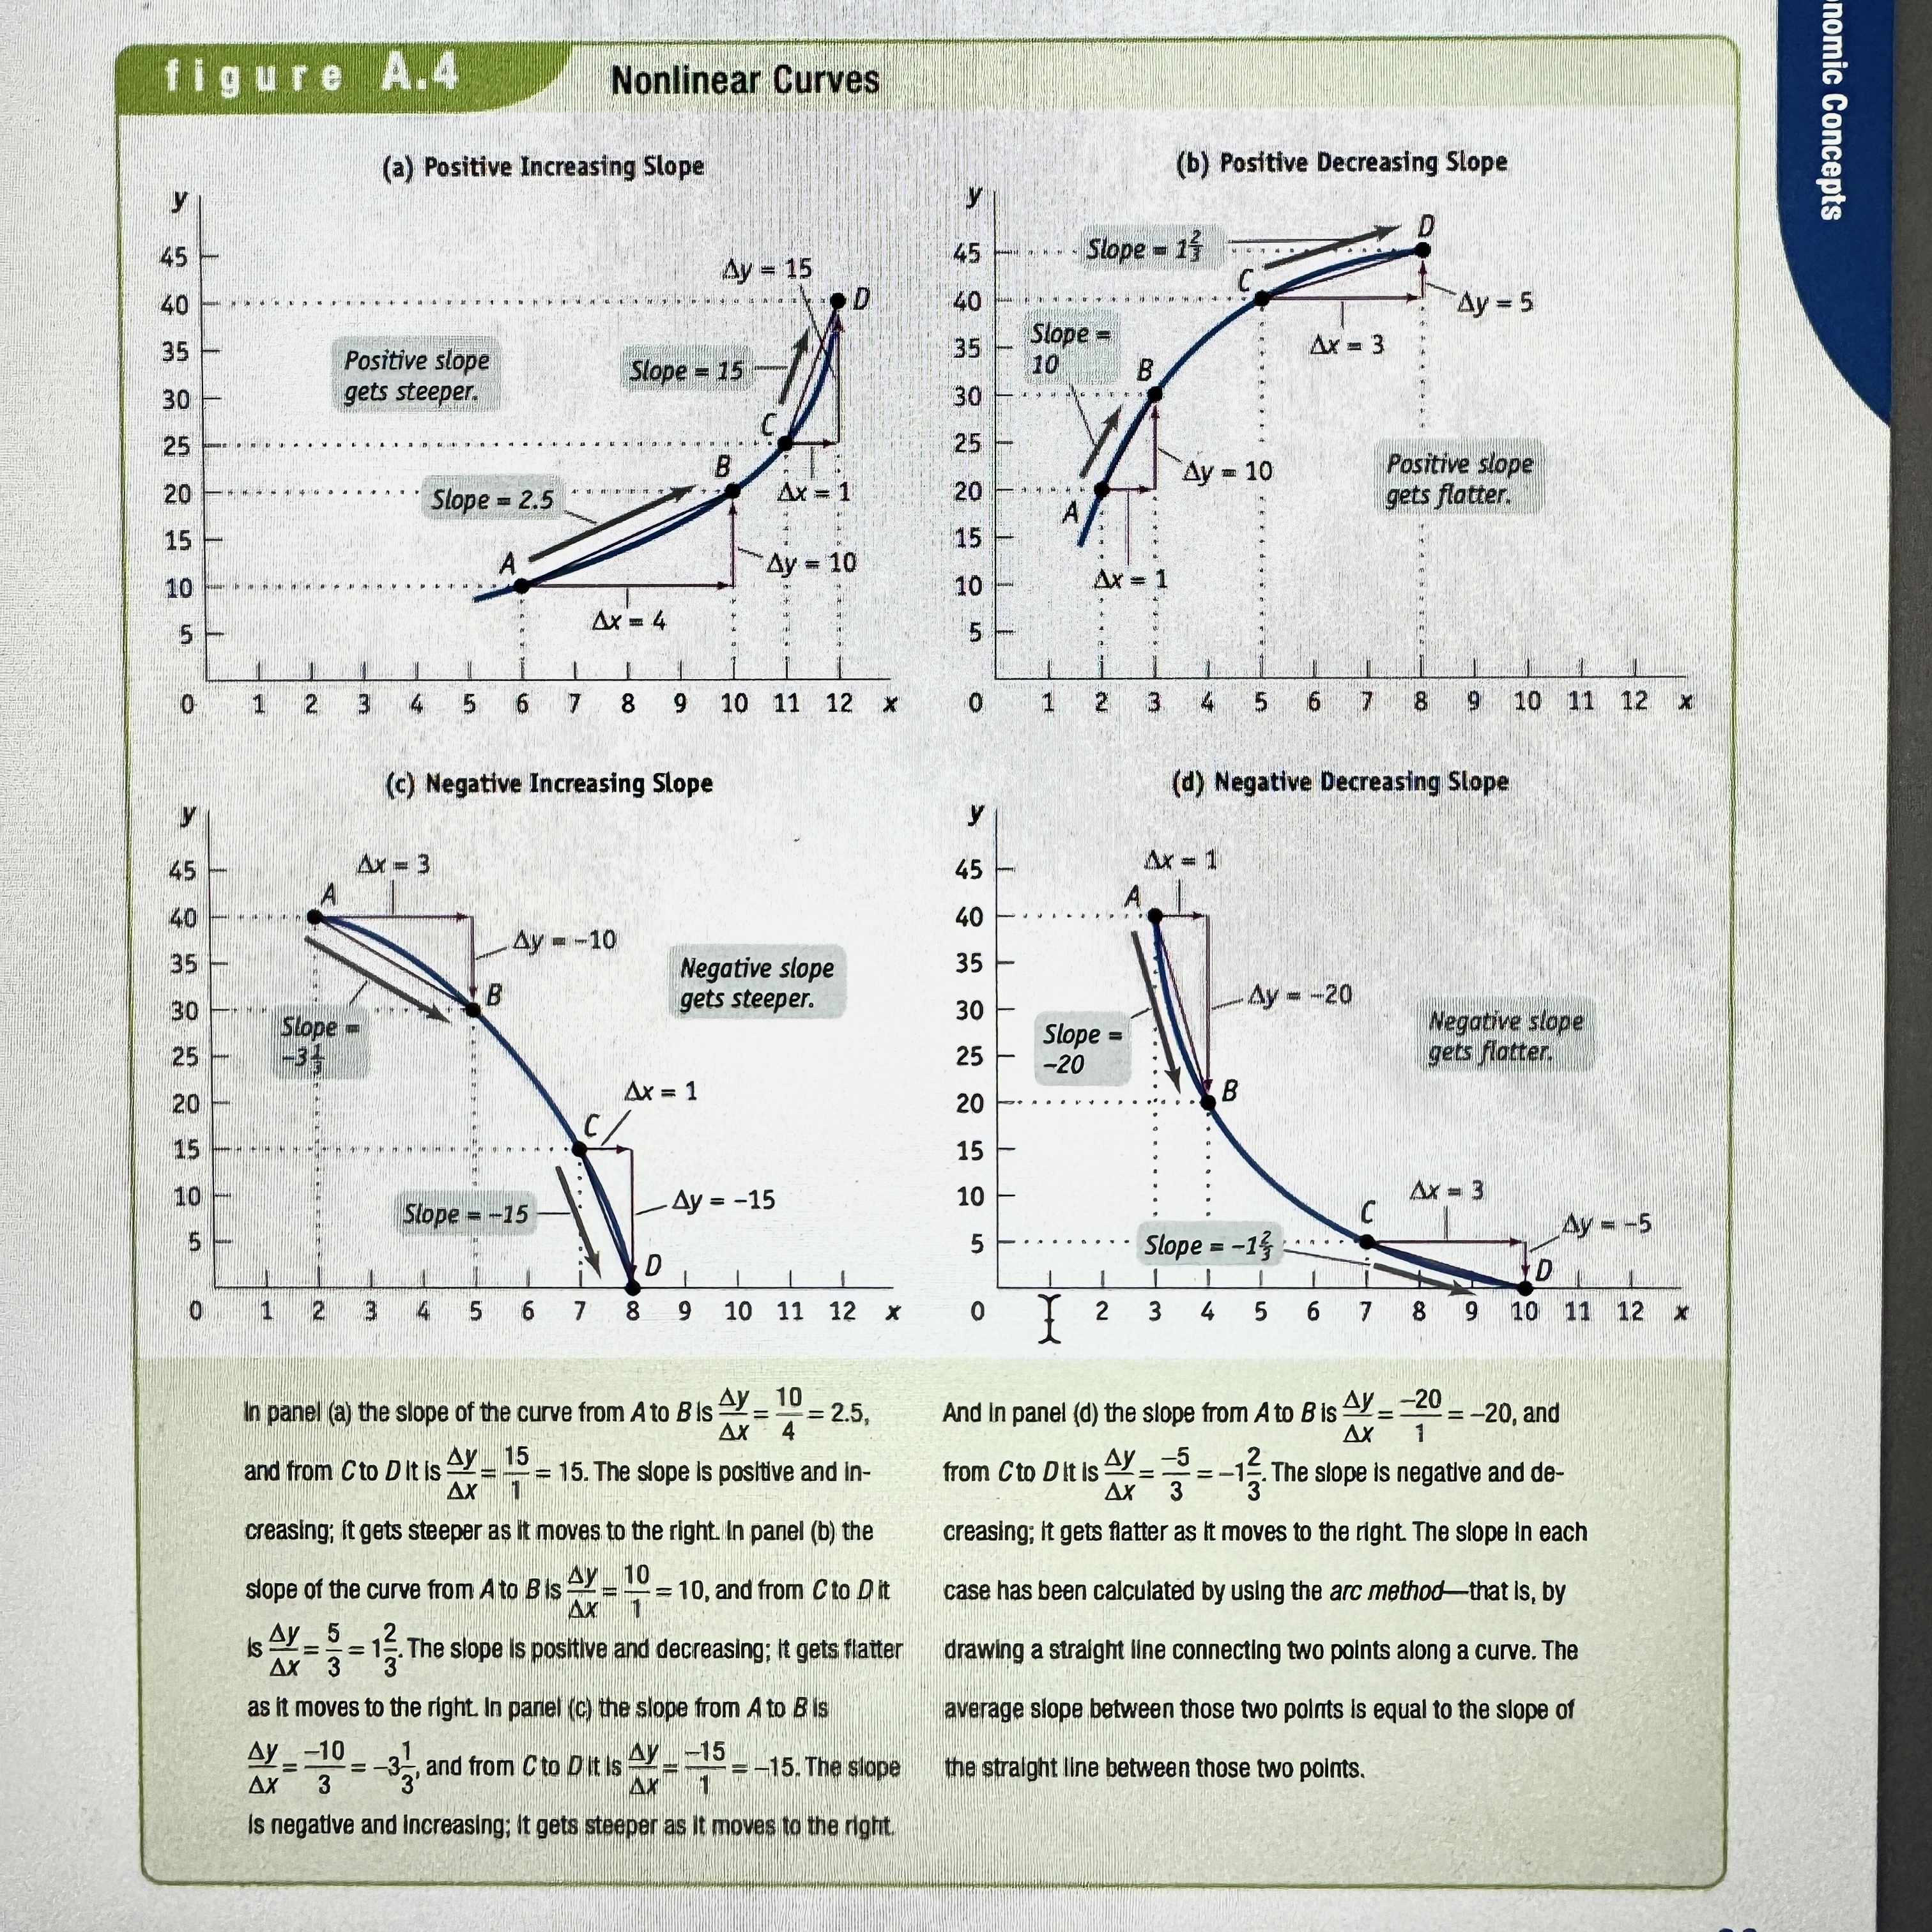
Calculating Nonlinear Slope
Ex.
Absolute Value
Economists often prefer to express a negative number as its absolute value, which is the value of the negative number without the minus sign.
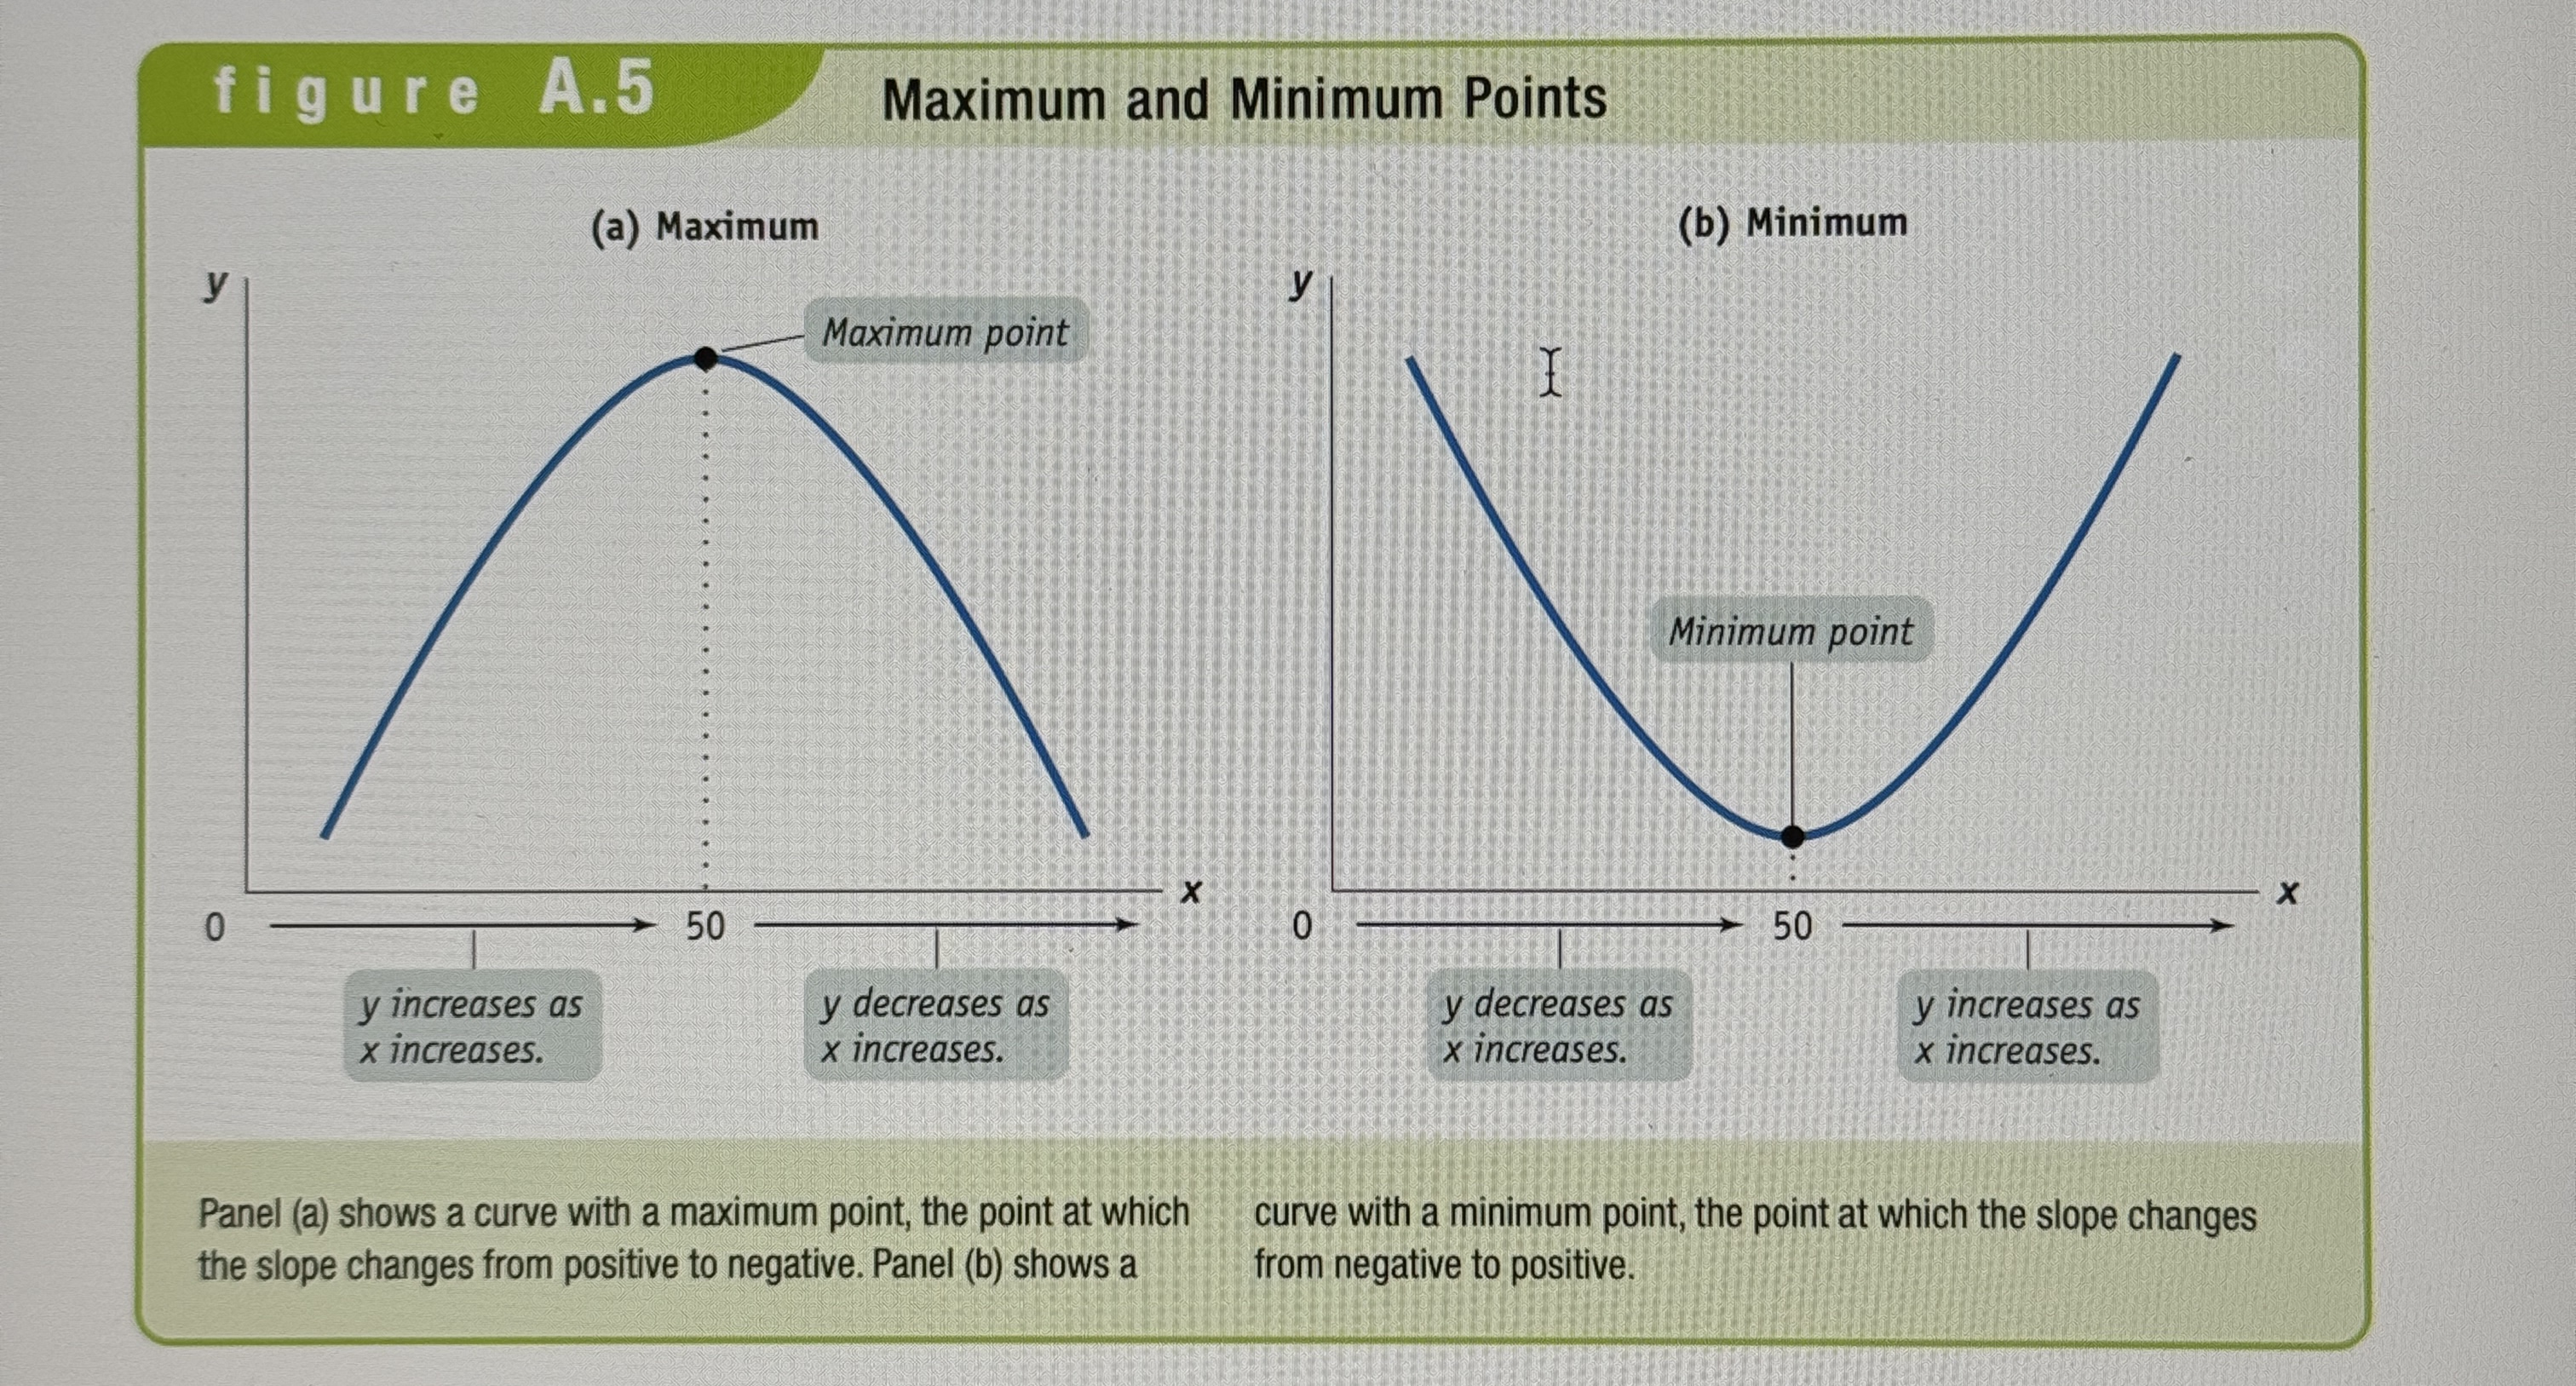
Maximums and Minimums
Ex.
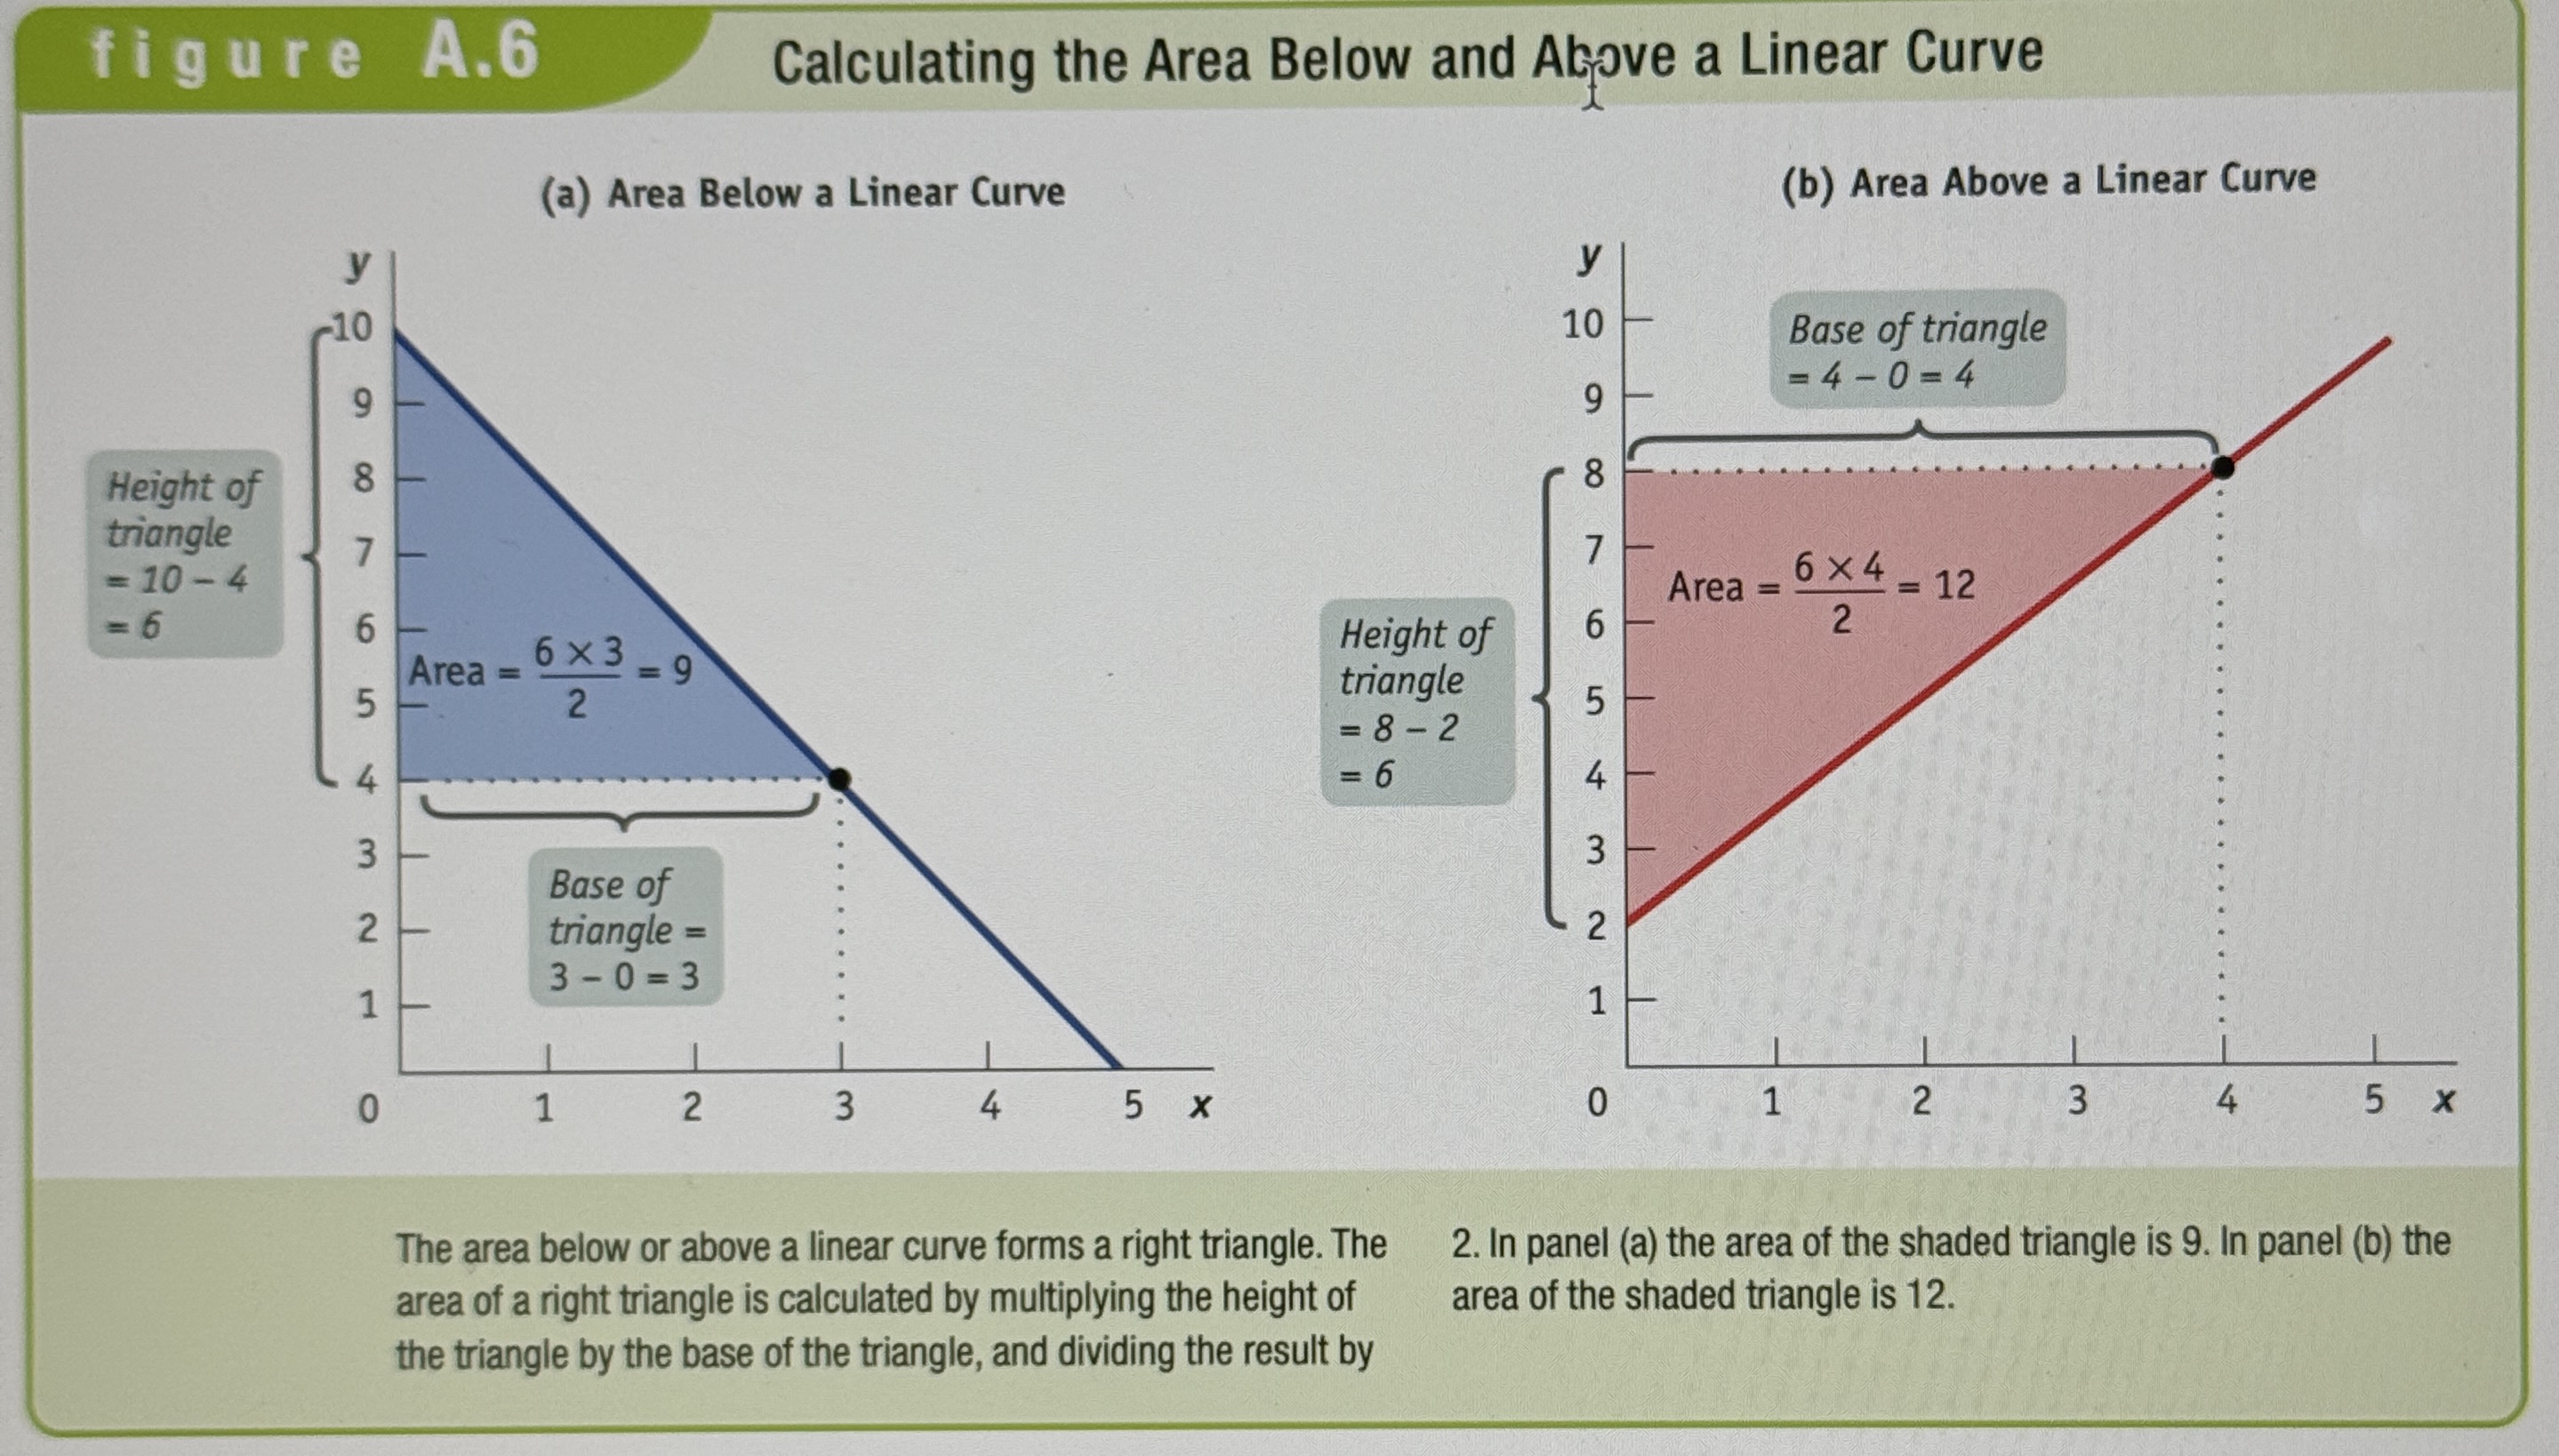
Finding Area Above and Below linear curves.
Ex.
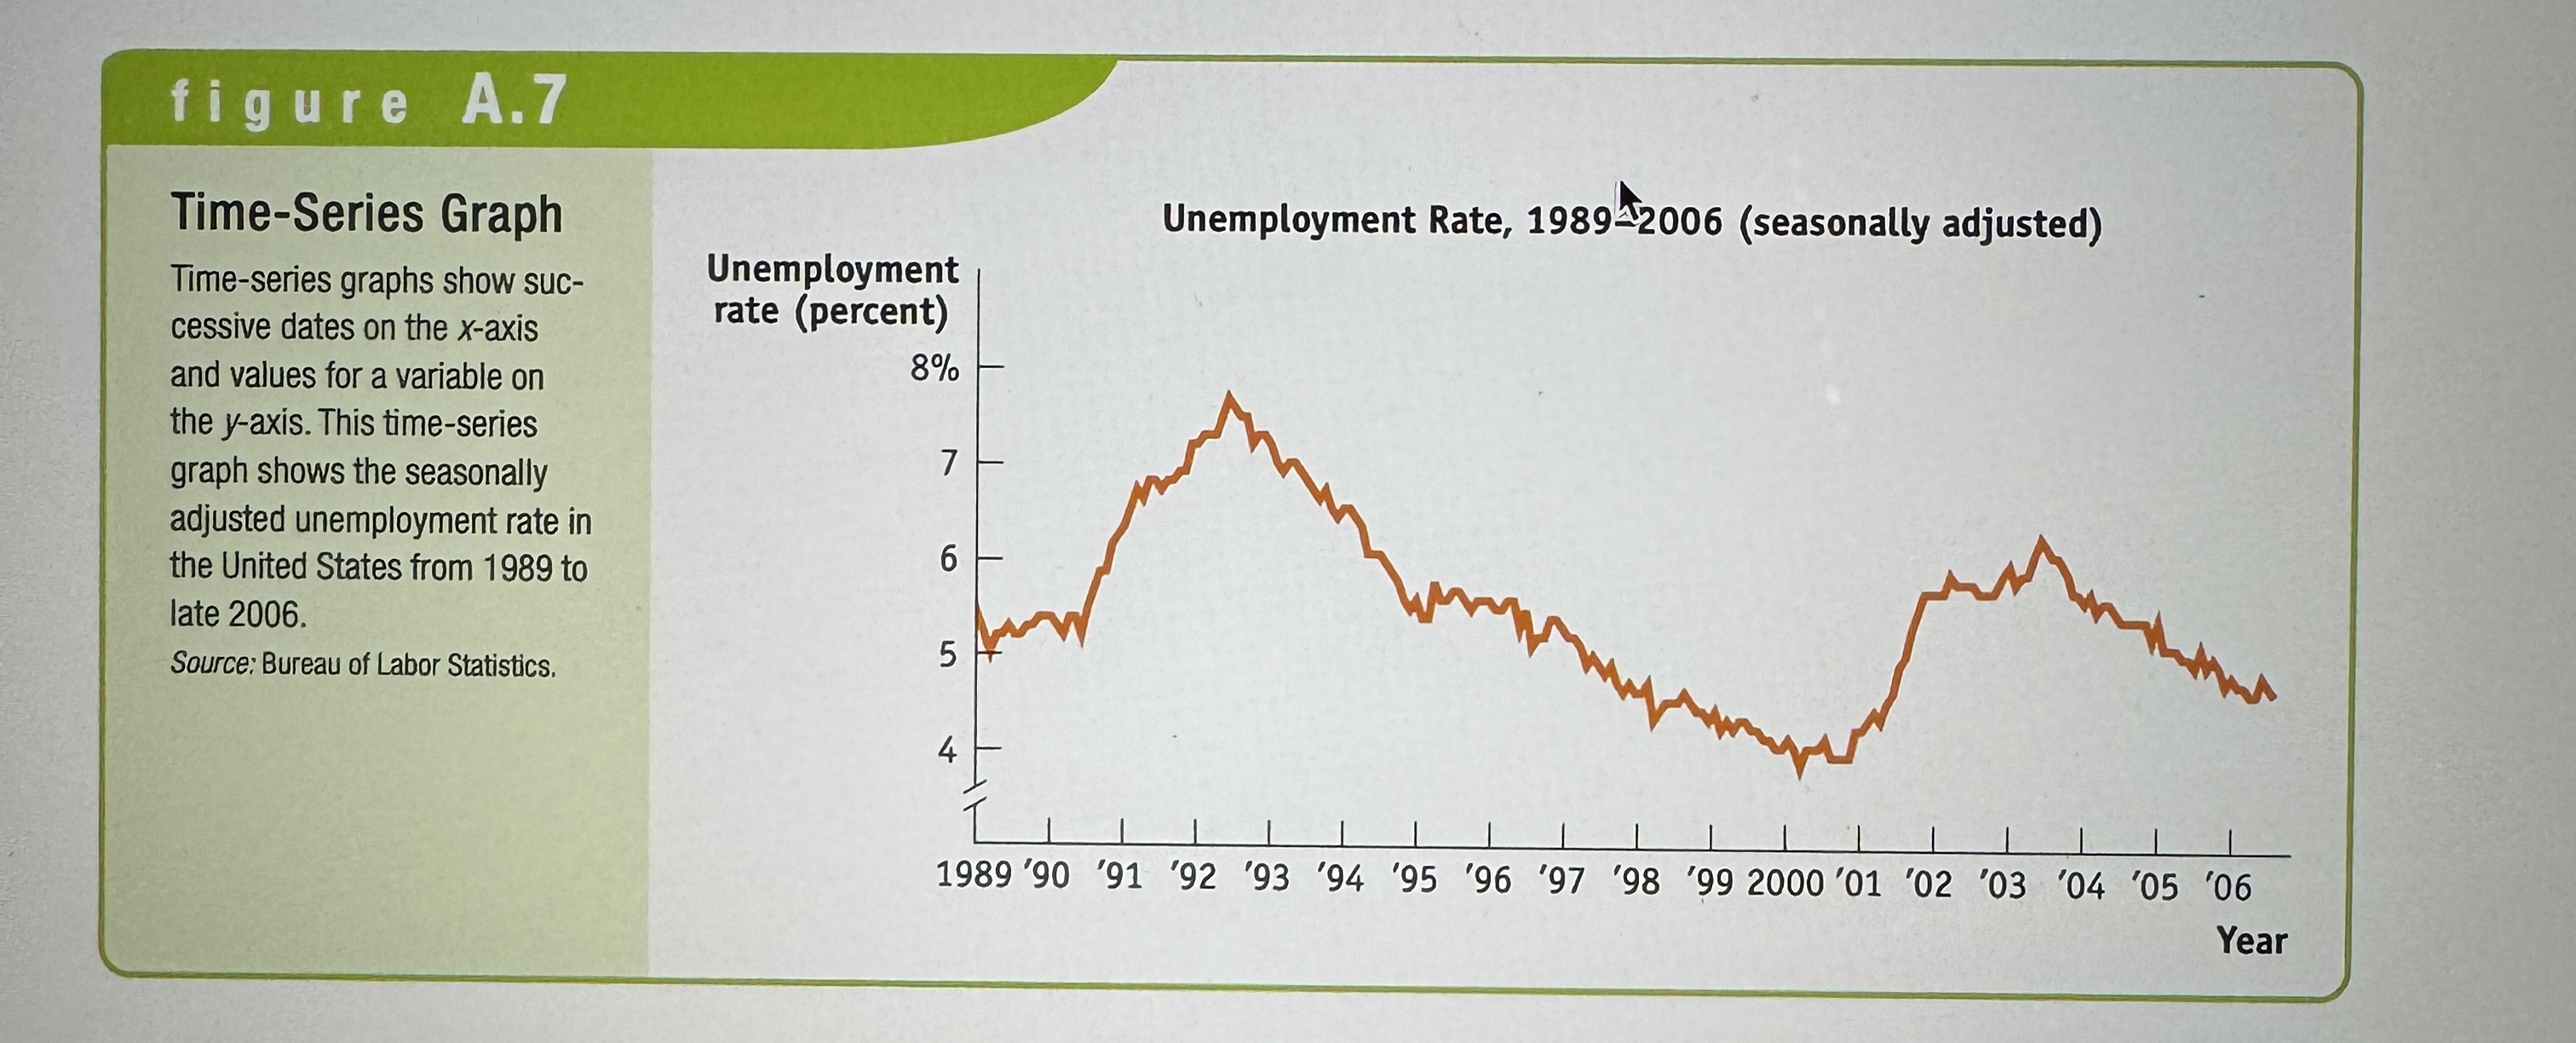
Time-series Graphs
Ex.
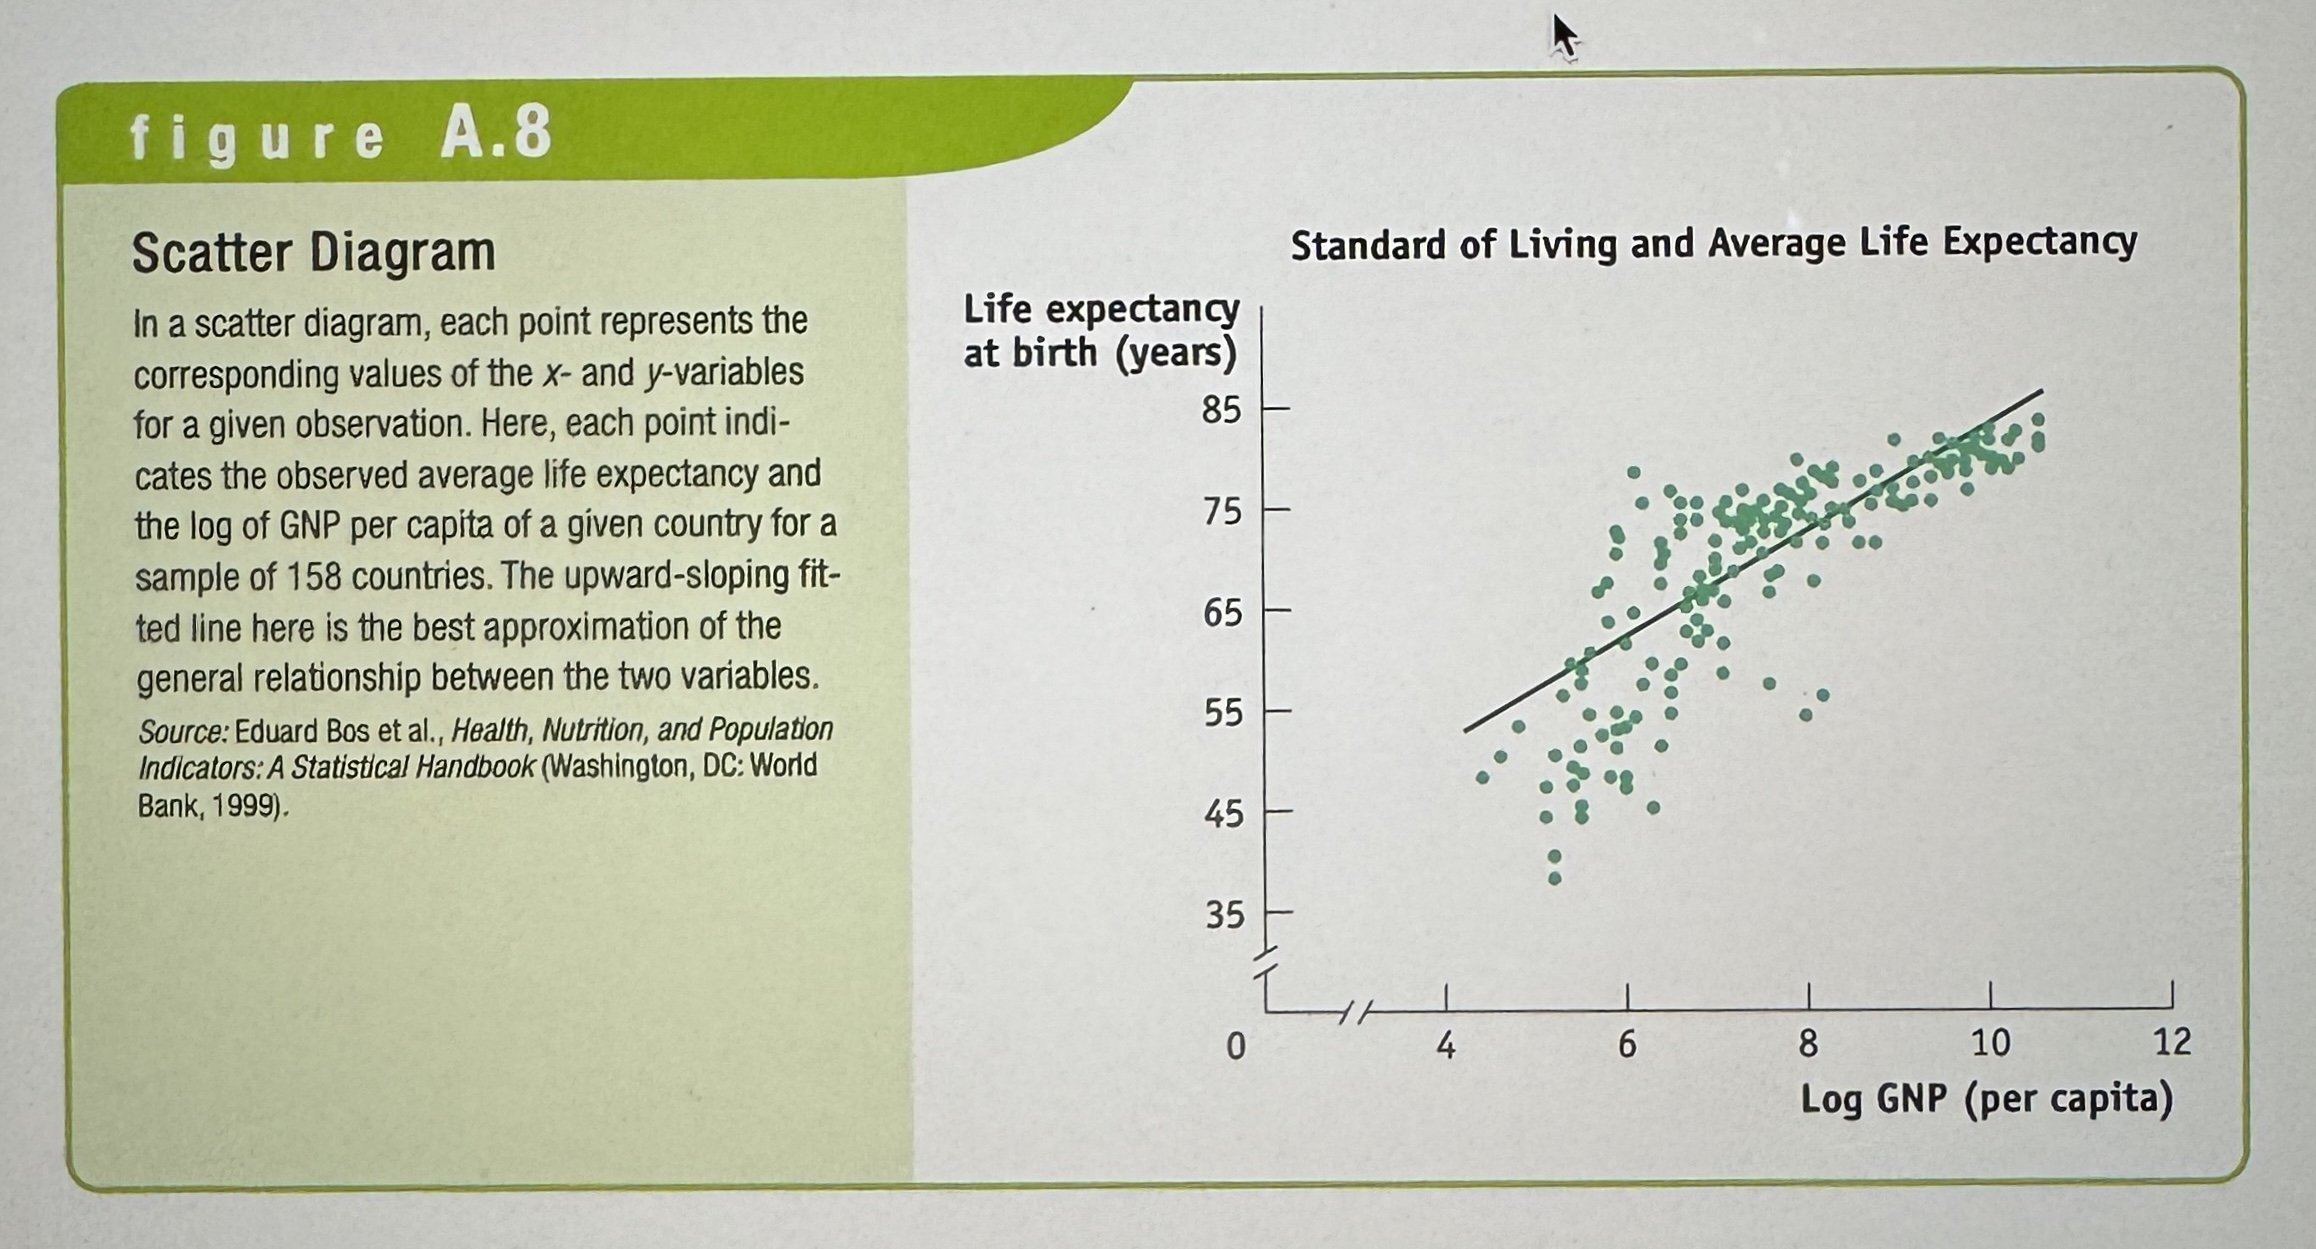
Scatter Diagrams
Ex.
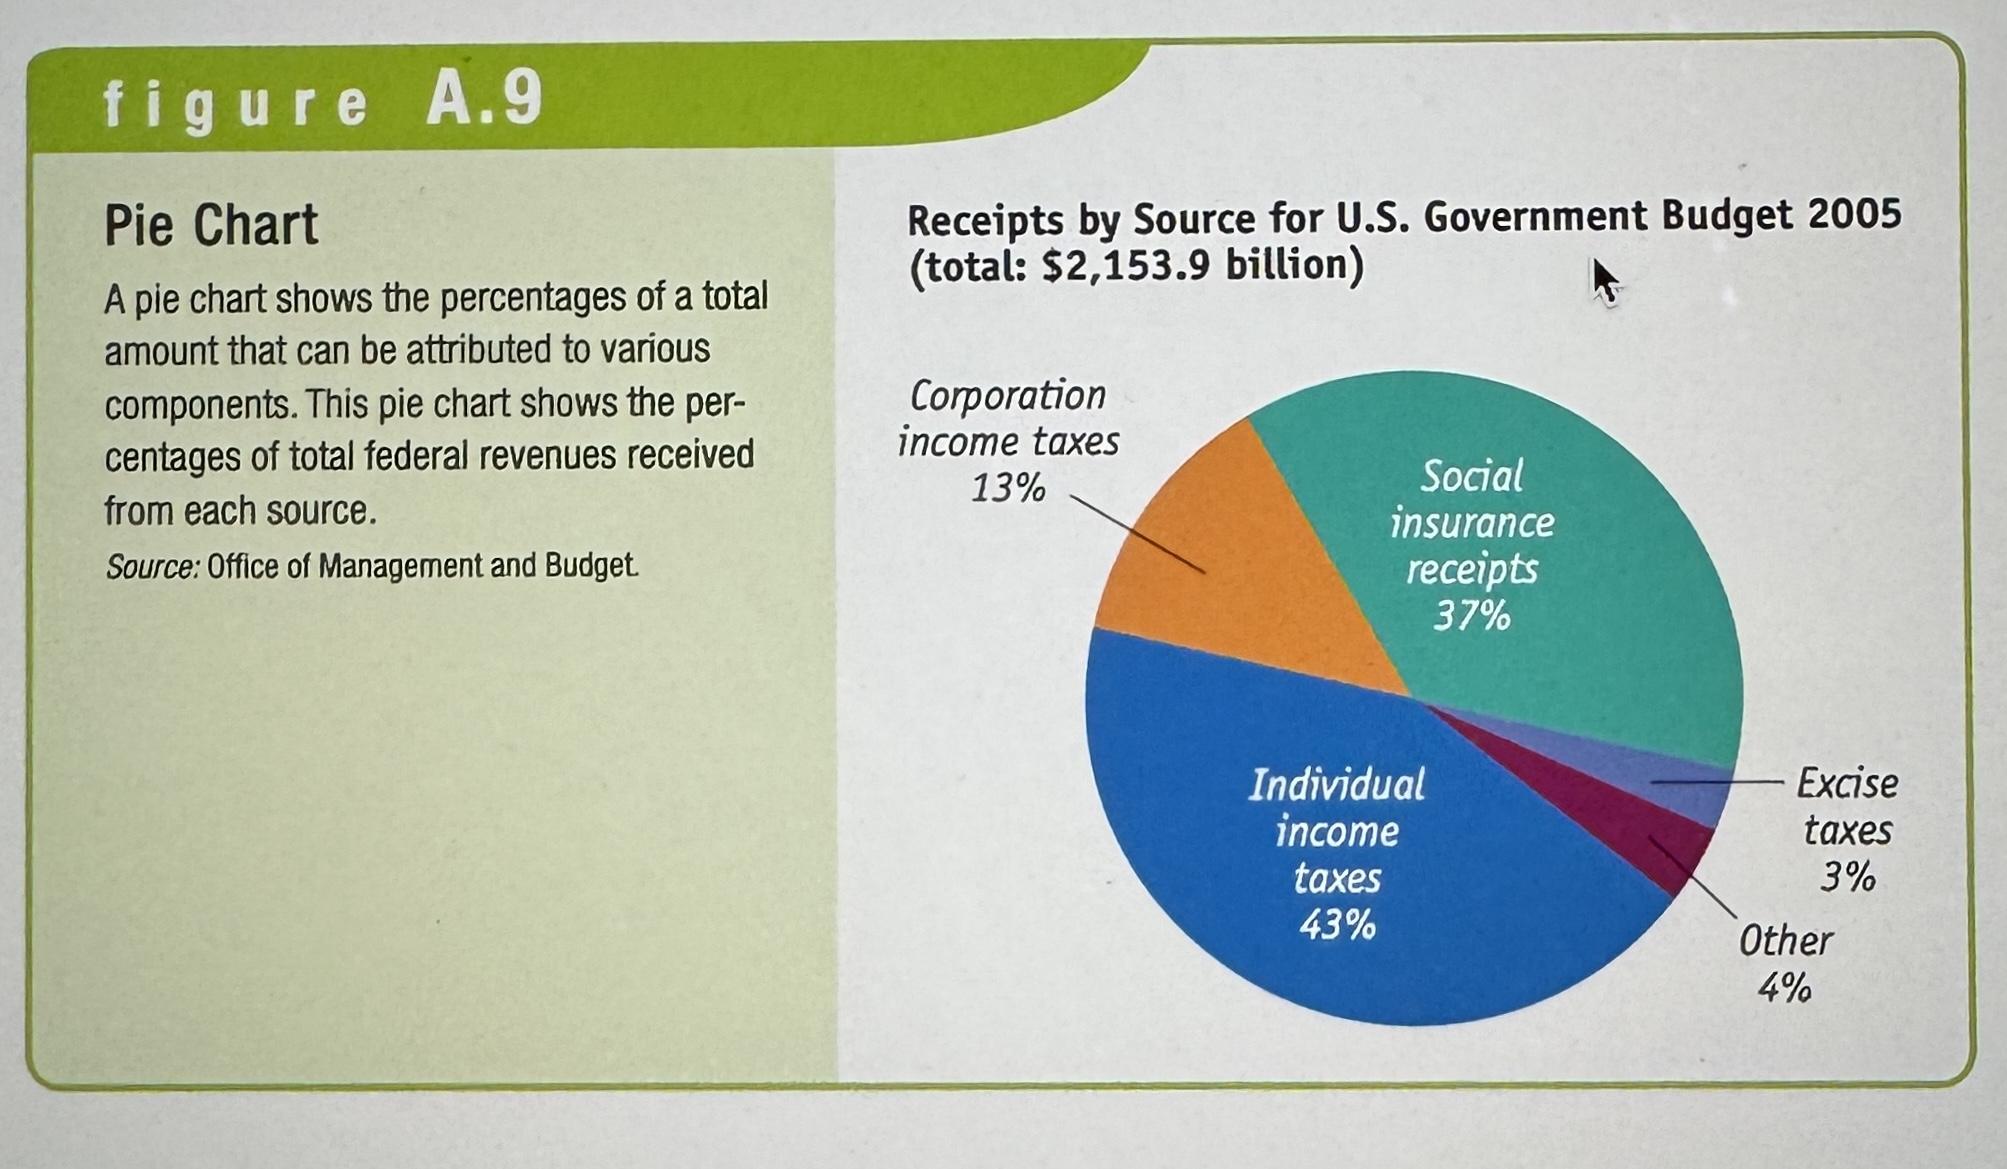
Pie Charts
Ex.
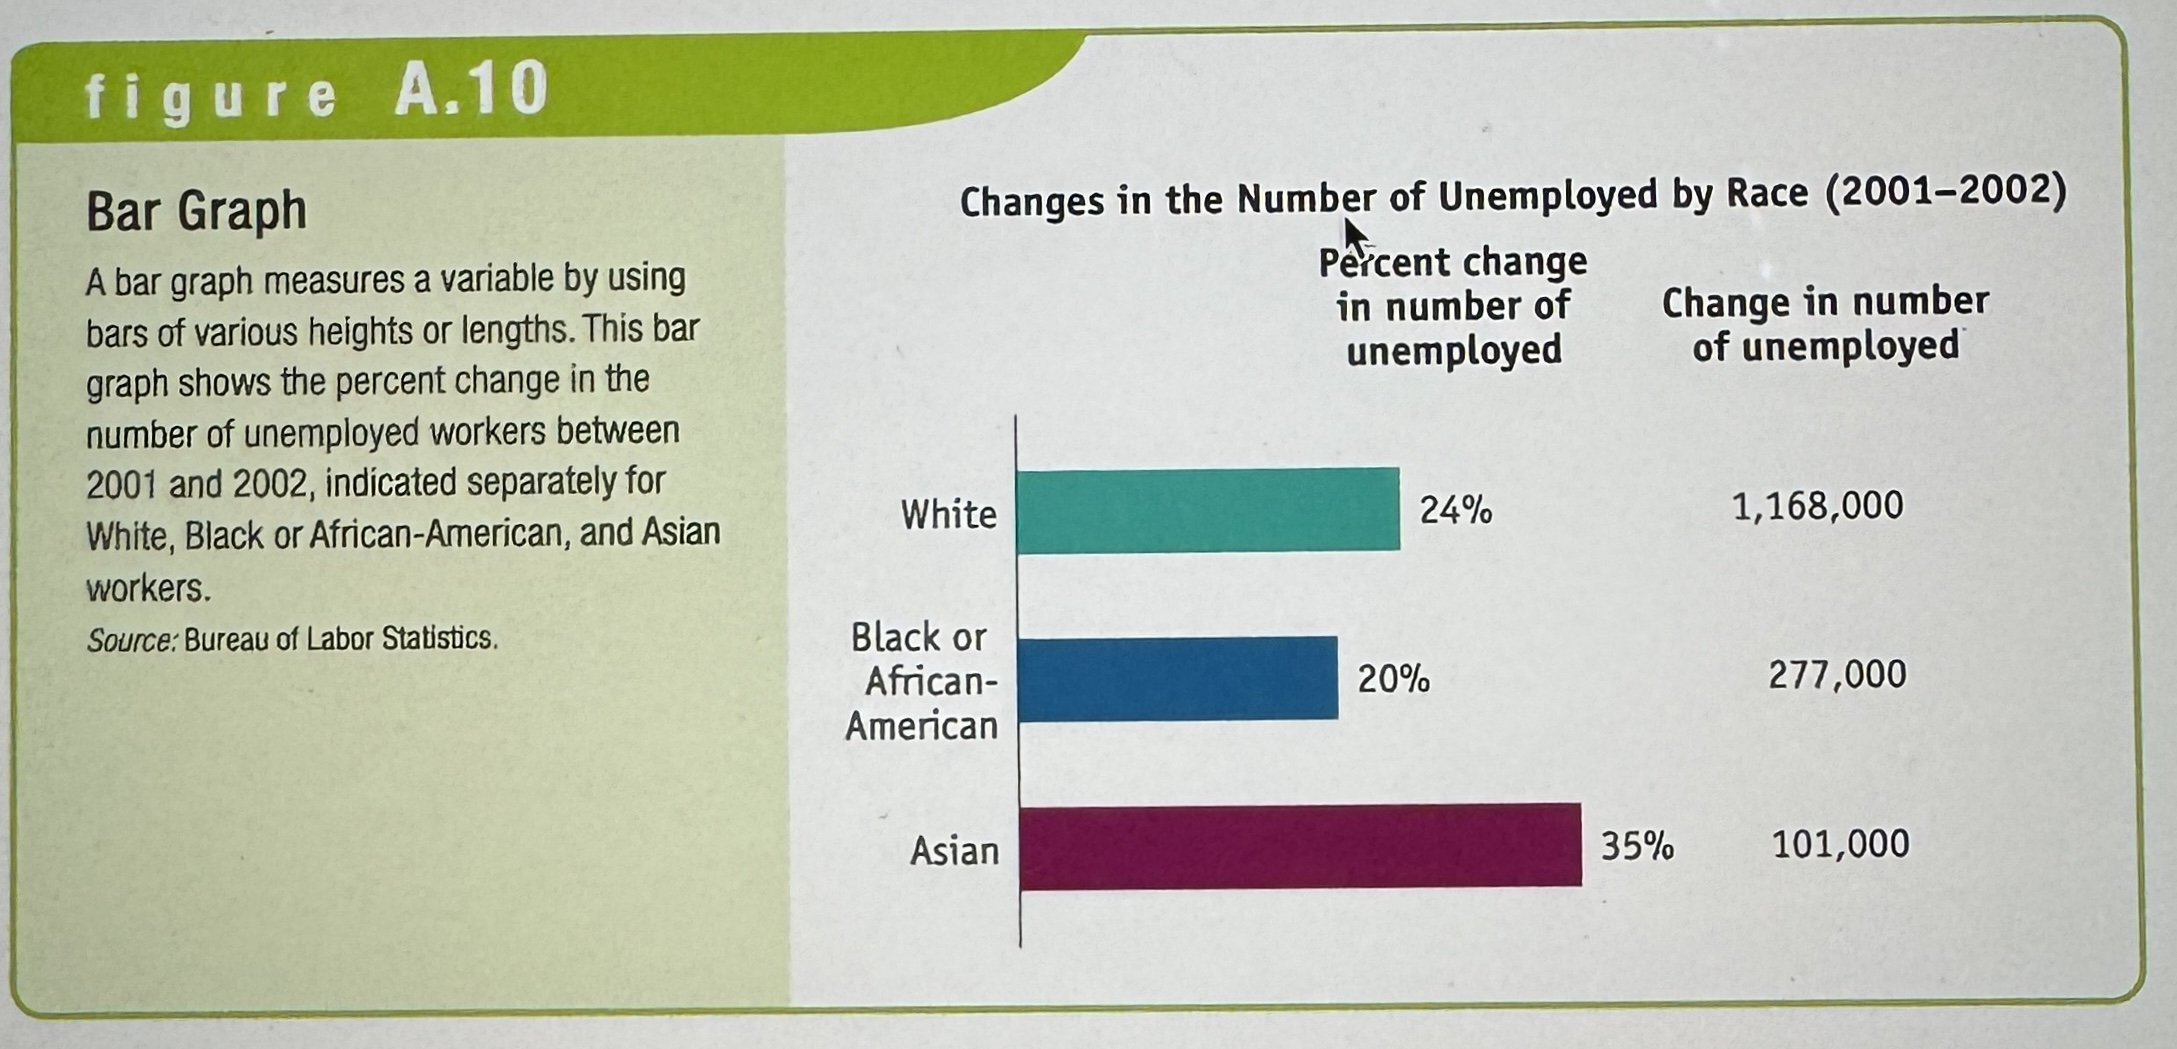
Bar Graphs
Ex.