Unit 5 - random variables
1/34
There's no tags or description
Looks like no tags are added yet.
Name | Mastery | Learn | Test | Matching | Spaced | Call with Kai |
|---|
No study sessions yet.
35 Terms
Random variable
A numerical value whose value depends on the outcome of a chance experiment
Discrete vs. continuous random variable
Discrete: the variable is a set of possible integer values
ex: the number of cats = {0, 1, 2, 3}
Continuous: A set of possible values that includes an entire interval (within a certain range)
ex: how long it takes to bake = 0 ≤ X ≤ 100
Probability distribution of random variable
Add to 1
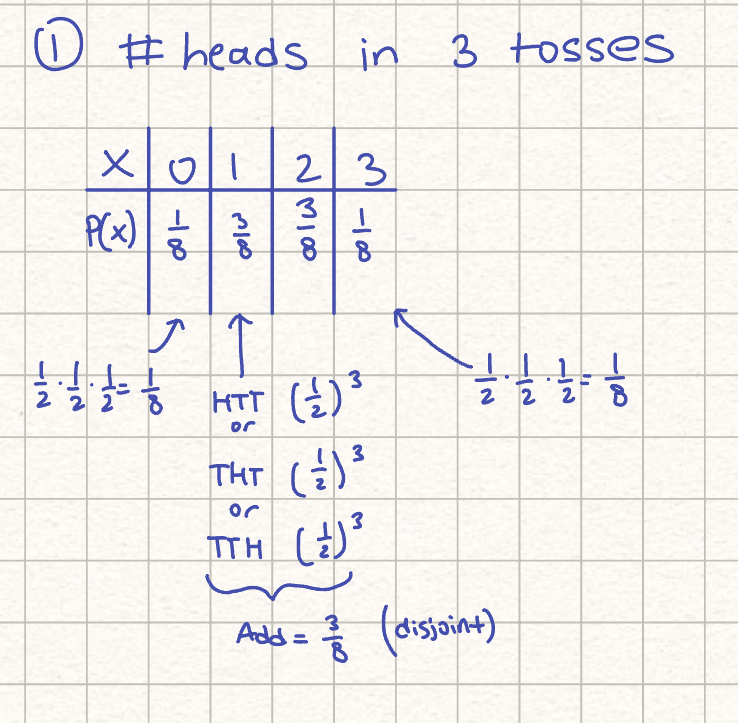
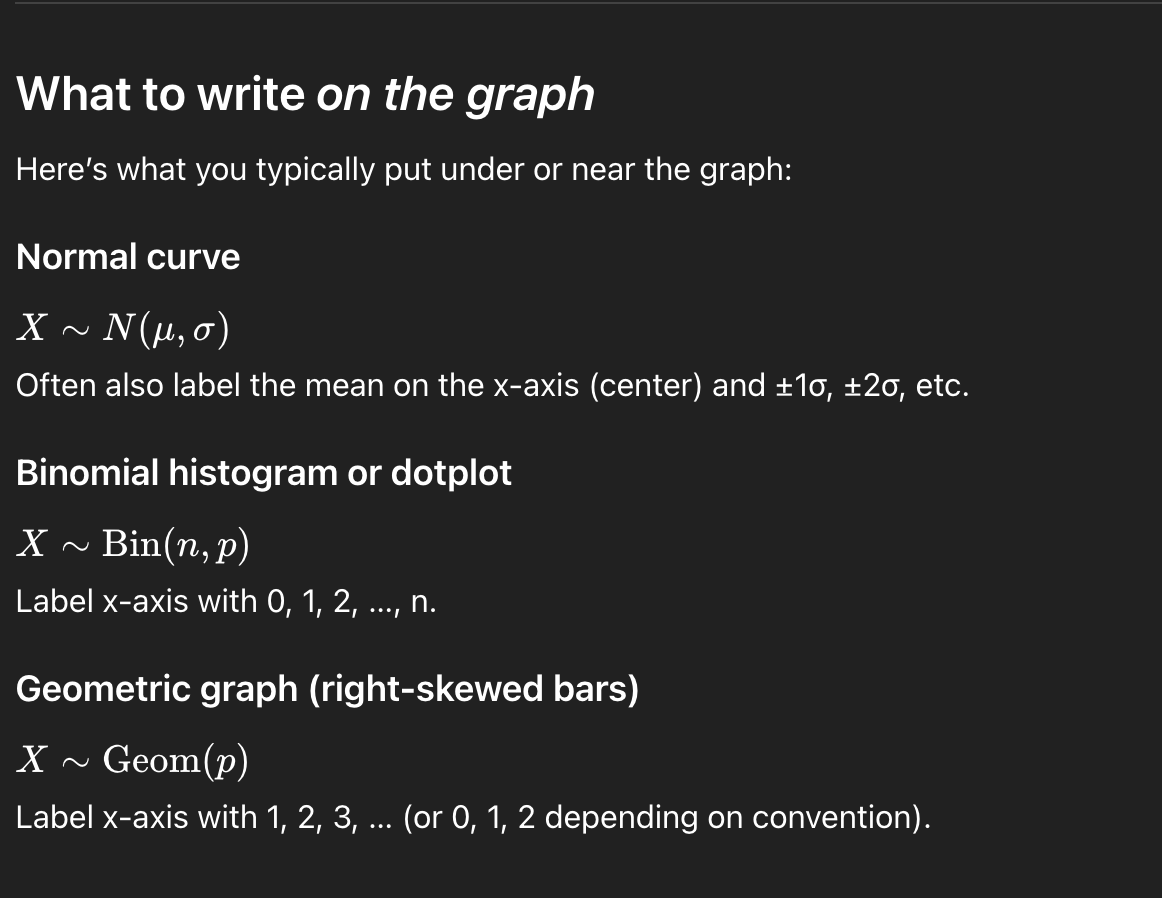
Probability histogram
P(1 ≤ X ≤ 3) ≠ P(1 < X < 3)
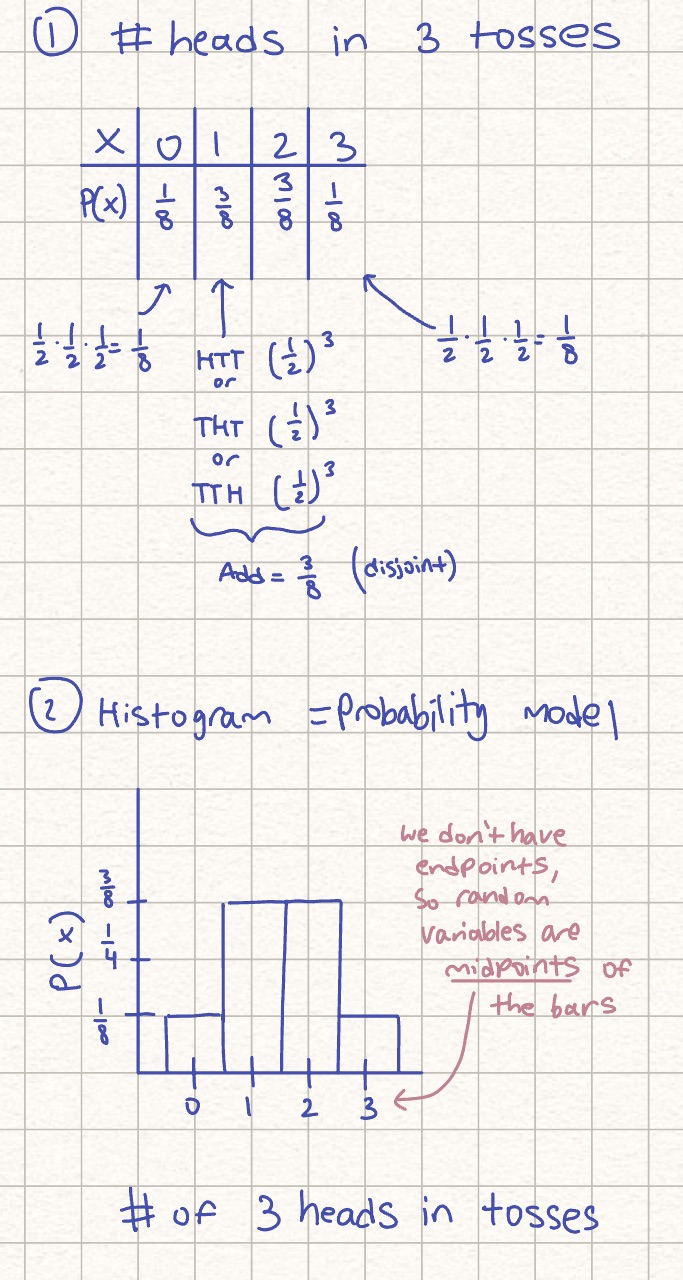
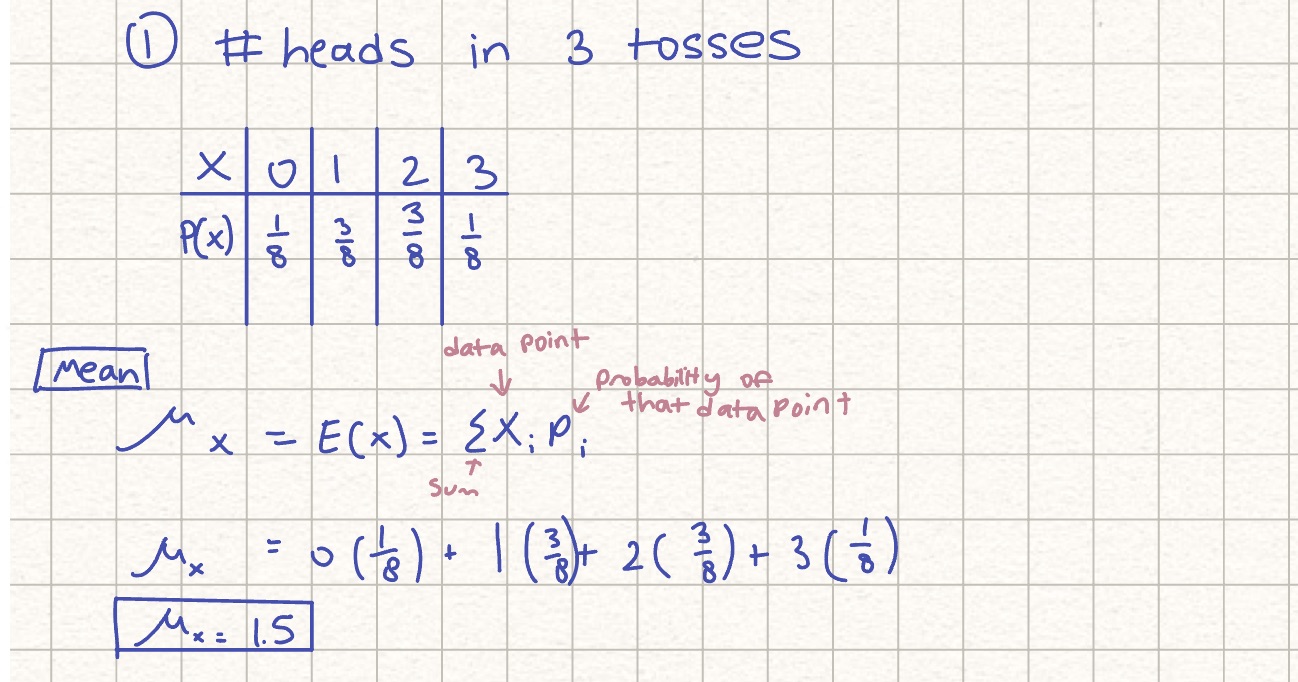
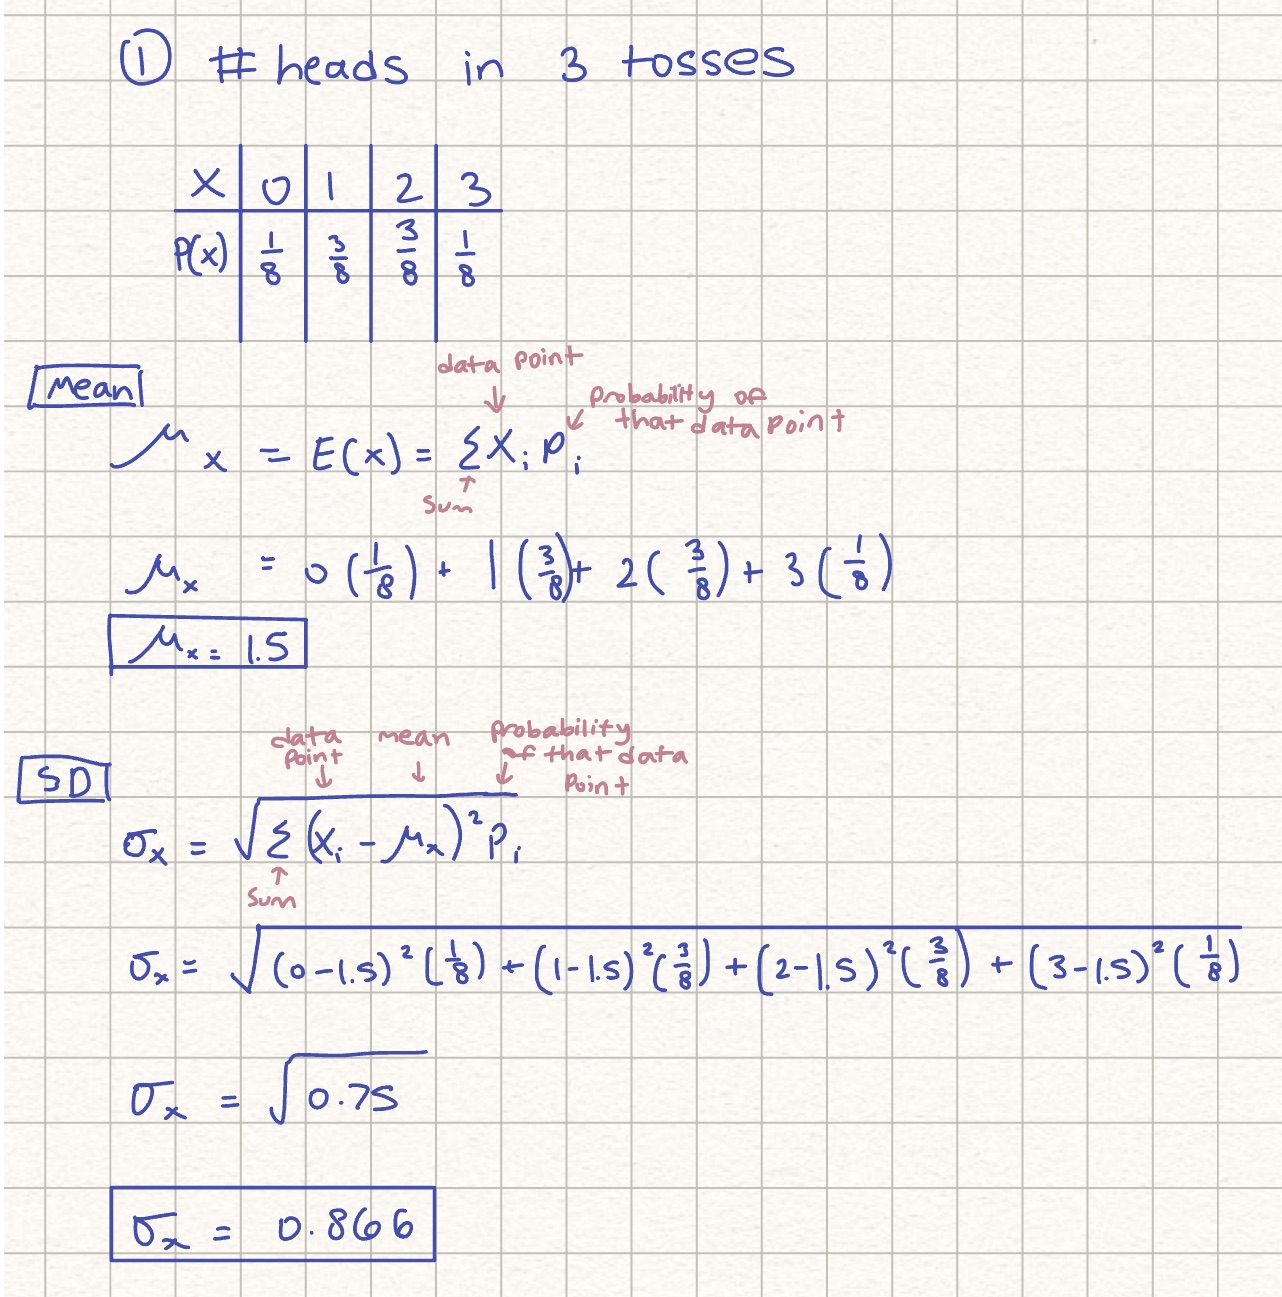
Expected value of random variable [by hand]
Expected value = mean
Standard deviation of random variable [by hand]
Mean & SD of random variable [calculator]
Go to list
Enter random variables in L1
Enter probabilities in L2
Stat → 1vars
Set list: L1
FreqList: L2
What happens to mean/SD/variance when adding/subtracting?
Measures of position change, measures of spread do not
What happens to mean/SD/variance when multiplying/dividing?
Both measures of position and spread change
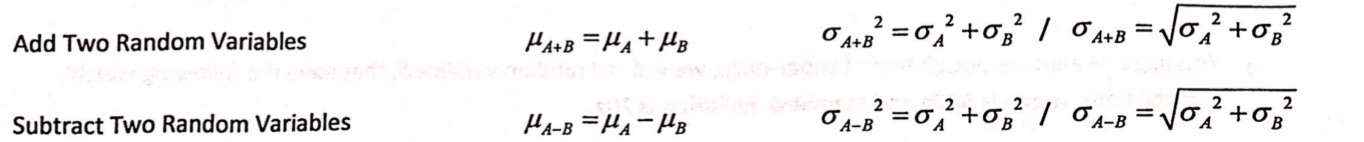
Adding or subtracting random variables
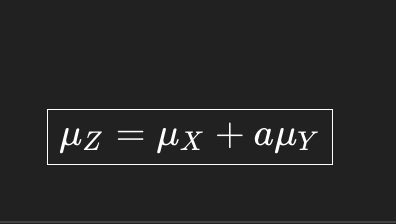
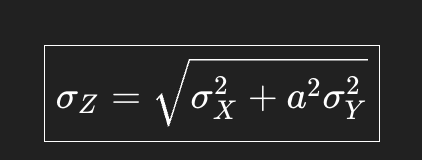
Adding random variables, one of them is multiplied by a constant
How to normal distribution combining variables
Combine mean and standard deviation
Make a new graph with new mean and standard deviation
Conditions for a binomial setting
Binary = either a success or failure
Independent
Number = the number of trials n of the chance process must be fixed
Success = on each trial, the probability p of success must be the same
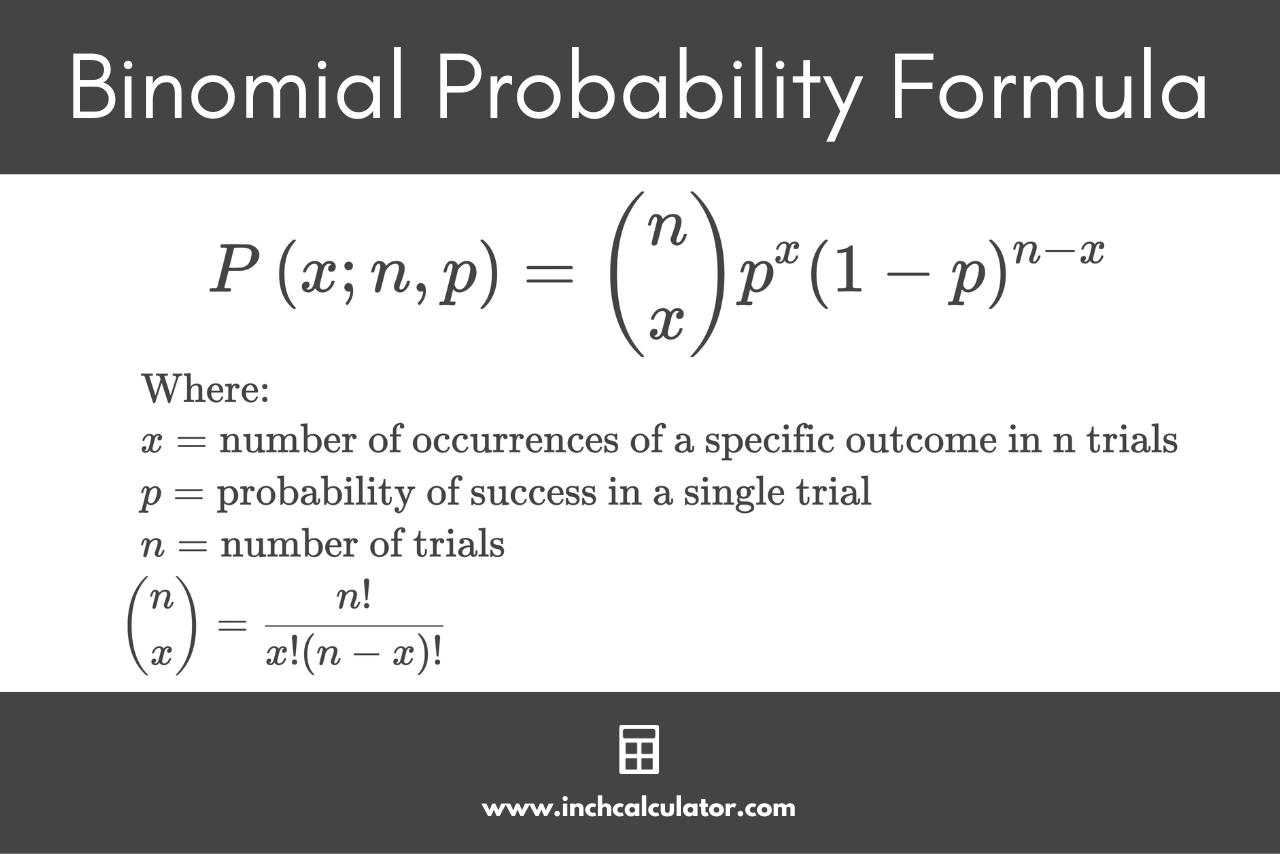
Binomial formula
How to do (n/x) combination:
n → math → prob → nCr → x = answer
binompdf (n, p, x)
Finds the probability of getting an exact value out of n trials with probability p
binomcdf(n, p, x)
Finds the probability of getting a value [at most X times / X times or less] out of n trials with probability p
Even though the probability of exactly 7 successes is tiny, the cumulative probability up to 7 includes all possible outcomes 0,1,2,…,70, 1, 2, …, 70,1,2,…,7, so it must add up to 1.
“The probability of having a cat is 0.3 What is the probability that exactly 5 people, out of 10, will have a cat.”
binompdf(10, 0.3, 5)
“The probability of having a cat is 0.3 What is the probability that at most 5 people, out of 10, will have a cat.”
binomcdf(10, 0.3, 5)
“The probability of having a cat is 0.3 What is the probability that between 4 and 7 people (inclusive), will have a cat.”
binomcdf(10, 0.3, 7) - binomcdf(10, 0.3, 3)
“The probability of having a cat is 0.3 What is the probability at least 5 out of 10 people will have a cat.”
1 - binomcdf(10, 0.3, 4)
You do 1 - (…) because the calculator only does X OR LESS. It cannot count up
Also you do 4 instead of 5 bc binom function is inclusive
Under what conditions is a normal distribution a good approximation to the binomial distribution?
np ≥ 10
n(1-p) ≥ 10
And in your sentence you have to say “therefore, using a normal distribution to approximate this binomial distrubition for this problem…”
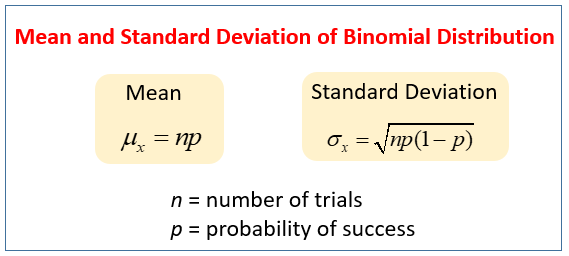
How to find mean and standard deviation of binary distribution
What is a geometric setting
A geometric setting arises when we perform independent trials of the same chance process and record the number of trials until the first success
Conditions for a geometric distribution
BITS
B = binary (success or fail)
I = independent
T = stops after a success
S = on each trial, the probability p of success stays constant
Rule for calculating geometric probabilities
P(X = n) = p(1 - p)n-1
This is essentially the multiplication rule; imagine landing on 5 for the first time on the 3rd roll of the die
(5/6)(5/6)(1/6) → multiplication rule!
The probability that it takes more than n trials to see the first success P(X > n)
P(X > n) = (1 - p)n
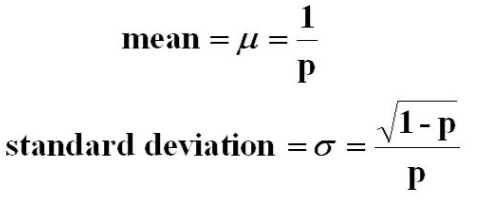
Mean and SD for geometric distribution
geometpdf(.5, 3)
What is the probability that a success (0.5 chance) occurs on exactly the 3rd trial
geometcdf(0.5, 3)
What is the probability that a success (0.5 chance) occurs on the 3rd or before
In a geometric distribution, which trial has the highest probability of success?
The first, since with each trial you are multiplying by a number < 1
Compare the shapes of the graphs of binomial distributions vs. geometric distributions
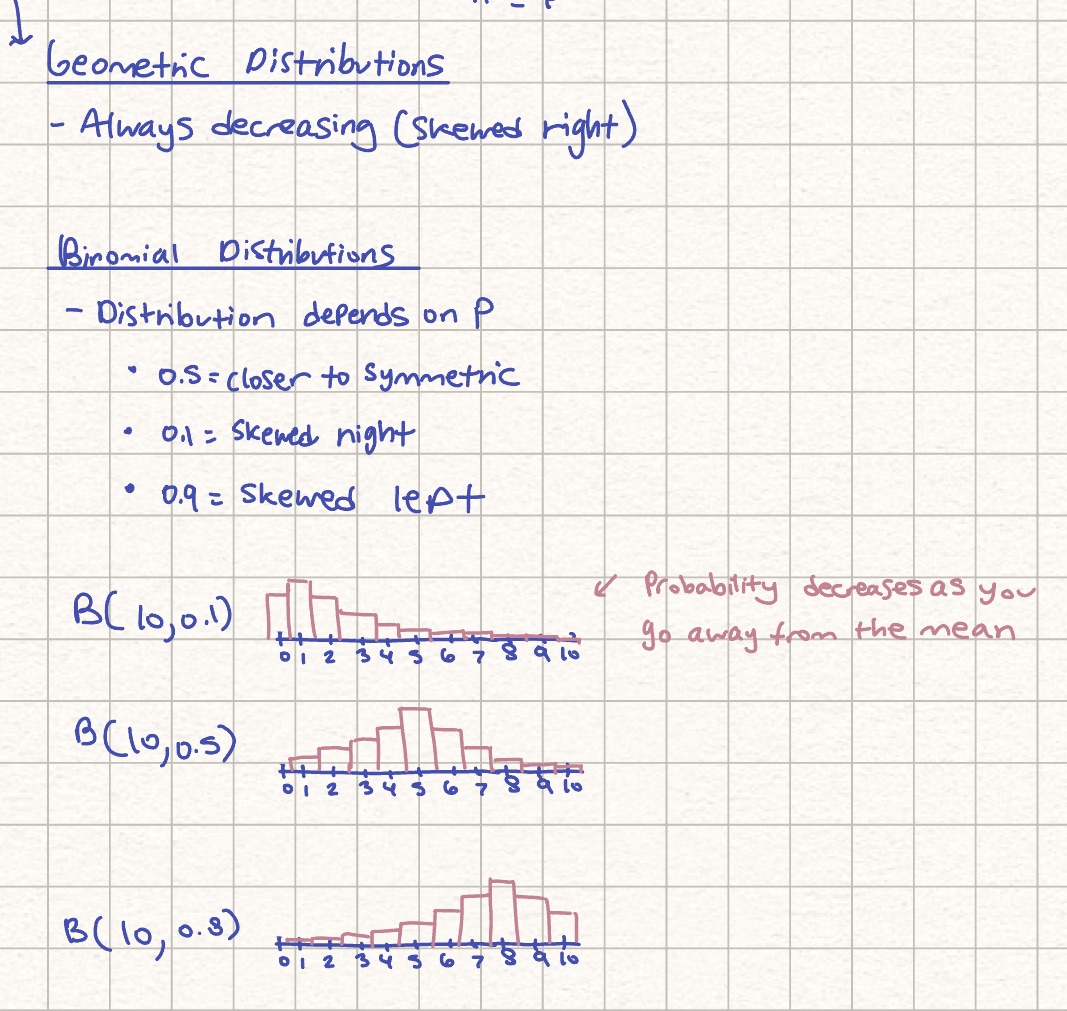
Identifying each distribution
excepts it’s just B and G