MLS 220 - Exam 3
1/105
There's no tags or description
Looks like no tags are added yet.
Name | Mastery | Learn | Test | Matching | Spaced |
|---|
No study sessions yet.
106 Terms
Three phases of total testing process
1. Pre-Analytical
2. Analytical
3. Post-Analytical
Pre-analytical
-prior to testing
-most errors
-examples: test ordering, phlebotomy, specimen collection, sample labeling, checking patient identifiers (need at least 2)
Analytical phase
-testing sample
-least errors, less opportunity for human error due to automation
Post-Analytical Phase
-after testing is completed
-examples of errors: manual result entry, test result interpretation
Quality Assurance (QA)
Policies, procedures, and practices necessary to make sure that a laboratory's results are reliable
QA examples include
-record keeping
-calibration and maintenance of equipment
-quality control
-proficiency testing
-training
QA Program
-Plan to carry out policies and practices necessary to comply with QA standards set by accreditation agencies
-CLIA requirement
-evaluate entirety of the TTP
Define Delta checks
-checks difference between most
Current result and previous results
When will you get a delta check?
If there's a change between past 2-3 results that exceed a specified cutoff
Proficiency Testing (PT)
-CLIA requirement
-program enrollment: CAP, CDC, some state health departments
Quality Control
-Analytical phase of Total Testing Process (TTP)
Goal of Quality Control
-detecting and correcting errors, alert analyst when there may be potential problem with a testing procedure
-generate high-quality results that are accurate, precise, and reliable
Two types of quality control
Internal QC
And External QC
Internal QC (statistical)
Evaluated the daily precision of an assay to make sure it's working
External QC
Evaluated the accuracy of an assay measurements
-submission of internal QC results and specified control specimens
-proficiency testing
QC Errors include
1. Systematic
2. Random
Systematic error (inaccurate)
-Caused by the same factor producing reproducible errors in one direction from the true value
-can be detected and corrected
-causes inaccurate assay results
-results are inaccurate by the same amount
Ex: instrument calibrated incorrect
Random Error (imprecise)
1. Caused by an accident that can be difficult to identify
2. Causes imprecision of results
3. Not reproducible
Ex: inaccurate pipetting
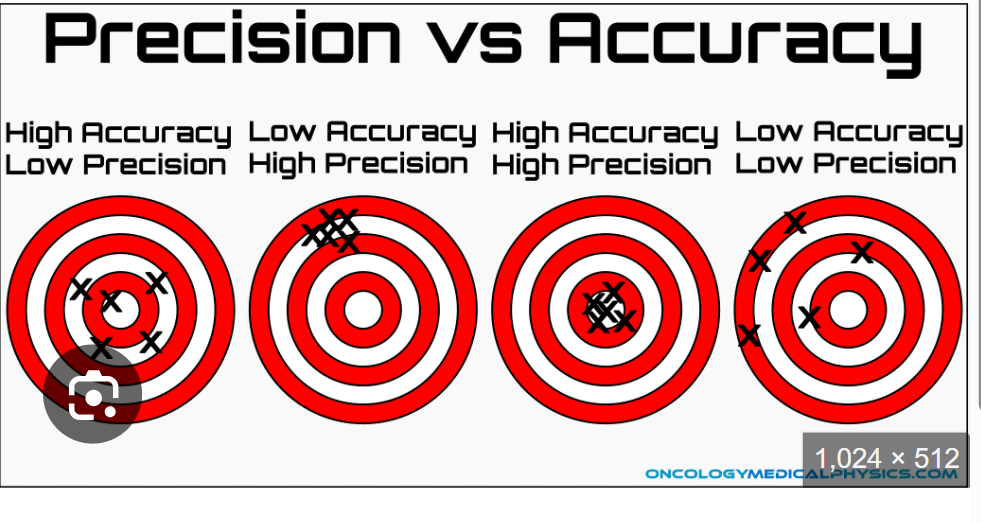
Define accuracy
-the closeness of the result obtained to the true or actual value
-how close we are to the center of that bulls eye, how good we are getting that target
Define Precision
-repeatability or reproducibility in obtaining the same value in subsequent tests in the same sample
-how good we are at shooting and same spot repeatedly
Accuracy in lab
1. Standardize Procedures
2. Comparing new methods vs old methods
3. Use of controls (sample with known values)
Precision in the lab
1. Proper inclusion of standards/reference samples
2.valid replicate determinations of a single sample
3. Duplicate determination of sufficient numbers of unknown samples
4. Day-to-day and between-run precision assessed by inclusion of control specimens
Accuracy vs Precision
Calibration Standard
-highly purified substances of a known composition
-purchase from a manufacturer
-used to established reference points to construct graphs or a test result
Calibration curve
-Compares an instrument measurement/reading to a known concentration (standard)
-established before any testing is completed
Sensitivity
The proportion of cases having a specific disease or condition that gives a positive test result
Represents how much of a given substance is measured
-the more sensitive the test the smaller amount of assayed substance is measured
Specificity
The proportion of cases with a sense of a specific disease or condition that gives a negative result
Represent what is being measured
-the more specific the tests, the smaller number of analytes being measured
-the test only measure the specific
Analyte in question
Positive predictive value
Indicates the number of patients with an abnormal test result who have the disease compared with all patients with an abnormal result
Negative predictive value
Indicates the number of patients with a normal test result who do not have the disease, compared with all patients with a normal (negative) test result
PPV
True positives/ (true positives+false positives)
NPV
True negative/ (True Negatives+False Negatives)
Standard deviation
Measure of the spread, or variability in a data set
Precision -> how good are we hitting that mean every single time we run test
When is standard deviation used to determine?
Reference range +/- 2 SD
Coefficient of variation
Calculate the SD as a "percent of mean"
When is CV useful?
When comparing two or more groups of data to determine which has the greater precision
- the lower the CV, the higher the precision
How is acceptable range calculated?
-Run level 1 control sample daily for 15-25 days
-treat QC material exactly like a patient
-calculate mean and SD
-acceptable QC ranges will be +/- 2SD. 95% of results should fall within the acceptable range.
Mean - (+/-)SD
Level-Jennings chart
Daily results plotted onto graphical representation
-manual vs. automated
-automated warning limits: +/- 2 or +/-3 SD
Levey-Jennings chart terms include
-shift
-trend
-dispersion
Define shift
Sudden and sustained change in one direction in control sample values
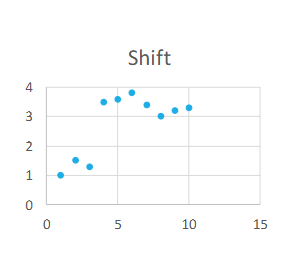
Shift causes
Sudden malfunction with instrumentation, QC contamination, etc.
Define Trend (aka Drift)
Gradual change in the control sample
Results
Control value direction moves progressively in one direction from the mean for at least 3 days
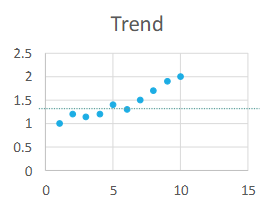
Trend causes:
Deterioration of reagents, control, or instrument (ex. a lamp starting to go out)
Define Dispersion
When random error or
Lack of precision increases
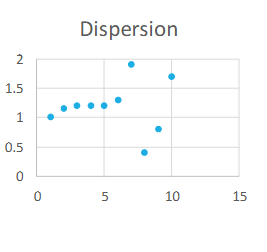
Dispersion causes:
Instability problems with instrumentation
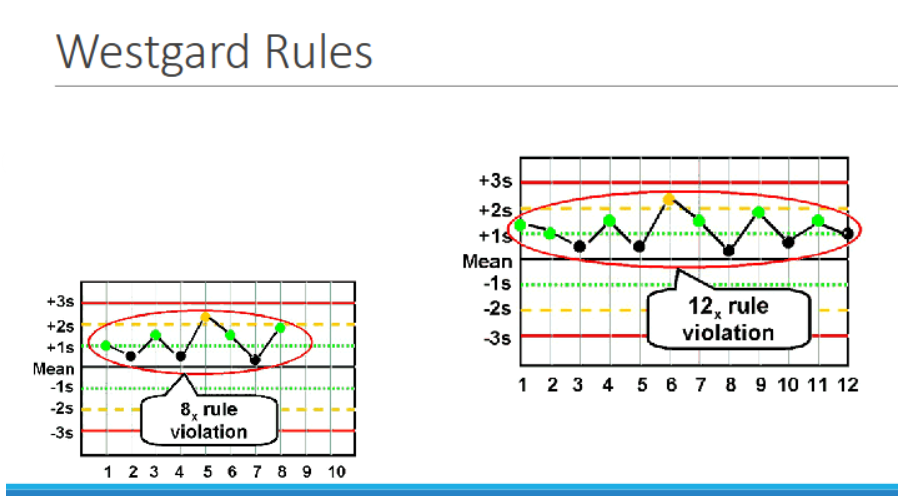
Westward Rules
-Rules formulated to analyze data in control charts based on statistical methods
-define performance limits for a particular assay
-detect random and systematic error
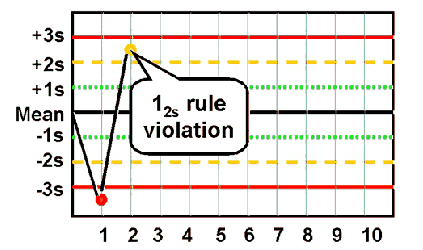
12s
Violated when one or the two control results fall outside of ±2 SD
◦ Warning rule – lets you know of a possible problem with control data
◦ Specimens not rejected
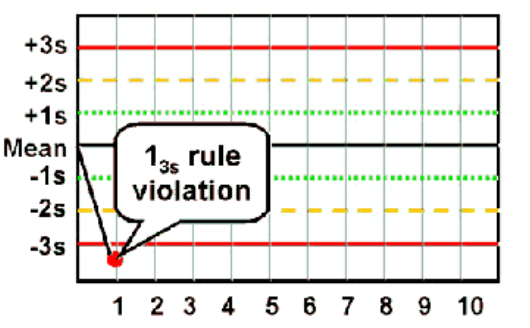
13s
Violated when any QC result falls outside of ±3 SD
◦ Random error
◦ Beginning of larger systematic error?
22S
Violated when 2 consecutive control values for the same side fall outside of ±2 SD in the same direction, or when both control levels in the same test batch exceed
±2 SD
◦
Detects systematic error (only)
**Patient results cannot be reported**
◦ Requires immediate corrective action
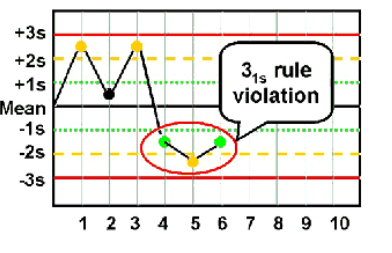
31s
Violated when 3 consecutive control results are greater than 1SD on the same side of the mean
◦ Within one level of control, indicates systematic bias
◦ Across control levels, indicates systematic error over broader range of
concentrations
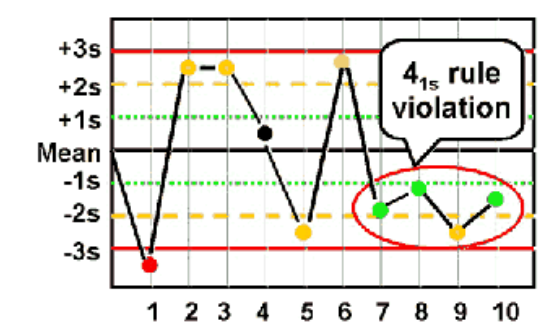
41S
Violated when four consecutive control results are greater than 1 SD and
on the same side of the mean
◦ Within one level of control, indicates systematic bias
◦ Across control levels, indicates systematic error over broader range of concentrations
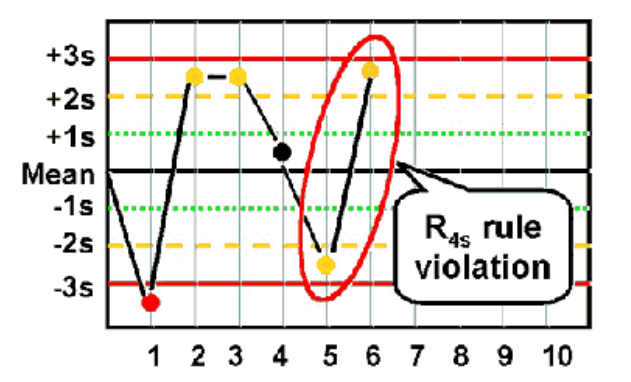
R4S
Violated when One Control Measurement exceeds the +2 SD and the other exceeds the -2 SD control limit
◦ Must be interpreted within a run, not between runs
◦ 4 SD difference
◦ Random error
**Patient results cannot be reported **
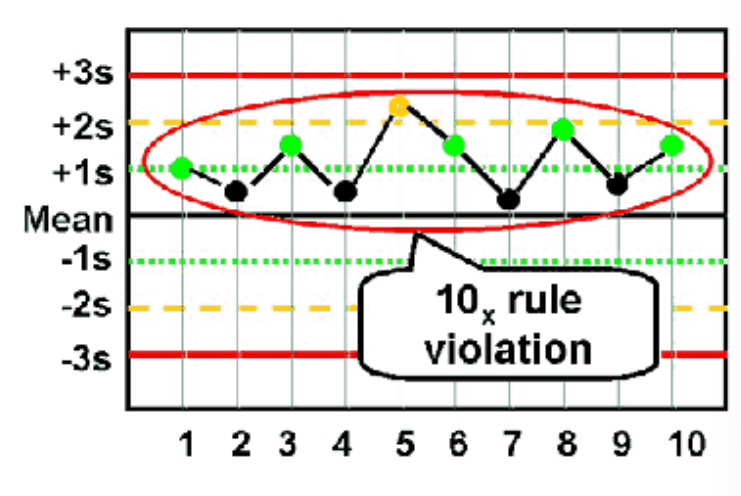
10X
Violated when 10 consecutive QC results for one level of assay control are
on one side of the mean OR both levels of control have five consecutive results
that are on the same side of the mean
**Patient results cannot be reported **
NX
violated when 7, 8, 9, 10, or 12 control results are on the same side of the mean
◦ Within one level of control → indicates systematic bias
◦ Across control levels → indicates systematic error
Multi-Rule QC
• Uses multiple rules in tandem
• Decreases chance of false rejection
• 13𝑠 and 𝑅4𝑠 → detect random error
• 22𝑠 and 41𝑠 and 10x → detect systematic error
No analytical Factors in Quality Assessment
1. Qualified Personnel
2. Established Laboratory Policies
3. Laboratory Procedure Manual
4. Testing Requisitioning
5. Patient identification,
Specimen procurement, and labeling
6. Proper Procedures for specimen collection and storage
7. Specimen transportation and processing
8. Preventative maintenance of equipment
9. Appropriate Methodology
Test Requisitioning
• Laboratory test requested by physician
• Electronic or paper
• Must include…
Patient identification data
Time and date of specimen collection
Specimen Source
Tests to be completed
• Information on specimen must match information on test
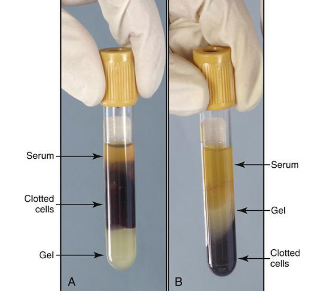
Serum
Liquid portion of blood from a sample that has clotted
Plasma
Liquid portion of blood from a sample that has not clotted
PlasmAnticoagulant
What does anticoagulants do?
Chelating (binding) or precipitating calcium (calcium needed for coagulation process)
Inhibiting the formation of thrombin
Under filled tube
More anticoagulant than blood-> clotting of blood is prolonged
Over filled tube
More blood than anticoagulant -> clot faster
Anticoagulants include
1. EDTA
2. Citrate
3. Heparin
4 Oxalate
5. Special-Use
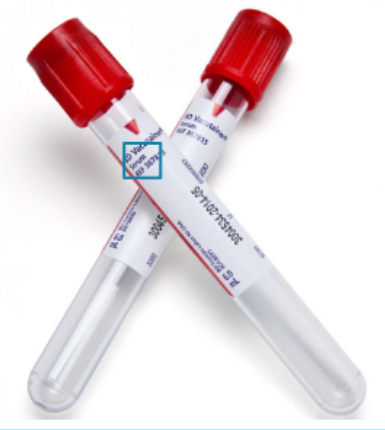
Red Top Tubes
• “Plain” or silica coated
• Serum as no anticoagulants present
EDTA (ethylenediaminetetraacetic acid)mechanism of action
Removed ionized calcium through chelation.
Forms calcium salt
Pink or Purple Tubes
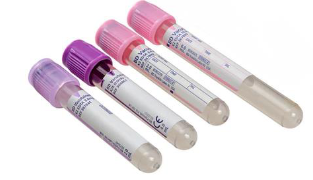
Common EDTA test
•Common Tests → Hematology
-complete blood count (CBC)
-erythrocyte Sedimentation Rate (ESR)
-blood type/antibody IDs and Screens
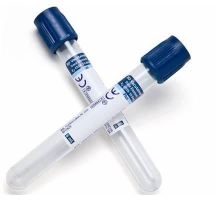
Citrate - Sodium Citrate
-Removes calcium by precipitating it into an unusable form
-9:1 ratio of blood to anti coagulant
Light Blue
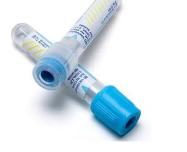
Citrate common test
Common Tests → Hemostasis
-prothrombin time (PT)
-activated partial thromboplastin time (aPTT)
-fibrinogen
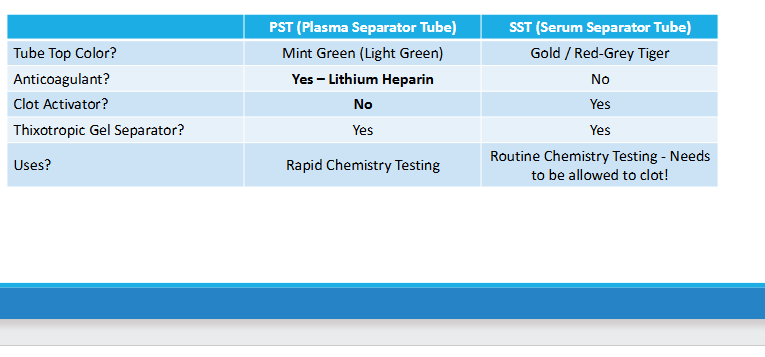
Heparin Cap Color
Lithium Heparin -> light/mint green (most common)
Sodium heparin -> dark green
Ammonia heparin (least common)
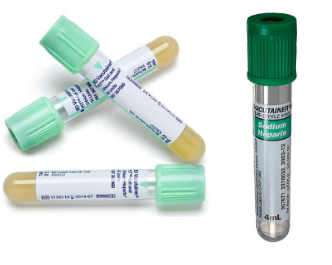
Heparin mechanism of action
-prevents thrombin formation
-interrupts clotting cascade
Heparin common test
Common Tests → Chemistry
Electrolytes
pH
Enzymes
Oxalate cap color
Gray
Precipitates calcium
Oxalate common test
Chemistry -> Glucose levels
Acid citrate dextrose cap color
- ACD
- yellow
•Mechanism of Action
Acid citrate binds calcium
•Common Tests
DNA Testing
HLA Typing
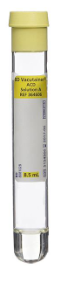
ACD mechanism of action
Binds calcium
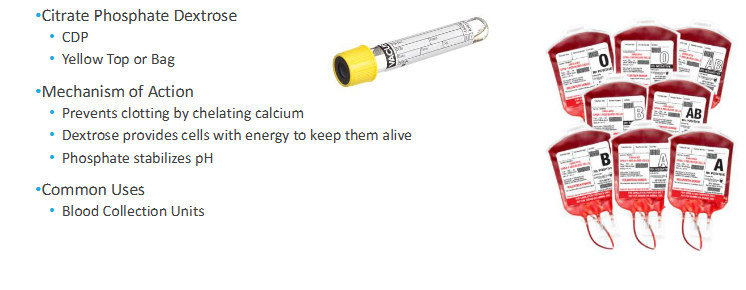
Citrate Phosphate Dextrose cap color
-CDP
-yellow top or bag
CDP mechanism of action
-binding calcium
-dextrose provides cells with energy to keep them alive
-phosphate stabilizes pH
CDP common uses
Blood collection units
Sodium polymers sulfonate (SPS)
-SPS
-yellow top
- binds calcium
- reduces complement -> allows bacteria to grow
- slows down phagocytosis
- reduces activity of certain antibiotics
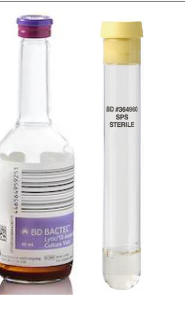
sodium polyanethol sulfonate does
Blood cultures
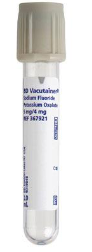
Antiglycolytic Agents
•Prevents glycolysis (breakdown of glucose by blood cells)
•Sodium Fluoride
•Preserves glucose for up to 3 days
•Commonly used with potassium oxalate
Clot Activators
Substance that enhances coagulation in tubes used to collect serum specimens
Clot activator cap color
Yellow, red, black and red
Clot activator mechanism of action
provide more surface for platelet activation
-glass (silica) Celite (inert clay)
thrombin
-clotting factor
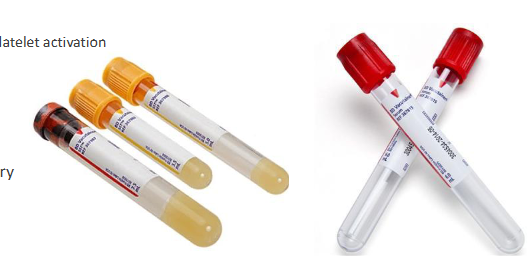
Common tests for clot activators
Chemistry
-BUN
-creative
-electrolytes
Gel separator
Thixotropic Gel
-density is between cells and serum/plasma
-provides physical barrier
Gel separator cap color
- gold evacuated tube (SST:serum separator tube)
- Mint evacuated tube (PST: Plasma separator tube)
Trace Element-Free Tubes
-royal blue top tubes (metal free)
Made of materials as free of trace element contamination as possible
•Trace elements (lead), toxicology studies, nutrient determination
After centrifugation 3 layers are
Formed
-plasma (liquid portion of blood that has been mixed with anticoagulant. 55% of total blood volume)
-Buffy coat: gray/white layer composed of white blood cells and platelets
-erythrocytes: RBC, 45% of total blood volume
Unacceptable Specimens
Potential Reasons for Unsatisfactory Specimens
• Incorrect tube/specimen container for sample or test
• Specimen is labeled incorrectly
• Tube is under/over filled
• Specimen not tested in timely manner
• Sample is hemolyzed
Two types of blood draws
Venipuncture
-vacutainer
-syringe method
-butterfly
Capillary stick
-finger
-heel
Venipuncture-vacutainer supplies
-gloves
-tourniquet
-alcohol wipe
-gauze
-tubes
-vacutainer needle
-vacutainer hub
-test/patient labels (order)
-bandage or coban wrap
Vacutainer needles
-the larger the number, the smaller the gauge
Ex: 21 G needle is smaller than s 18G needle
Vacutainer hub
-engineering control
-protects against accidental needle stick
-single use
Venipuncture-syringe method supplies
-gloves
-tourniquet
-alcohol wipe
-gauze
-tubes
-syringe needle or butterfly
-syringe
-transfer device
-test/patient labels (order)
-bandage or coban wrap
Venipuncture-butterfly method
-smaller gushed needle
-follow syringe method
-typically used for patient with small veins, elderly, children, or puncturing somewhere other than the arm (hand, foot, etc.)
Two preferred veins to use while performing venipuncture
Antecubital fossa (AC)
- in front of the elbow + "shallow depression"
Antecubital Veins
-H pattern->Median cubital vein (70%)
-M Pattern ->median basilic vein and median cephalic vein (30%)
Venipuncture general procedure
1. Introduction of phlebotomist and procedure
2. Patient identification
-two patient identifiers given verbally
3. Gather appropriate supplies
4. Perform hand hygiene, put on gloves
5. Apply tourniquet and find draw sites
6. Alcohol draw sites, allow to dry
7. Anchor the vein
8. Insert the needle, fill tubes
9. Release the tourniquet (do this before removing the needle to avoid a hematoma)
10. Remove the needle
11. Apply gauze and pressure
12.apply bandage or coban (patient preference)
13. Clean up supplies
14. Label tubes
-in the presence of the patient
-double check patient labels with patient identification (either verbally or armband)
-hand write date, time, phlebotomist identifier on label
15. If drawing in a patient's room, leave jr how it was found
16. Send/deliver blood to lab
Capillary puncture
-finger or heel stick
-neonatal testing
-point of care testing
-hard stick
Capillary puncture tube
- microtainer
- same color-coded system as full-sized tubes