Zooarchaeology Final Exam
1/81
There's no tags or description
Looks like no tags are added yet.
Name | Mastery | Learn | Test | Matching | Spaced | Call with Kai |
|---|
No analytics yet
Send a link to your students to track their progress
82 Terms
Taphonomy is
The study of fossil assemblage formation
Raymond Dart was
one of first to start to wonder about how the bones he was recovering arrived there in the first place
osteodontokeratic industry - means they thought that
they were using heads, teeth, and hooves in tool manufacture
Dart’s Australopithecus research
- noticed damage to Australopithecus cranium – previously thought it was evidence of cannibalism
- puncture marks on skulls line up really well with teeth of a cheetah
- Brain thought it might be big cats creating these assemblages
Taphonomic factors that are not controllable
natural factors influence bone population
cultural practices influence bone population
primary and secondary disposal can lead to bone loss, population is decreased
tertiary deposition and differential preservation decrease the bone population
Taphonomic factors controlled by archaeologist
area chosen for excavation
recovery methods
analytical methods
publication
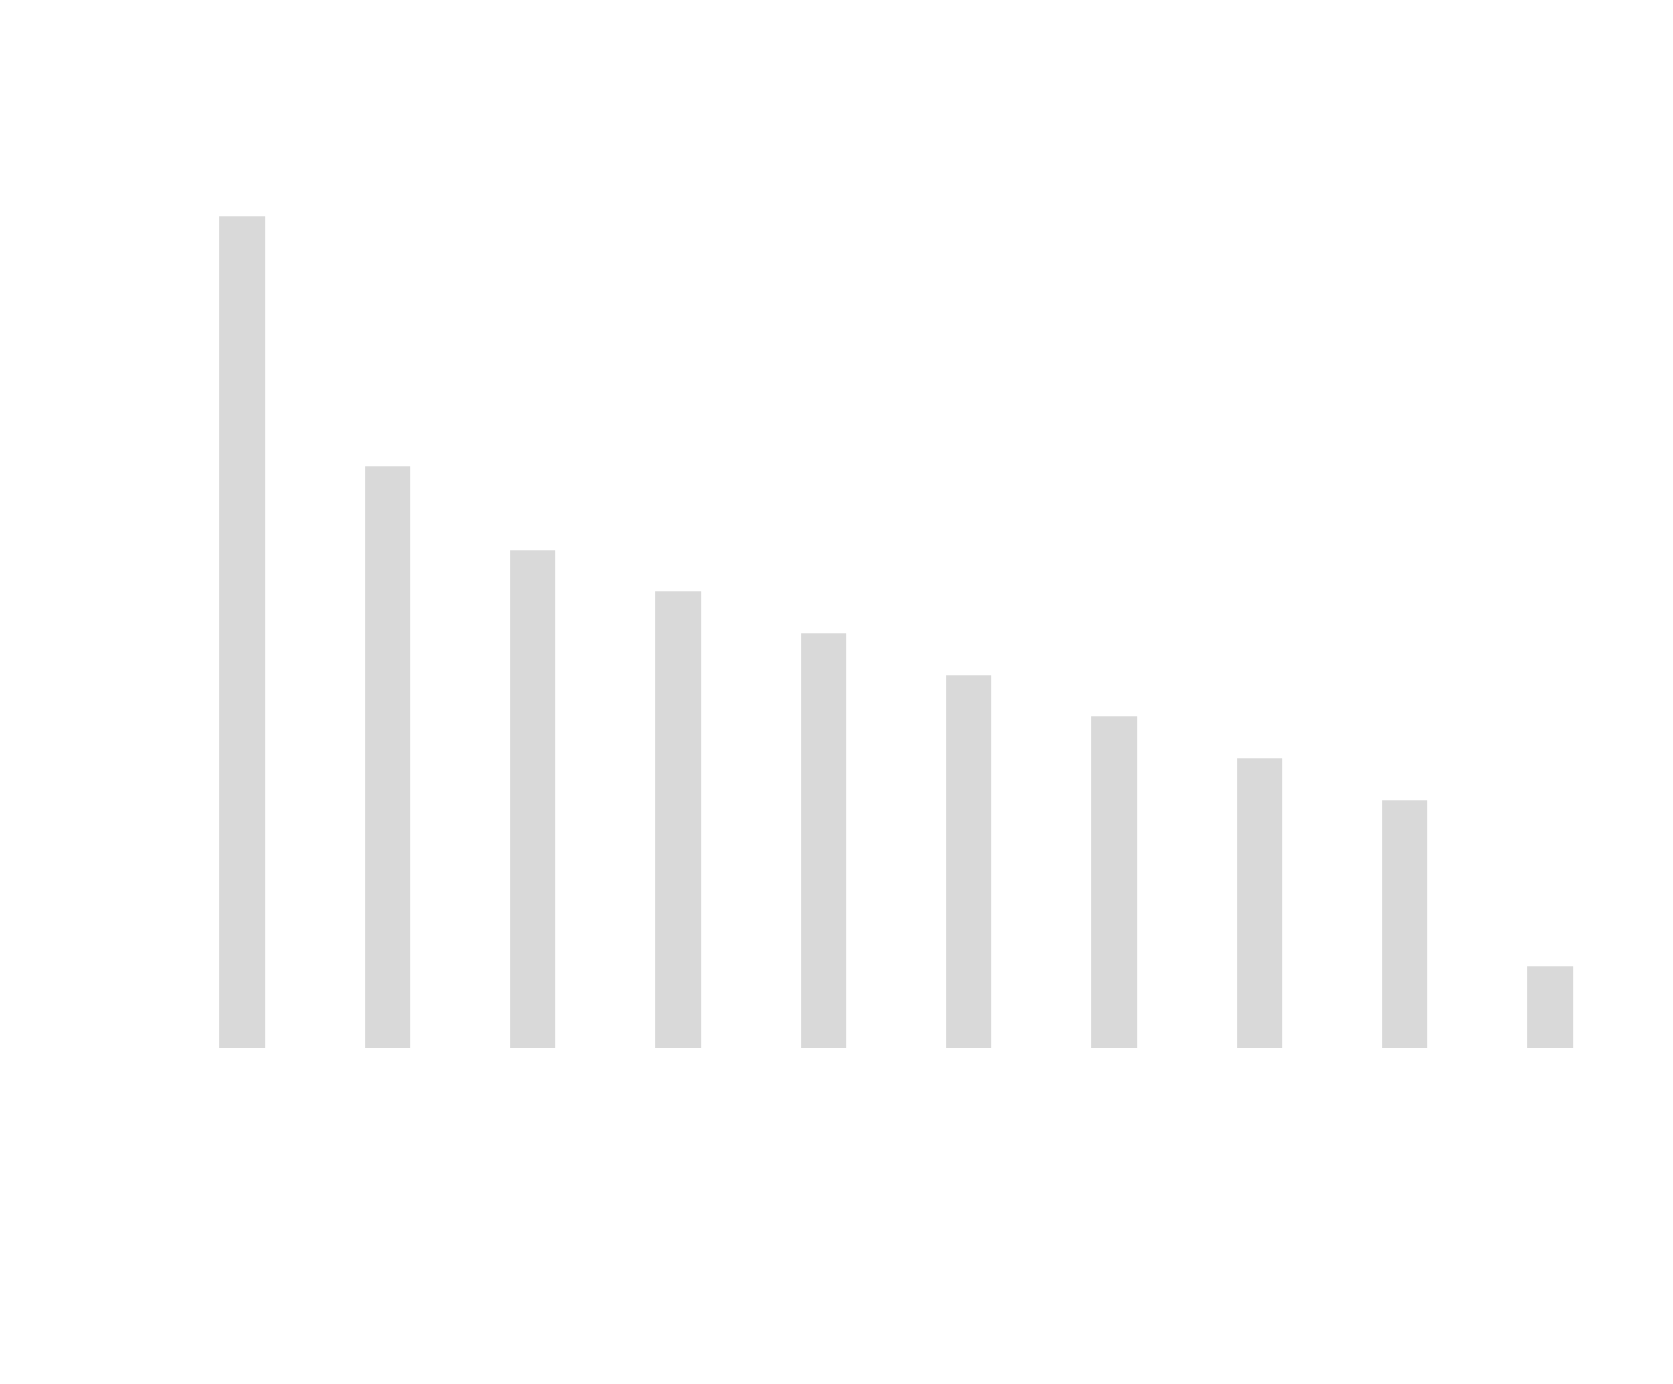
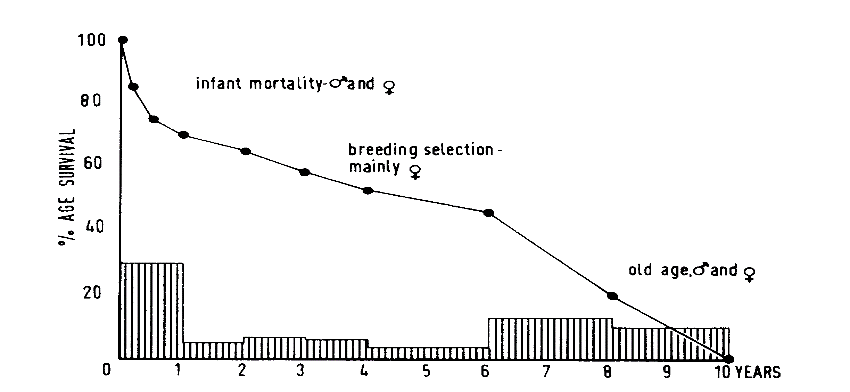
Catastrophic death assemblage
- “snapshot of population
largest proportion of the population was young individuals
- younger individuals are less likely to preserve
-humans can create either catastrophic or attritional
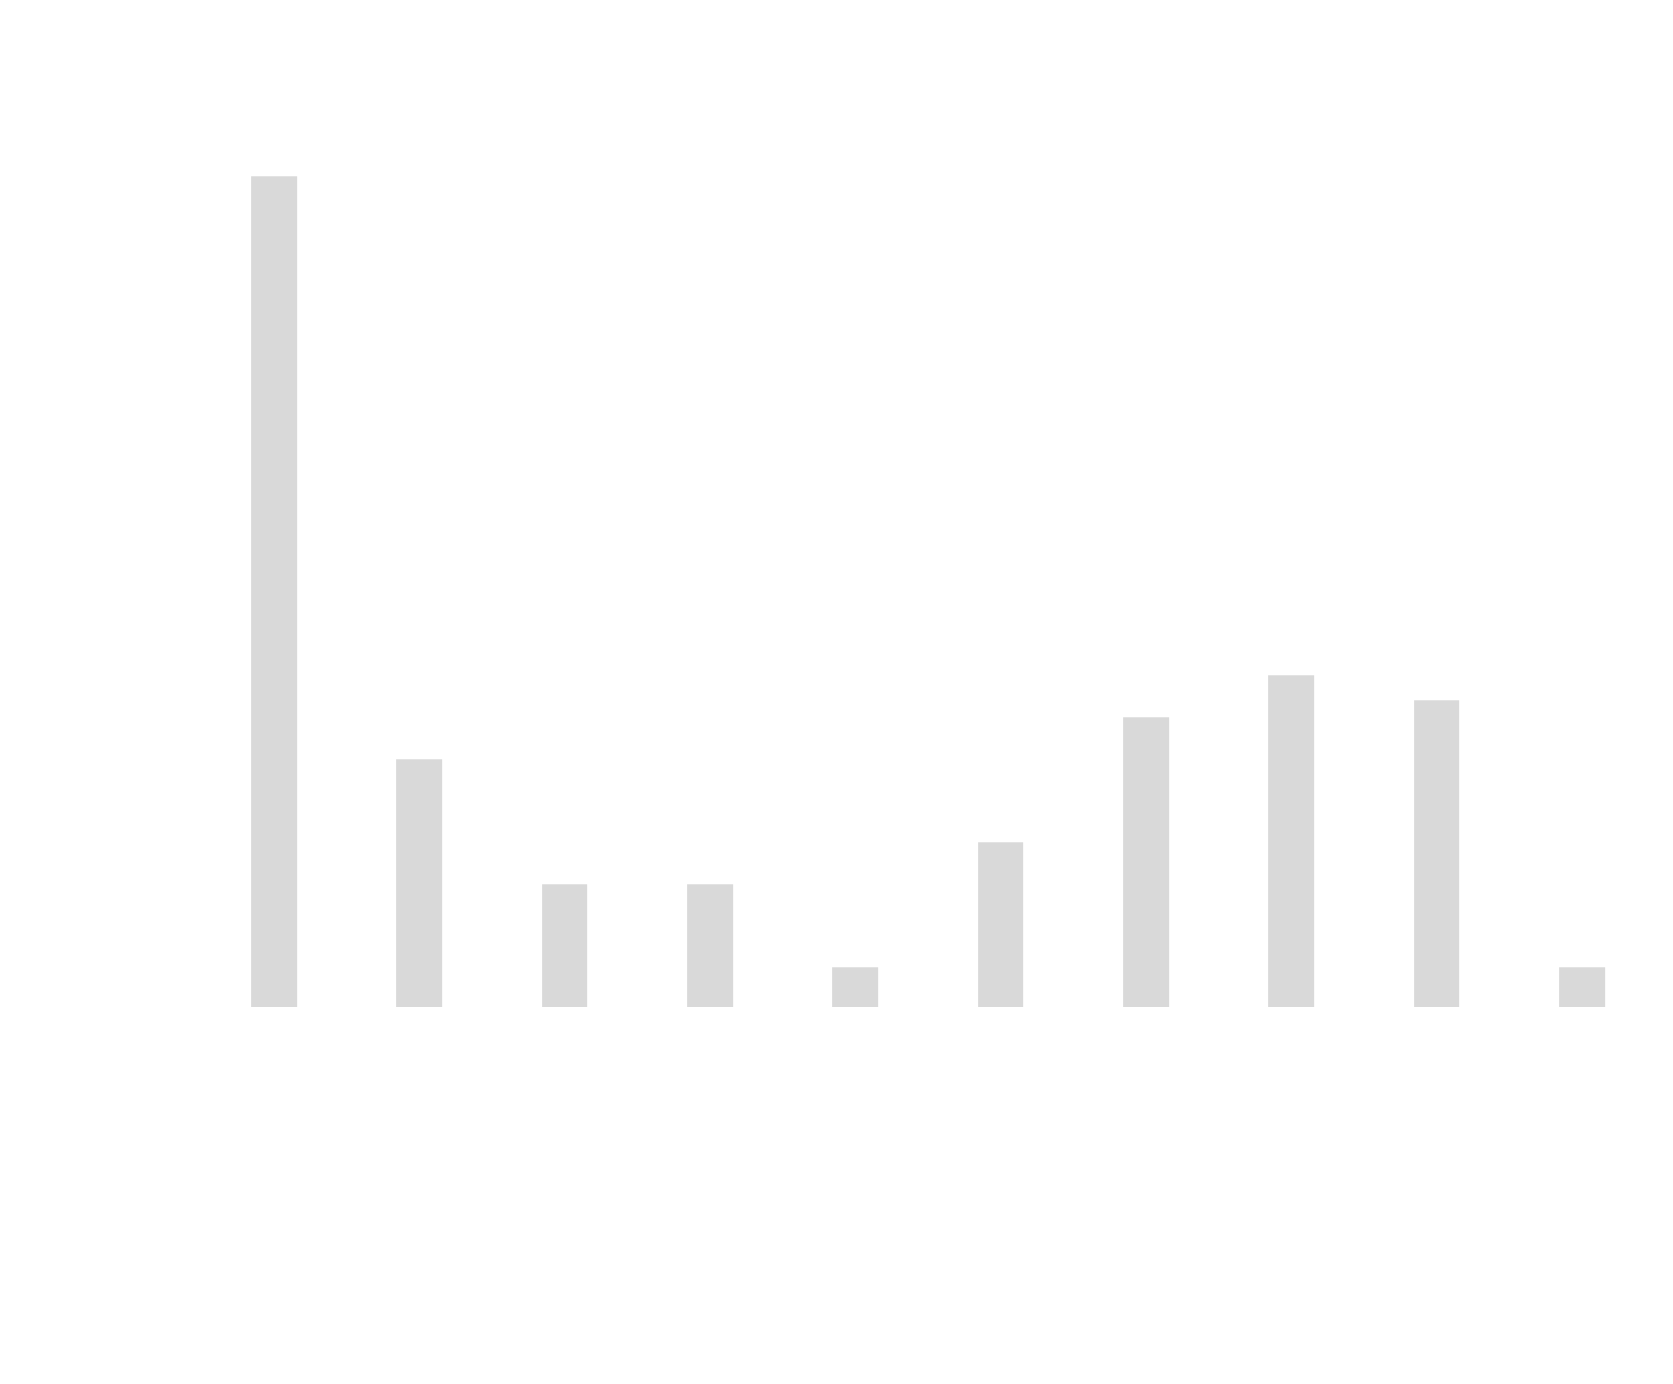
Attritional Death Assemblage
- vulnerable groups (young and old) are best represented
- individuals being picked off one by one over a longer period of time – attritional death assemblage
- low intensity disease may do the same thing
- natural death will often look like this too
-death from hunting by predators looks like this
Equifinality
– idea that there are many different ways to arrive at the same pattern (in archaeological record in this instance)
Diagenesis
breakdown of bone, specifically weathering
- bone dries out and bleaches, starts to crack,
- scale determine the level of weathering
Burial environments where is it hard to find bones
acidic soils, warm temperature, moisture in the boreal forest
Post burial transformation
•Certain species/individuals/elements more subject to destructive processes than others
Erlandson Taphonomy example
studied a historic bald eagle nest
archaeologists working on sites in coastal, riverine, or lacustrine settings should consider the possibility of non-cultural origins of marine or aquatic faunal remains and their potential association with archaeological materials
bald eagles are active transporters and accumulators of bones from marine and aquatic fauna
differentiate natural from cultural accumulations of faunal remains
How do archaeologists influence the faunal assemblage during recovery?
- excavation
- flotation
- doing something different or more specific to screen adds more time to the process
- choice of excavation area
- method of excavation
- screening (all, some, screen size, dry or wet)
- experience of screener and excavator
What is flotation for?
- In flotation, archaeological material is really tiny, majority of items are not identifiable beyond class (fish, mammal, bird)
- can be valuable if there’s a lot of fish bone or something, really tiny bones identifiable to taxon in fish
Element based approach to recording
each element recorded independently
Context based approach to recording
elements from the same archaeological context recorded collectively
Shaffer recovery, processing, identification, recording example
Fine screening is time consuming and expensive
¼” screens are standard
this size screen has a bias for larger specimens
recovery and loss of specific taxa can be predicted
Mammals with weights of less than 140g are lost
Specimens weighing from 71 to 340g are poorly represented
specimens weighing from 340 to 3,100g are represented by most elements except foot bones
Taxa greater than 4,500g are represented by most elements.
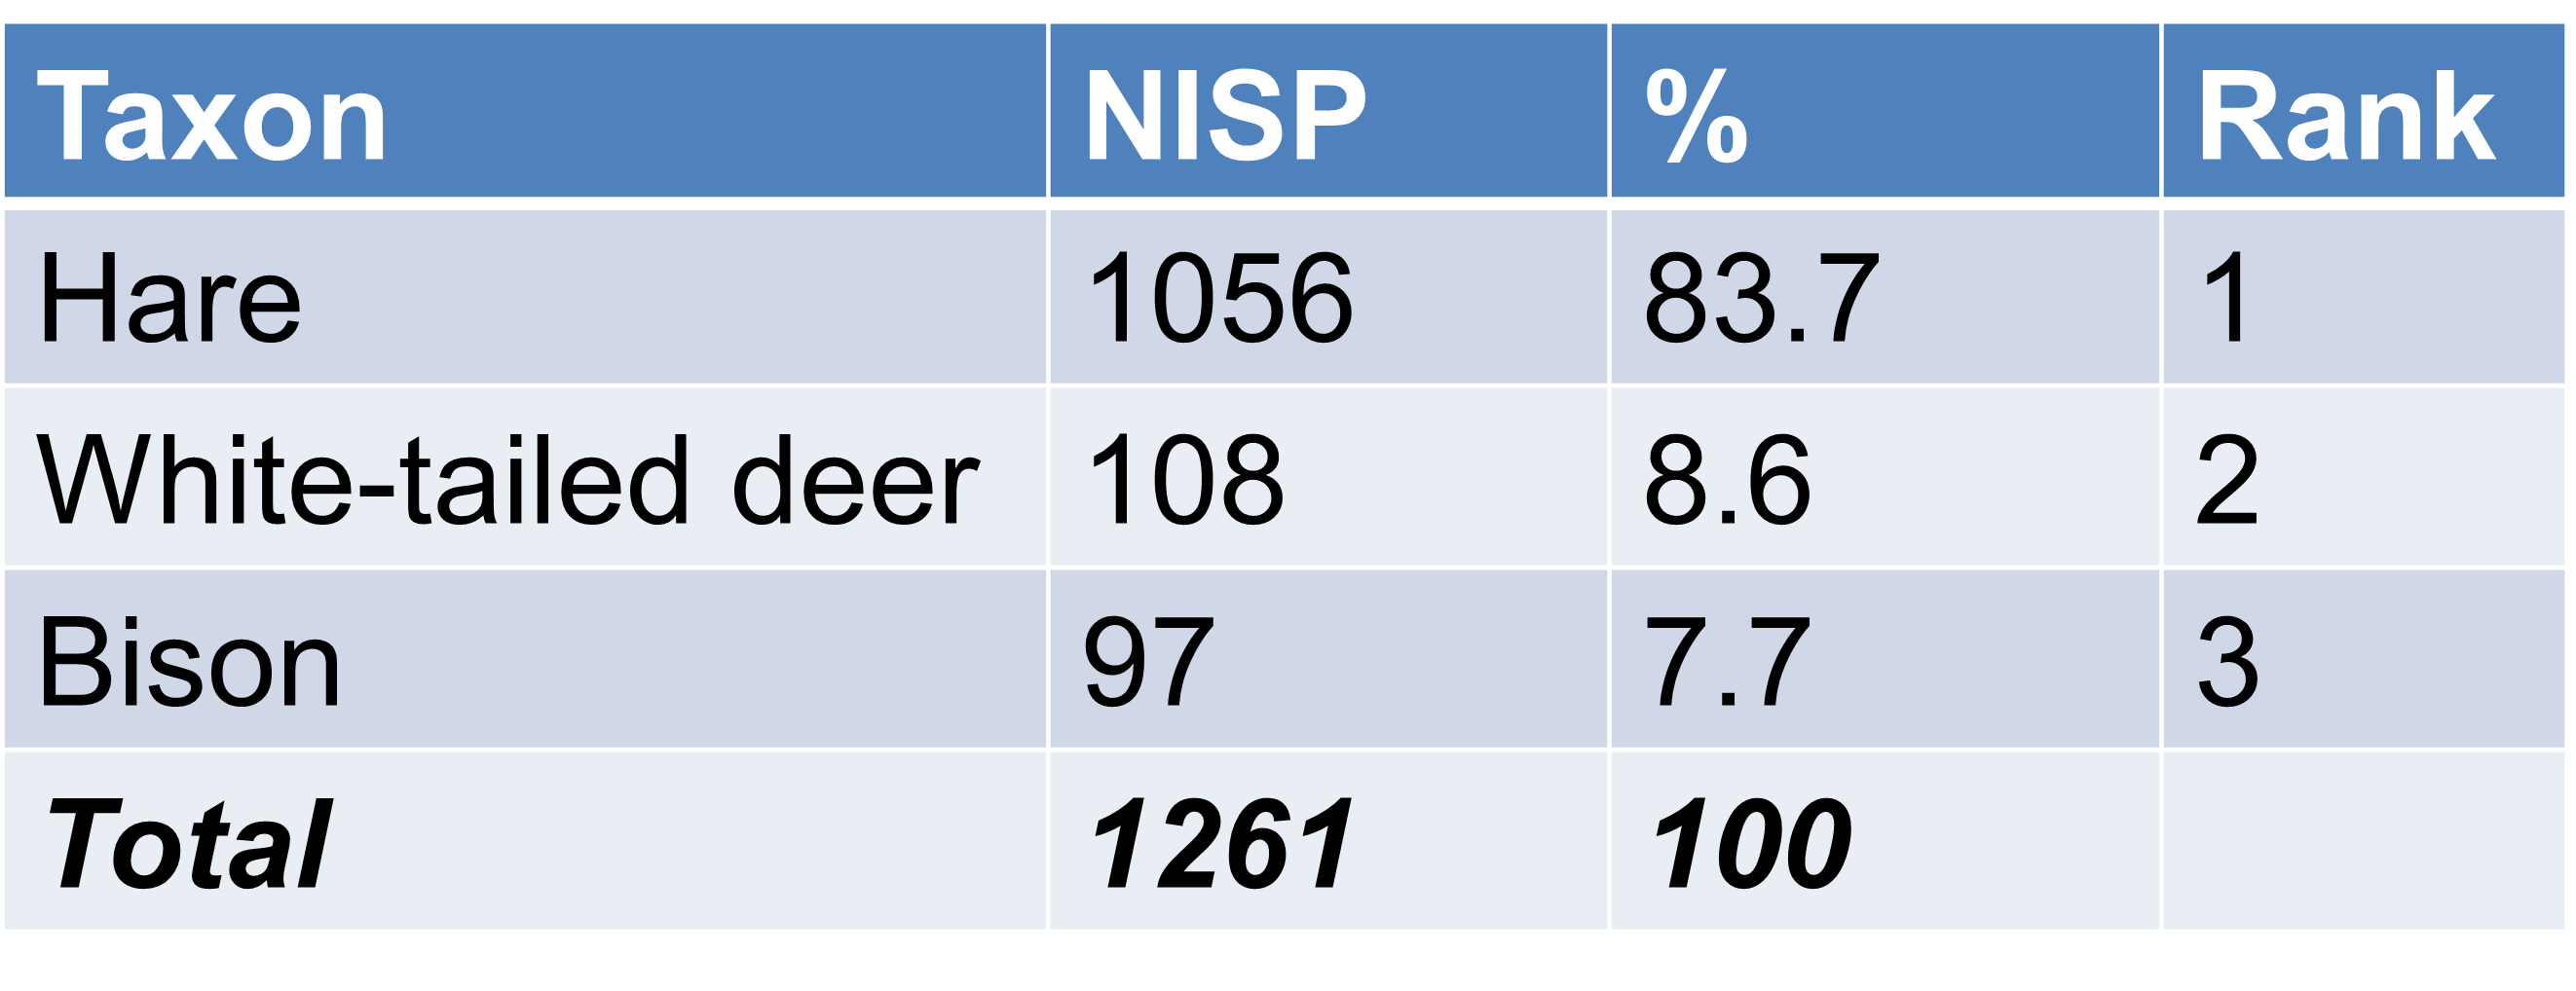
NISP stands for
Number of Identified Specimens
MNI stands for
Minimum Number of Individuals
NISP is the:
Count of all “specimens” identified to taxon
A “specimen” is
a bone, tooth, antler or horn, or part thereof
Strengths of NISP
•Easy to calculate
•Additive
•Always calculated the same way – ensures comparability
Weaknesses of NISP
NISP ǂ dietary importance
•Affected by sample size
•Affected by butchery and transport
•Affected by fragmentation
•Affected by identifiability
example of NISP calculation
Strengths of MNI
Less affected by fragmentation, butchery & transport, and identifiability than NISP
Weaknesses of MNI
•Derived from NISP and ultimately shares all of its weaknesses (esp. sample size)
•MNI ǂ dietary importance
•Different calculations means not always comparable between sites
•Tends to over-represent rare taxa
•NOT additive
•Problem of aggregation
MNI and NISP together
often used together
real number of individuals lies somewhere between the two
Best understood as ORDINAL rather than ABSOLUTE measures
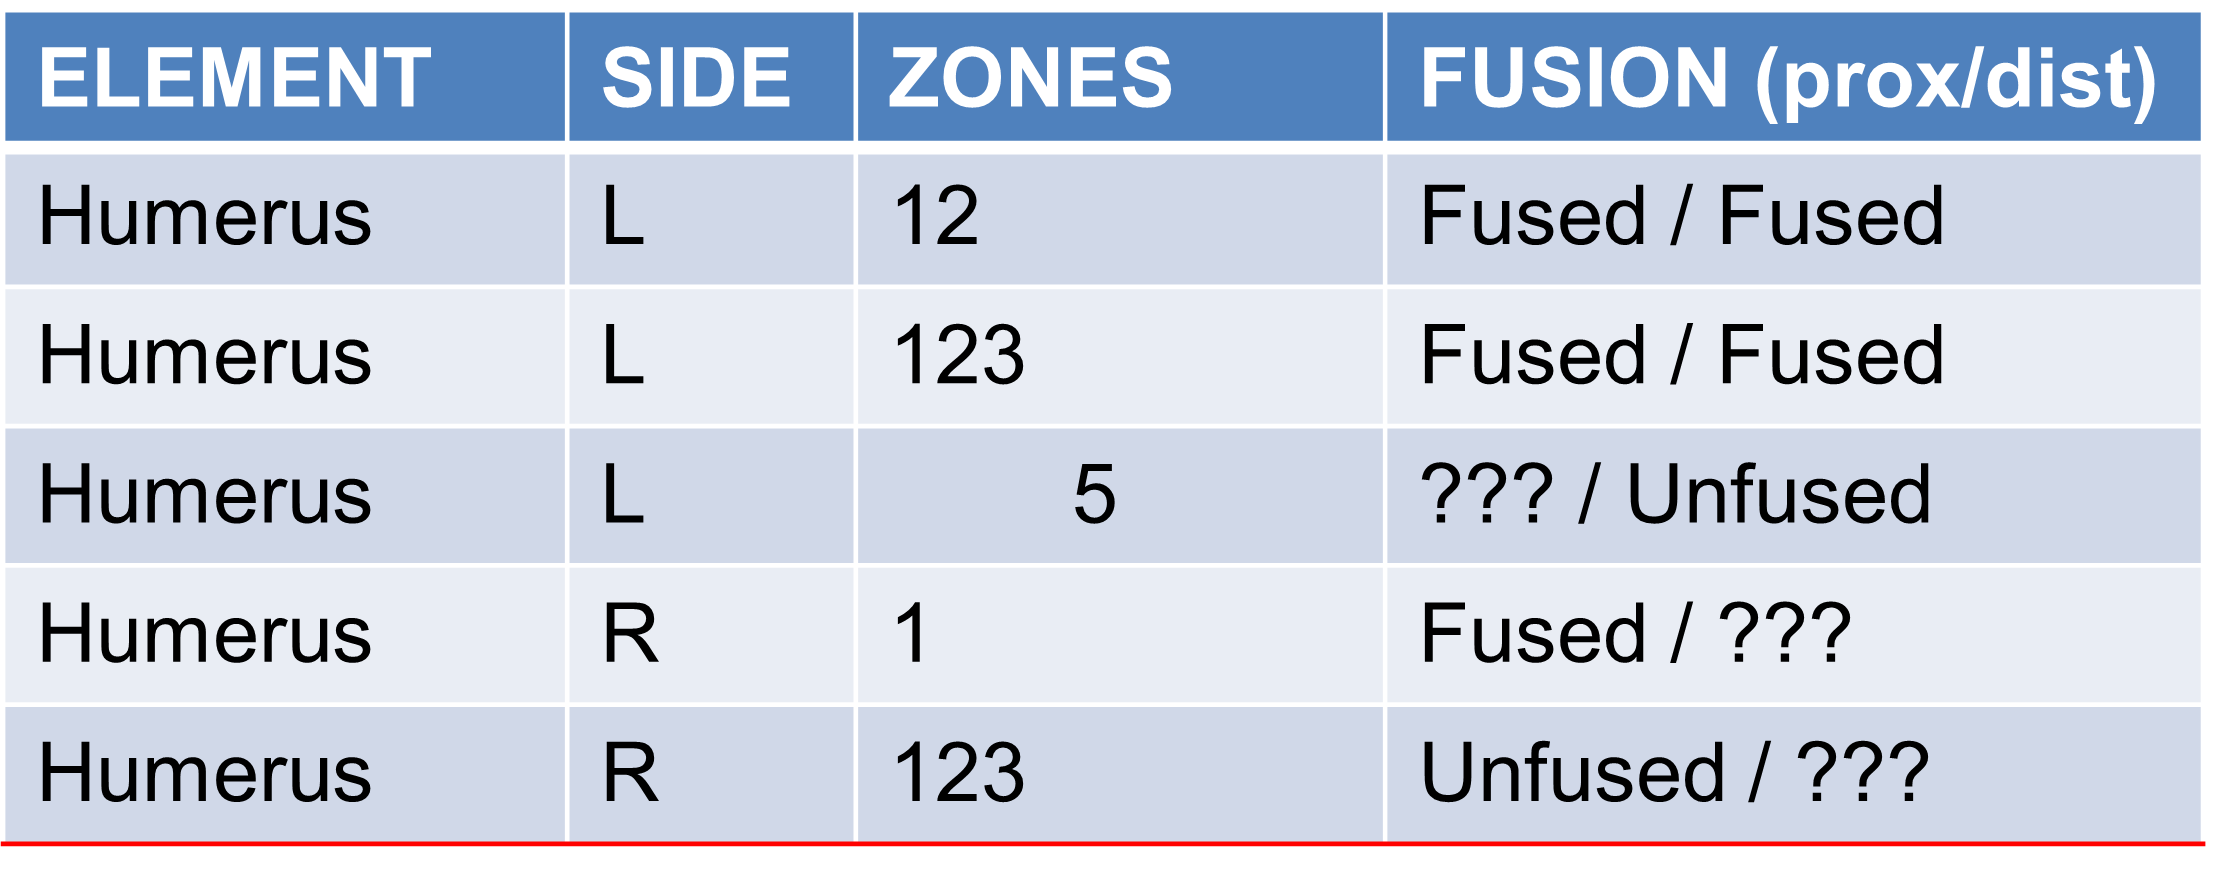
MNE Stands for
Minimum Number of Elements
MAU stands for
Minimum Animal Units
MNE is
Minimum number of complete elements that could account for all the specimens of that element
MNE example
MNE is 5
MAU is
MNE divided by the number of that element in one complete skeleton
Allows a direct comparison between skeletal elements
Factors affecting MAU and MNE
affected by sample size
affected by fragmentation and identifiability
not additive
is affected by problem of aggregation
MAU is based on MNE
probably not going to be affected differently
Reconstructing environmental change can be done with
Indicator Species – limited environmental tolerances
What are assumptions we make when reconstructing environmental change
environmental tolerances that we know from the present are probably the same from the past
Population changes as we move away from the equator
diversity decreased, larger populations with less species
Population diversity in the arctic
number of possible species that a fragment could be is small
Reconstructing human impact on the environment
- moving towards more jackrabbits than cottontails
- cottontails being hunted

R-Selected species
reproduce very quickly, a lot of offspring and short breeding period, rabbits
K-Selected species
opposite, reproduce slowly, less offspring and longer breeding period
Badenhorst and Driver species representation example
changing animal usage over time in the San Juan Basin
artiodactyls declined over time in relation to lagomorphs
Turkeys increased in the northern regions when compared to lagomorphs. Cottontails increased when compared to jackrabbits over time
as human populations increased in the San Juan Basin, artiodactyls were more intensely hunted
then began to raise more turkeys in favorable regions, and also hunted more lagomorphs in relation to artiodactyls
deforestation - better environment for cottontails
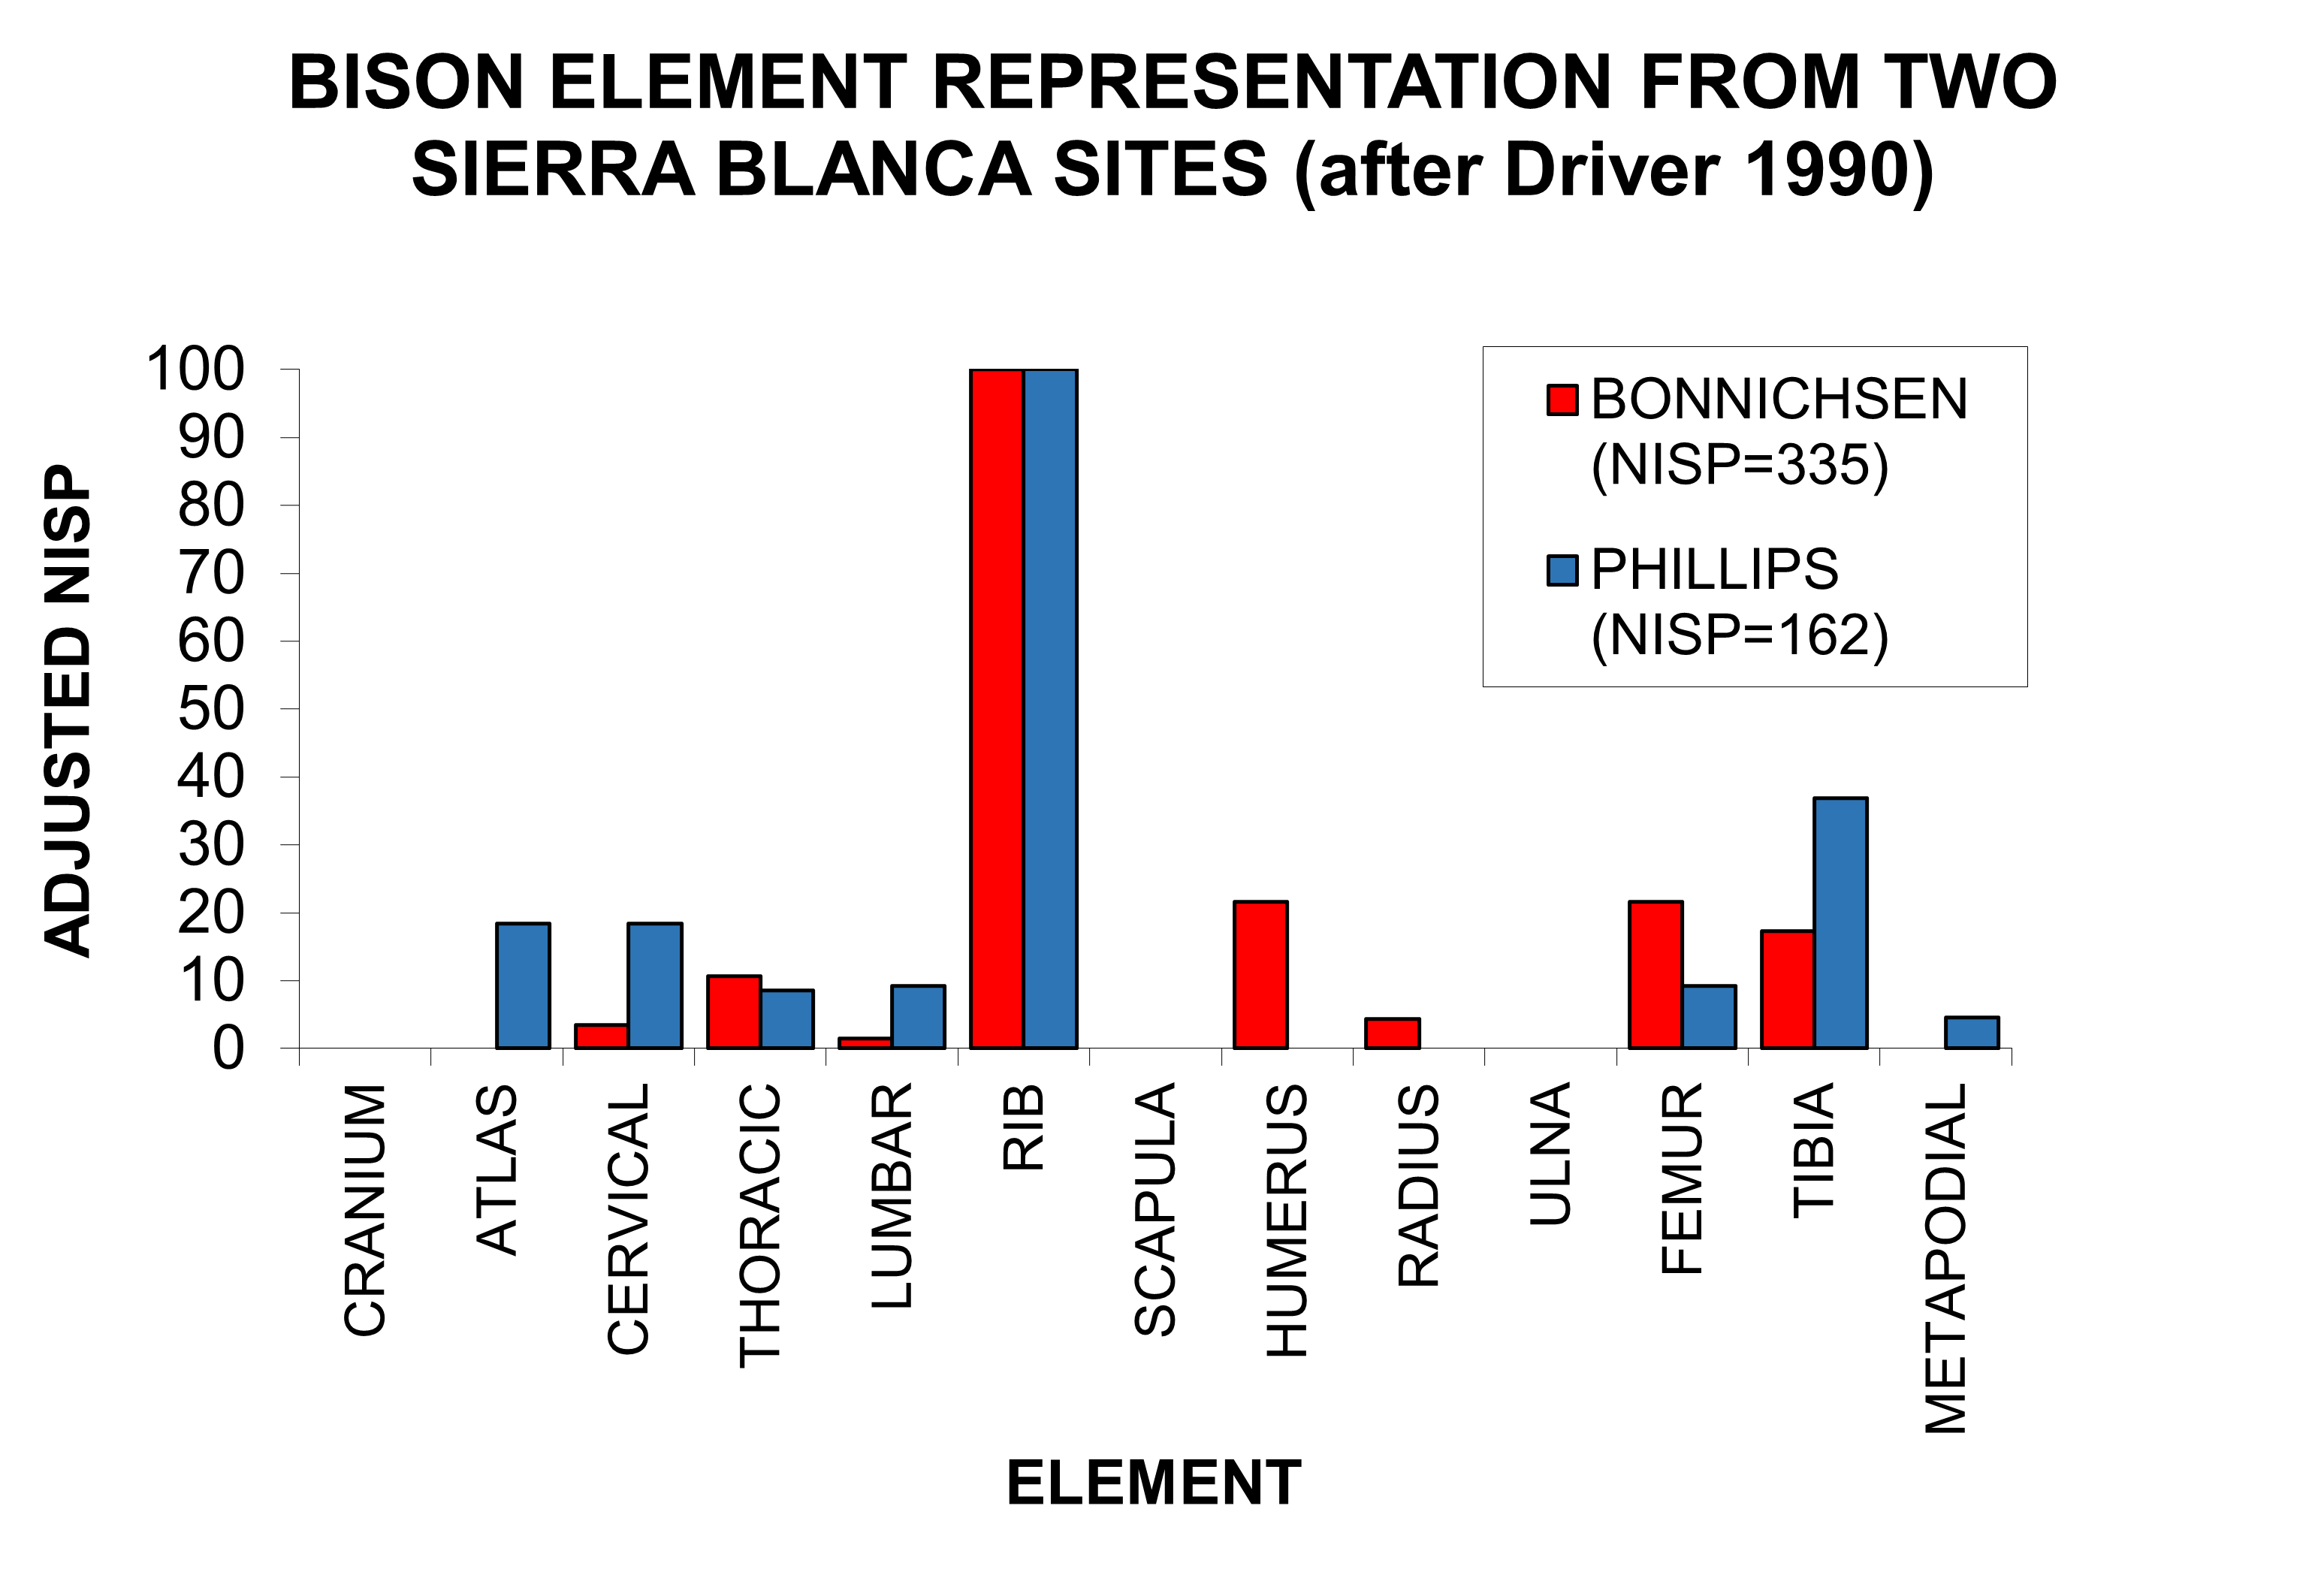
Butchery and transport example
- they’re not taking the entire animal
- partial remains because they’re butchering the animals and bringing a lot of ribs back
- or maybe someone else down on the plains is hunting, these parts are arriving up in the mountains via trade
- might not be able to figure out which one it is just from the bone
equifinality
how do we quantify utility
We usually quantify utility in terms of food (meat, marrow, grease
Other factors also play into transport decisions:
e.g. tool raw materials, architectural value
Utility indices
Not just for meat
General Utility Index (GUI)
“Modified” utility indices to account for “riders
Camp site
not a lot of low utility items, a lot of high utility items (food and stuff)
Kill site
a lot of low utility items, not a lot of high utility items
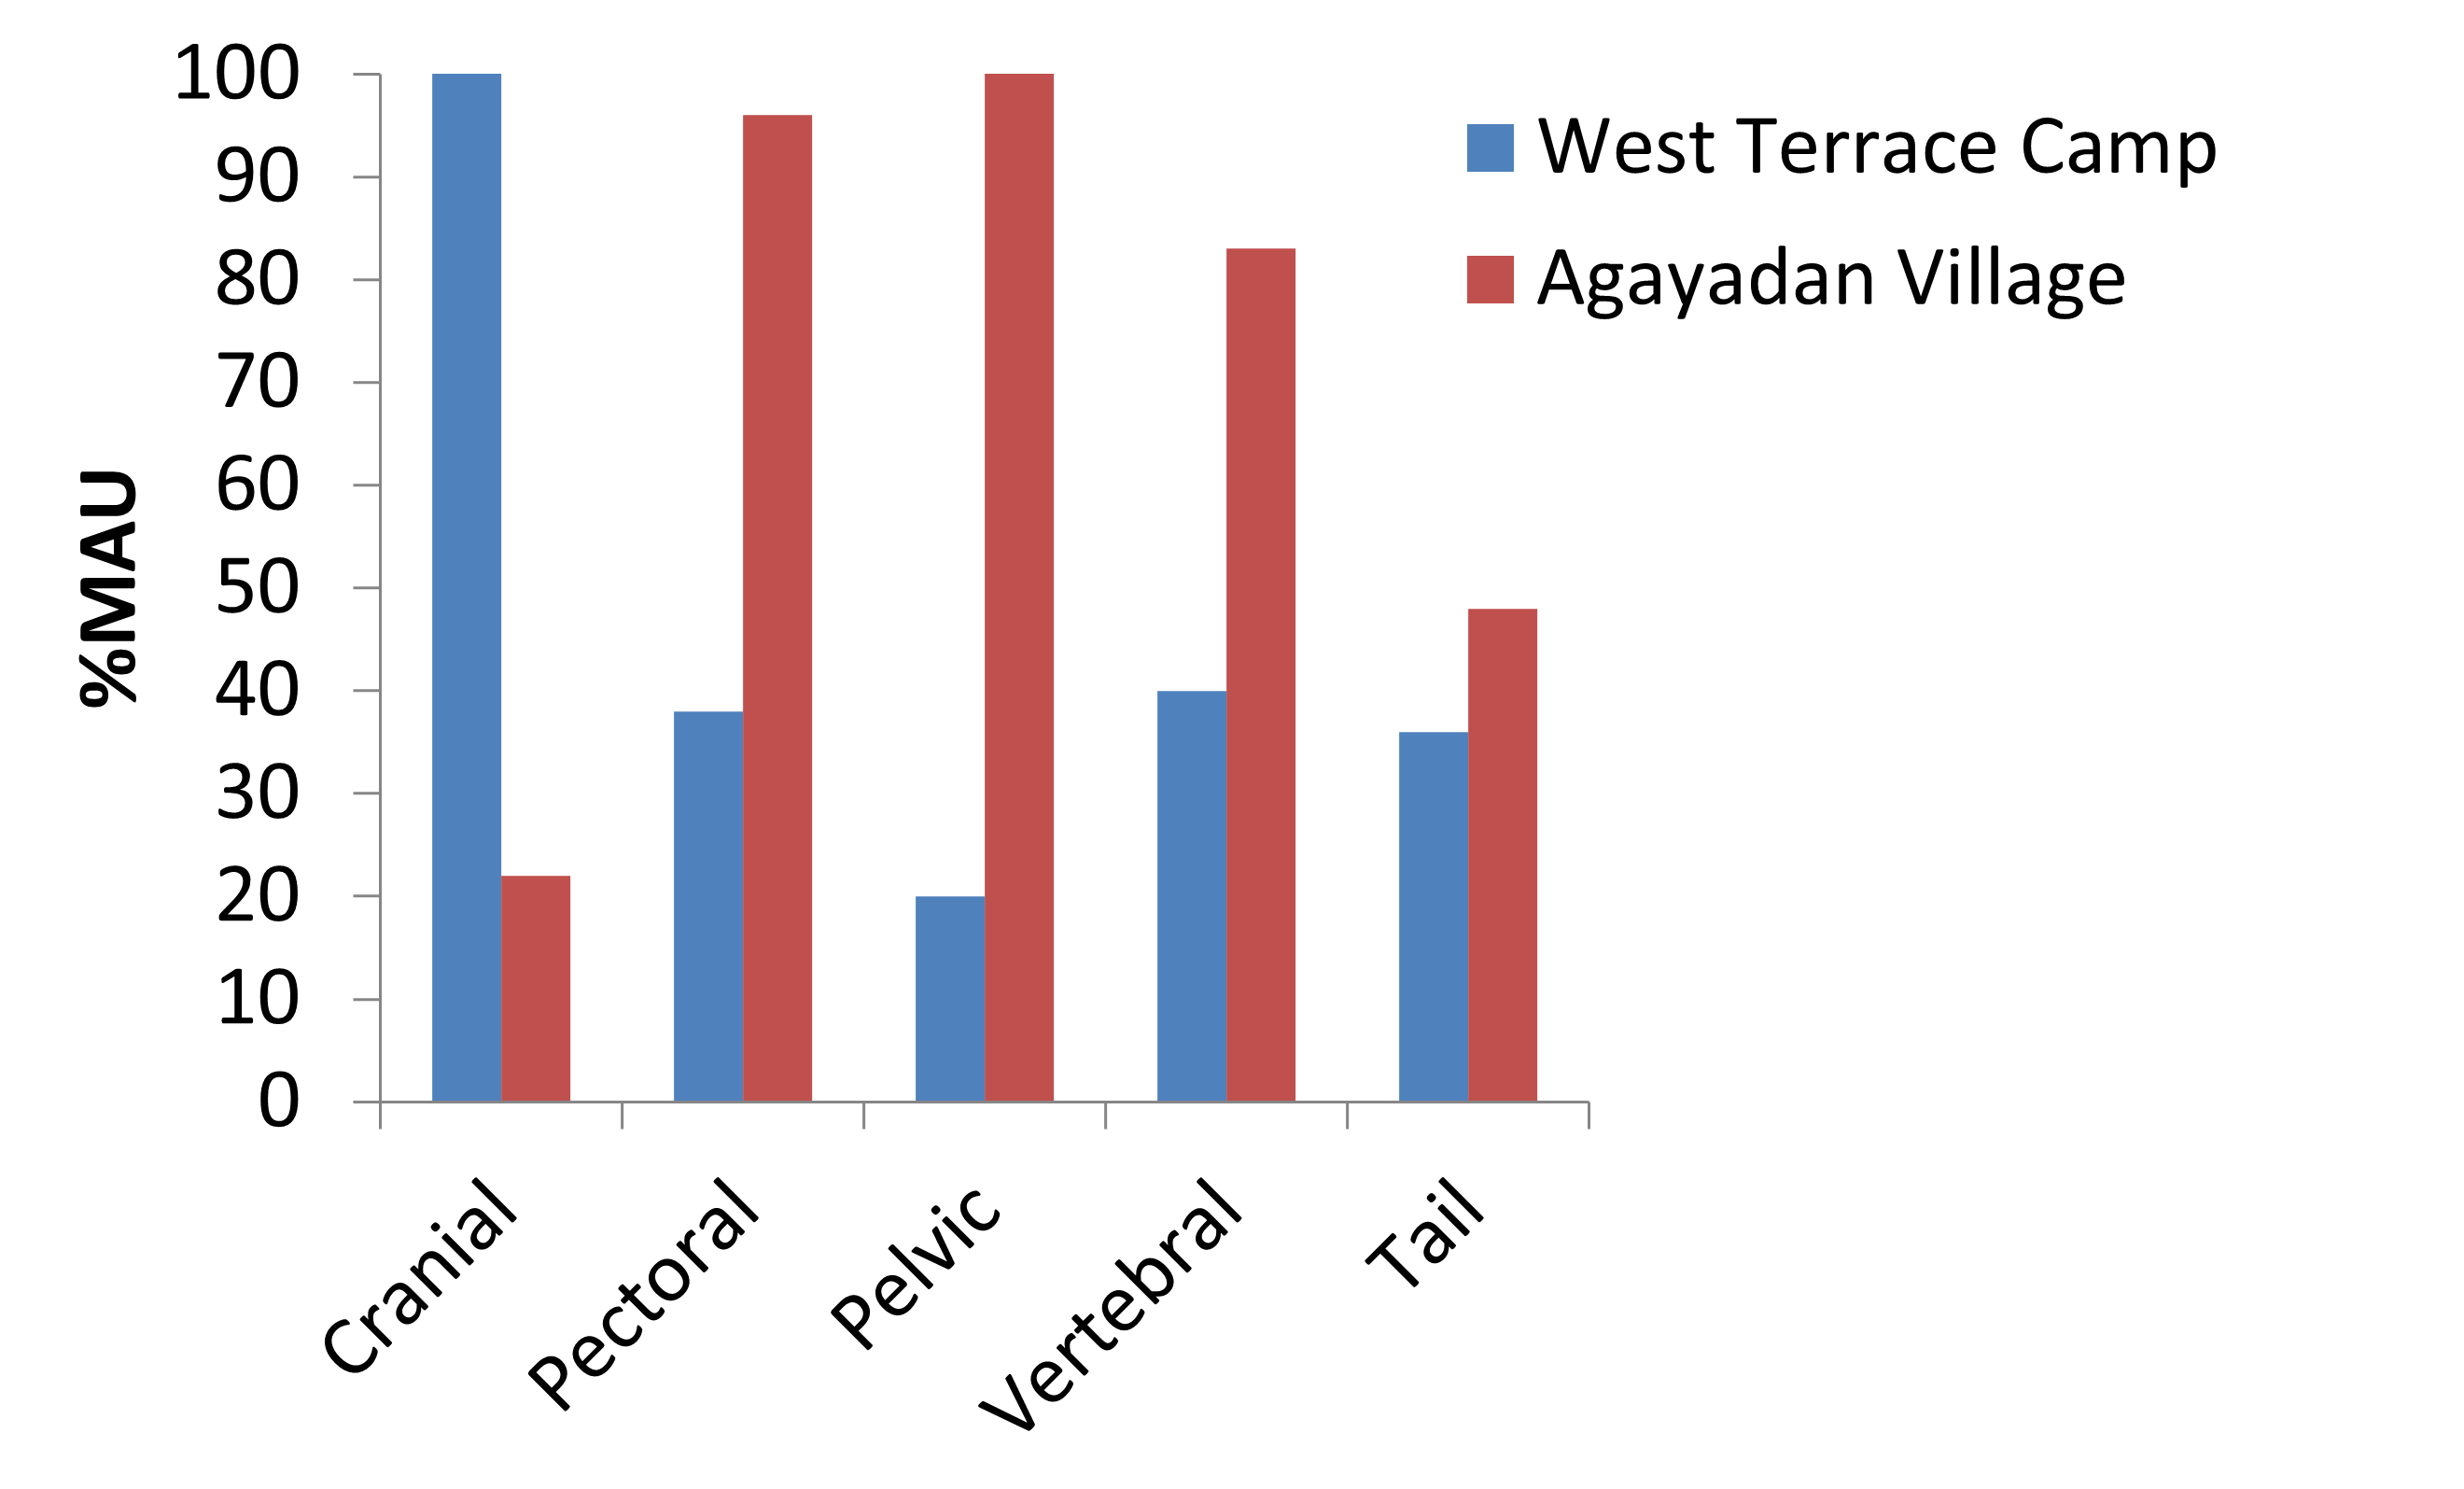
Hoffman butchery and transport example
salmon processing and storage
a lot of cranium in the camp site – they’re beheading them and bringing the rest back to the village
What methods can we use to determine season of death?
- if we know when it died we can work out how old it was
- what season it was born in
- what season it died in
Common assumptions when determining seasonality
species of the past had the same migratory ranges at the same time of year
challenge – people store food, people could have brought stored resources to sites- Does seasonal species always mean occupation at that time?
Seasonal structures on an animal are:
things that are only present on animals at certain times of year – antlers
Incremental growth structures are
In seasonal environments many tissues alternate rapid growth with slow growth
Visible in thin-section – development of most recent growth layer indicates season of death
IGL stands for
incremental growth layers
GLG stands for
Growth layer group (once per year)
Tooth eruption and seasonality
•In species with a restricted birth season, dental eruption can be used to estimate season of death
•Requires young individuals in early stages of development (aging becomes imprecise for older individuals)
Seasonality and birth patterns
•In species with a restricted birth season, at any moment in time there are discrete age cohorts in the population
•In a seasonally hunted population, body size of young individuals will cluster for each age cohort
•A population hunted year-round will display a continuous size distribution
Juvenile populations importance to seasonality
In many cases, seasonality information can only be gleaned from the juvenile individuals in a population:
•Tooth eruption
•Growth (bone measurement data)
•Incremental growth structures also easier to read in younger individuals
Landon 2008 Seasonality example
17th and 18th century - Chesapeake bay area had seasonal hunting patterns
looking at seasonal slaughter patterns helps us see the connection between town and country through the urban food supply system
can look at culture too
Factors indicating domestication
animals get generally smaller
Shift in relative abundance of species over time
How are age cohorts formed in a population
Some animals give birth at a restricted time of the year
Population that was killed in a moment of time – you can pick out age cohorts
methods for Sexing species
–Sexual structures
–Morphological differences
–Dimorphism
methods for aging species
–Tooth-sectioning
–Epiphyseal fusion
–Tooth eruption
–Tooth wear
-growth
Herd management and domestication
•Among farming groups, population structure (age and sex) tells us about herd management strategies
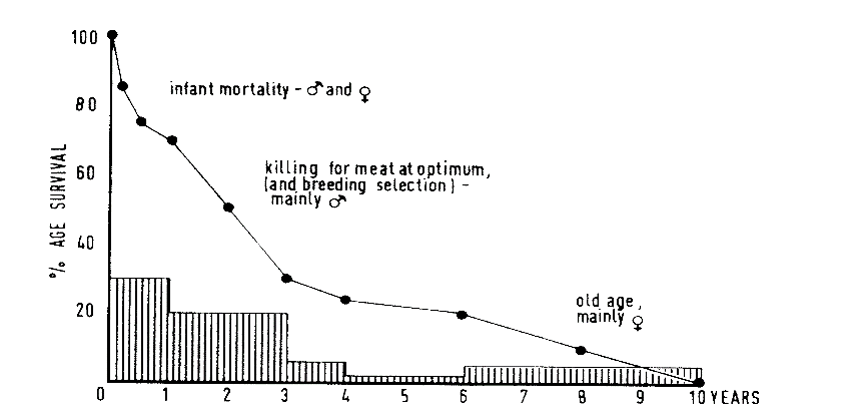
Meat culling mortality profile
less steep than other mortality profiles
some reason for males to reach adulthood - meat
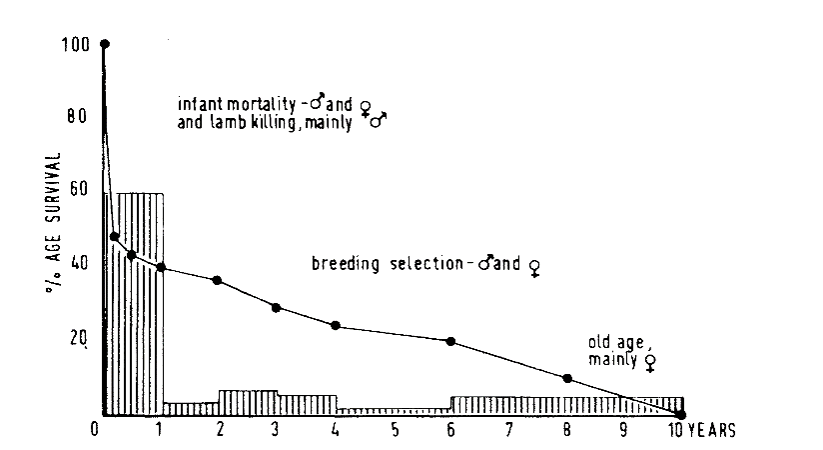
milk culling mortality profile
-If you just want milk, there’s no reason for males to reach adult size, really steep population drop
Wool culling mortality profile
-Male sheep can be used for wool
-Less deliberate culling of males
-Only big drop is infant mortality
Payne prey selection and domestication example
describes a method for recording prey selection data for sheep and goats
use mandibles and mandibular teeth
using the relative representation of different age-groups in a sample
Behavioural ecology is
A branch of evolutionary ecology
Evolutionary ecology also looks at the ecological context of adaptation
- Emphasizes use of models to predict and analyze
When evolutionary ecology is used to examine the behaviour of humans and other animals, it is called behavioural ecology
Studying cultural adaptation through B.E. can be difficult because the rate of change is much faster than for biological traits
Neo-Darwinian
differential reproduction is the main force shaping biological adaptation.
Fitness measured by number of offspring.
Behavioural ecology studies evolution at the ( ) level
phenotypic
→ Genotypes – genetic makeup
→ Phenotypes – how genetic makeup is expressed
Sees behaviour as adaptive and part of the phenotype
Underlying assumptions of behavioural ecology
People will always choose to “optimize” their food procurement strategies
They calculate costs and benefits and make rational choices to maximize food returns
Patch model choices
applies when resources occur in clusters (or patches)
foragers can affect their overall return rates by spending more time in these patches
Optimizing prey choices
CURRENCY: calories
CONSIDER:
1) Gross calories per animal
2) Cost of procuring animal (time and energy)
3) Abundance of animal (encounter rate)
Central Place Foraging Model
Assumption: People prefer to hunt close to home, will move farther afield as resource becomes less available
Hunting close to home: Bring back whole animals
Hunting farther afield: Preferential selection of high utility elements
Transport costs – more selective about transport as transport costs increase
Rate of Prey Encounter effects
Hunters move to lower ranked prey as encounter rate of higher ranked prey decreases
Starkovitch evolutionary ecology example
prey choice, central place foraging, and patch model models applied
Middle Paleolithic hominins focused on high-ranked large game resources, while Upper Paleolithic and Mesolithic occupants shifted to lower ranked small game, fast-moving animals
unique environmental and cultural circumstances are reflected
Hawkes’ Ladder of Inference
religious/spiritual life
social/political institutions
subsistence-economics
techniques of production
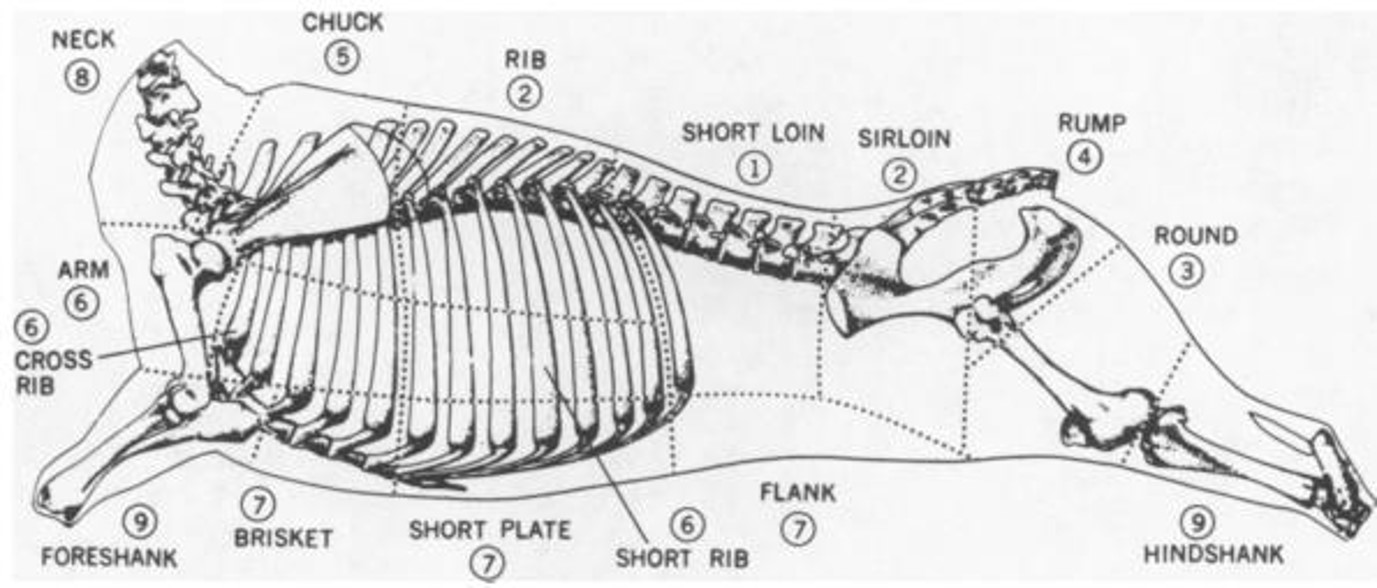
Example of social status and animal remains
Major cuts of beef ranked according to late 19th century retail values
Components of social identity affecting access and use of food resources
community, ethnicity, status, wealth, religion, gender, age etc
After non-human taphonomic factors are ruled out, zooarchaeological evidence often reveals socially driven differences within and between sites in terms of:
•abundance, diversity and evenness in the representation of taxa
•relative abundance of skeletal parts for a given taxon
Important assumptions/shortfalls of social status and zooarchaeology
We need to rule out other explanations for the observed patterns (such as environmental differences that impact local availability of taxa)
•While it can be difficult to know exactly how the different aspects of identity contributed to the observed patterns, the most convincing explanations are supported by multiple lines of evidence.
Valenzuela Lamas Social Status and Zooarch example
The combination of several criteria regarding the presence of species, the skeletal part representation and the butchery pattern, converge towards a Jewish origin of the faunal remains
These two assemblages constitute one of the few opportunities for characterizing the diet of the Medieval Jewish communities in Spain, and for comparing it to contemporary Muslim and Christian populations.
use the animal remains on site and kosher laws to determine if Jewish people were there