chi-square goodness of fit and multinomial test
0.0(0)
Card Sorting
1/11
Earn XP
Description and Tags
Last updated 2:27 PM on 1/10/23
Name | Mastery | Learn | Test | Matching | Spaced | Call with Kai |
|---|
No analytics yet
Send a link to your students to track their progress
12 Terms
1
New cards
chi square
nominal/ categorial data, non-para test, frequency level (why we cant find out the mean cuz the data doesn’t really have meaning)
2
New cards
chi square
used to compare diff lvls of one category
compares the sample propors to the pop propors as specified by the null hyp
compares the sample propors to the pop propors as specified by the null hyp
3
New cards
how to calc the chi square
subtract the no of cases expected from the no. of cases observed and the square it.
after that divide the results by the no of cases expected and add all the values from all the categories
after that divide the results by the no of cases expected and add all the values from all the categories
4
New cards
chi square assumption-expected frequencies
must be greater that 5 in each cell of the contingency table or have a total sample higher than 20to avoid type 1 error
5
New cards
observed freqs
the numbers of participants measured in individual categories
These frequencies are then compared to the Expected Frequencies predicted by the Null Hypothesis (that occur if the null H0 is true).
These frequencies are then compared to the Expected Frequencies predicted by the Null Hypothesis (that occur if the null H0 is true).
6
New cards
working out expected freqs
**The Multinomial test**
No difference between the specified categories ie the number of men and women are equal and not ratio-ed out
**The Chi2 goodness of fit test**
No difference between the frequency distribution for the observed categories and an existing population.
eg the number of men and women in the computing department reflects the gender balance in the whole university
7
New cards
calc expected freq
–For the no preference Null Hypothesis, the number of people would be predicted to be equal for each of the two categories eg
The number of observed cases in each category would make up 50% of the 50 participants recorded. e.g. 25 participants
\
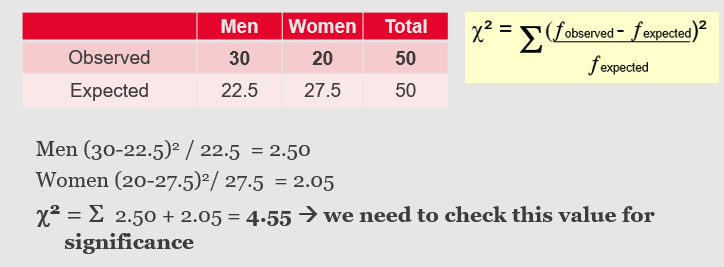
–For the **comparison population** the number of people would be predicted by the distribution of the frequencies for the whole university. E.g. 45:55 eg Men = 0.45(50) = 22.5 participants
Women = 0.55(50) = 27.5 participants
8
New cards
**x² computation: with comparison population**

9
New cards
determining significance
\
10
New cards
**Critical Value**
depends on a (alpha – usually .05), and the *df* (degrees of freedom).
11
New cards
**P-value**
the probability of rejecting the null hypothesis when it is true.
12
New cards
**A Test Value > Critical Value**
a *p* value less than alpha of .05 (a) means a significant effect