The Economics of Regulation - L3
1/24
There's no tags or description
Looks like no tags are added yet.
Name | Mastery | Learn | Test | Matching | Spaced | Call with Kai |
|---|
No analytics yet
Send a link to your students to track their progress
25 Terms
On which predictable factors does optimal regulation depend on?
• The regulator’s objectives: sector legislation to ensure transparency and accountability
• Cost of paying for subsidies if needed: fiscally possible?
• Range of policy instruments available
• Regulatory bargaining power with the operators
• Information needed and the asymmetry in its access between regulator and operators
• Degree of benevolence of the regulator
• Regulator’s ability to commit to long term policies
Define λ
λ is the cost of raising funds through taxpayers
• λ ≥ 0 → taxes distort production and consumption
• λ > 0 → MC pricing is harder to justify because of added costs related to these distortions
λ is driven by institutions and macro-conditions, often around:
• 0.3 in developed economies
• > 1 in developing countries
what are challenges/ limits that a regulator can face IRL?
Limits the gov faces:
• The government to afford subsidies
• The regulator to influence tariff level and structure
• Quality can be insufficient, but also excessive
• Environmental quality often set by non-sector regulators
• Limits of bargaining power
• Adverse Selection related to operating costs+consumer preferences
• Moral Hazard related to the level of effort by operators to cut costs
• Regulator could be captured by industry
With what kind of costs are R confronted in energy distribution?
Costs of energy distribution are often:
• Imposed by regulators (e.g. network fees)
• Partly controllable (e.g. energy losses, financing charges)
• Controllable (e.g. operations on the lines and maintenance, meter readings).
→ Most of the costs that are not in the first category are hardly verifiable by the regulator, although it can ex-post measure some of them:
• Smart meters
• Reports by the clients on faults
Costs can also vary substantially between regions due to various factors (e.g., weather conditions, population density), which is a challenge for cost benchmarking
how do diifferent countries set prices in energy distribution?
Very heterogeneous things:
Set price based on observed costs: done by GR, LU and CH
Max price: done in UK
Revenue caps: done in AU, BE, DK, FI, DE and PT
Other forms of rules based on costs: done in NL and NO
NOTE: the 2 broad approaches followed in this case focus on costs & revenues
Define the cost-based approach
This approach, either in the form of cost-plus or rate of return (RoR), is generally adopted when:
• Regulator possesses good information on costs
• Technology is mature and well understood
→ Because it guarantees a markup over costs or a certain return on investment, the approach is considered low-powered because it does not generate a strong incentive to increase efficiency
Thus, potential risks associated with this approach are:
• It requires the ability to effectively conduct an analysis of costs and of the asset base (e.g., actual status of the underground pipelines of a water company)
• It increases the risk of inflating spending decisions and the risk of moral hazard, and does not promote constant update of management practices
• The expected improvements generate a growing surplus for the consumer
→ However, it can be used to incentivize the operator to investment in quality (as costs are going to be covered)
Price Cap approach
The rationale for capping price is to provide a strong incentive to the regulated firm to improve efficiency 𝑝t = 𝑝t-1((1 + 𝑅𝑃𝐼t− 𝑋t) + 𝑍tp
→RPI=retail price index
Generally, it is done in a multi-period fashion
→ Each period builds on the previous
Remuneration comes from the gap between price net of expected improvement (adjusted for inflation) and actual cost
→ Notice that price caps do not necessarily guarantee a positive return, as cost-plus does
Price reviews generally take place every 3-6 years (medium term focus), depending on the industry
Initial values can be based on benchmarking and/or some audit process
Following revisions are based on previous price and adjustments based on the evolution of the technology and improvements made by the company (monitored by the regulator)
define the Revenue Cap approach
Revenue cap looks like price cap, as they both stimulate the regulated firm to cut costs, for it to capture the cost svings.
→ However, it has important differences:
It shifts the volume risk from the firm to the consumer because focus is on pq rather than p
In sectors w/ uncertain D, it ≠ favours users unless their D is very inelastic
Price can be set (at least in the extreme version of revenue cap only) freely as only revenue is subject to the cap
→ It can be a way to incorporate some other constraints (e.g., environmental) as revenue cap provides this complementary incentive to contain q
Risks related to cap-based approaches
The list of risks associated with Cap-based regulation includes:
Since regulating the first argument of the profit function (either price or revenue), it is subject to the risks associated with adverse selection
It introduces an incentive to improve (almost absent in cost-plus approaches), it can:
increase rents (sometimes even intentionally to stimulate investments)
increase exposure to cost-related and financing-related risks
It can lead to undersupply of quantity and/or quality (cost-plus doesn’t do that)
this risk is exacerbated in case important innovation steps are hard to achieve
Define Benchmarking/Yardstick approach
It makes use of the existence of similar operators and is used to complement other forms of regulation.
It is based on comparing the regulated company with a benchmark:
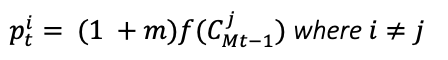
where f(∙) can be an average or the minimum
In the example above, the regulator is opting for a fixed price based on a cost-plus approach applied to a benchmark and that is often referred to as a yardstick regulation
Benchmarking/yardstick regulation has to be implemented carefully because:
→It is usually accompanied by actions from the regulated firm claiming that special conditions apply to its case
→ Goal can be either to select a specific reference group or to bargain a higher m
Yardstick can be a good solution when moral hazard is the main concern and the regulator has a good benchmark of firms that are known to be efficient,
however if the regulator is very aggressive in setting the rule, it can lead to excessive punishment of firms that are truly exerting effort to be efficient
→ having a good sense of the heterogeneity of the firms is important when opting for a yardstick regulation
→ It has been combined with transparency regulation (or sunshine regulation) which is to make public the information on the efficiency of the regulated utilities
Define Hybrids approaches
The forms of regulation just discussed are rarely done in practice in their pure version → Regulators often adopt for a mix
Advantage of mixing is that one can try to achieve all goals of each instrument:
• Protecting against risk
• Do not undermine incentives for quality
• Give an incentive to cut on costs
• Rely on information coming from other firms pooling also their associated risks
→ Sometimes the mix also comes in the form of a menu that can be offered to the firms competing in the public procurement to supply the service (with the ancillary goal of revealing type)
Example of hybrid: Profit sharing
• This form of regulation generally consists in formulas like:
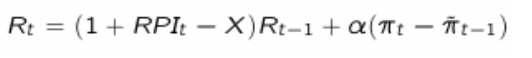
𝜋t and _𝜋t-1 are the actual profit in 𝑡 and a profit level set by the regulator in 𝑡 − 1 (for the following period),
𝛼 is the regulated level of profit sharing
• These rules try to maintain the incentive to innovate typical of revenue-cap but also to reduce the incentive of the firm to raise price to increase profit margins above a certain value
Are there other forms of regulation approaches?
Regulators sometimes also experiment with other forms
• Example: Efficient model firm
Request to expert(s) to design a regulated firm with state-of-art technology and processes
→ This benchmark is then used in a yardstick scheme & adjusted over time to account for innovation, shocks …
→Data requirements, expertise and willingness to trust the expert(s) is quite important
• Regulators are moving more and more towards performance-based regulation, i.e., introducing in their rules elements, that reveal actual effort (and success) in delivering specific outcomes (e.g., innovation, environmental protection)
What is a problem that regulators face when adopting such approaches when information asymmetry?
The fundamental problem of the rule(s) to adopt, relates to the information limitation faced in practice:
• If moral hazard is a relevant concern, a pure cost-plus is not advisable but it can be a rule to consider if other factors are relevant
• If adverse selection is a relevant concern, price cap can be useless or even backfire if the regulated firm is an efficient one
why is it especially important that regulated firms are financially viable?
• Regulated firms operate in special positions (often monopolists)
• Regulated firms cannot fail, especially when they supply essential public services
• If regulated firms can fail, this usually comes at large political cost
what are financial models that are used in practice to asses costs and revenues?
Financial models used in practice produce numbers for costs and revenues (key determinant of financial viability and of regulation as discussed in previous section)
If we adopt an approach:
• Forward looking (not base on past costs),
• where capital K is measured on a cash basis,
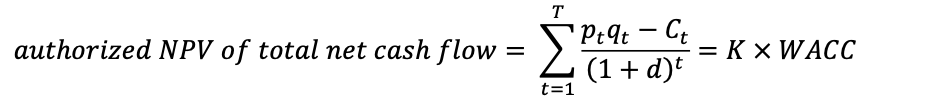
• then the return on K can be obtained from:
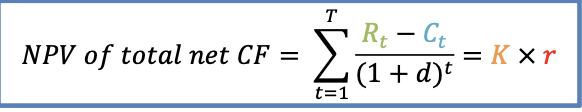
d = discount rate adopted for the calculation of the NPV
K = value of the assets used in the production
Rearranging the expression becomes:
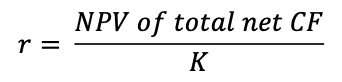
→ Calculating the authorized return on K = main goal of the financial exercise
Define Capital (K)
𝐾 = 𝐷 + 𝐸
→ The ownership of D and E is not made explicit, they can be private or public, with different implications
• when funds are mostly public, a return gap is generally financed by subsidies
• if the goal is private financing, a return gap would generally discourage investors
The main insight is that the revenue/cost margin (which relates to underline prices and costs) is set ideally to the value that provides a rate of return = the cost of capital
→ once again, if the return r is larger than the cost of capital, then users or taxpayers are giving a rent
→ Very basic financial equation behind regulatory plans
The final goal is to award to the investors a rate of return rk as close as possible to r (considered fair), via the instruments of regulation (e.g., regulated prices)
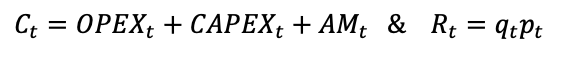
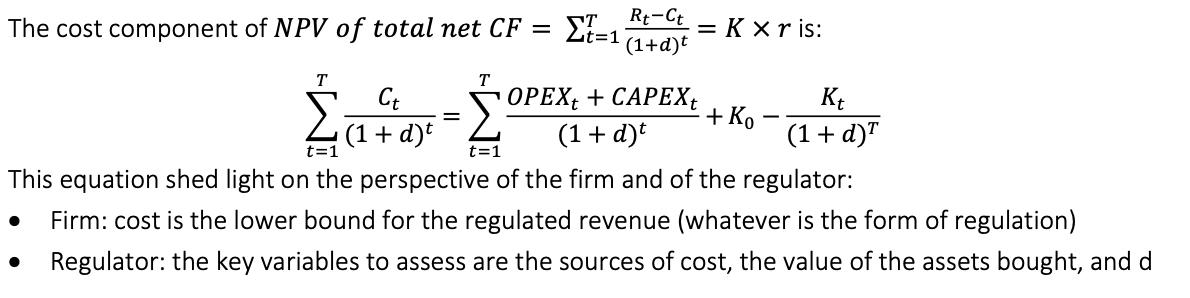
Define Costs (Ct)
𝐶K = 𝑂𝑃𝐸𝑋t + 𝐶𝐴𝑃𝐸𝑋t + 𝐴𝑀t
OPEX and CAPEX are:
• Evaluated through auditing (remember the problem of the incentive of effort and investments)
• Compared to best practices
• Adjusted to account for efficiency requirements
→ Depreciation of assets 𝐴𝑀t is, conceptually, the difference between the value of assets K0 (i.e. at the beginning of the regulatory period) and the value Kt (i.e. at the end of the period)
Define Net present value of revenue (𝑅K)
The forward-looking approach requires to estimate future demand
→ need for expertise in demand estimation
• Econometric analysis to model consumer demand for the service as function of prices, demographics, availability of alternatives, quality etc.
Sometimes this can be outsourced to consulting companies
Define WACC
rk = WACC = the cost-opportunity of capital for an investor
→it has to be consistent with the expected return on capital
→ Given that capital is financed through D and E, the return on capital is a weighted average of 𝑟D & 𝑟E
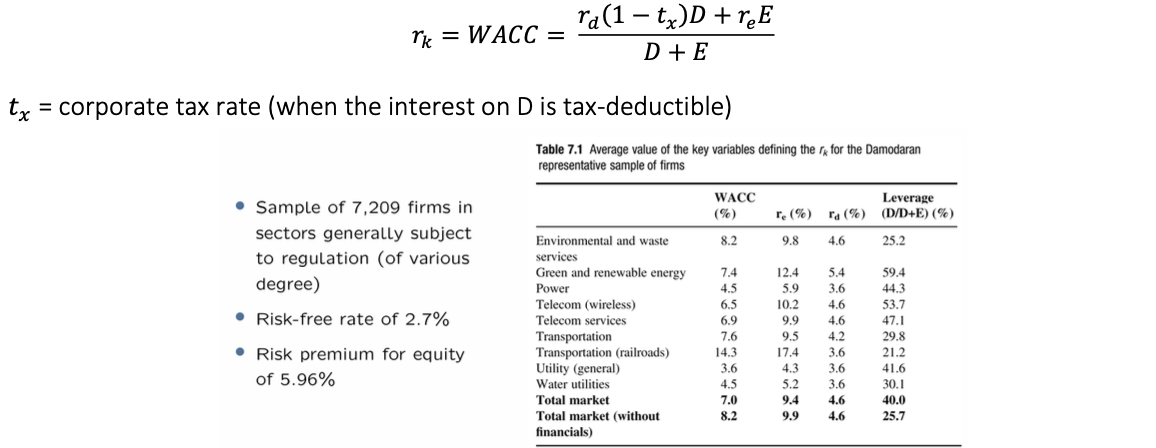
𝑡= corporate tax rate (when the interest on D is tax-deductible)
→ Once the WACC has been calculated (forward), then it can be used to obtain the regulated price 𝑝t
In other words, the regulated price (whatever is the regulatory approach adopted by the regulator) has to be consistent with the authorized return on capital
Define Cost of equity
Two main models employed by regulators:
• Capital asset pricing model (CAPM)
• Discounted cash-flow model (DCF), see box 7.2
Most regulators use the first, although the second is also a popular choice (e.g., commonly used in US)
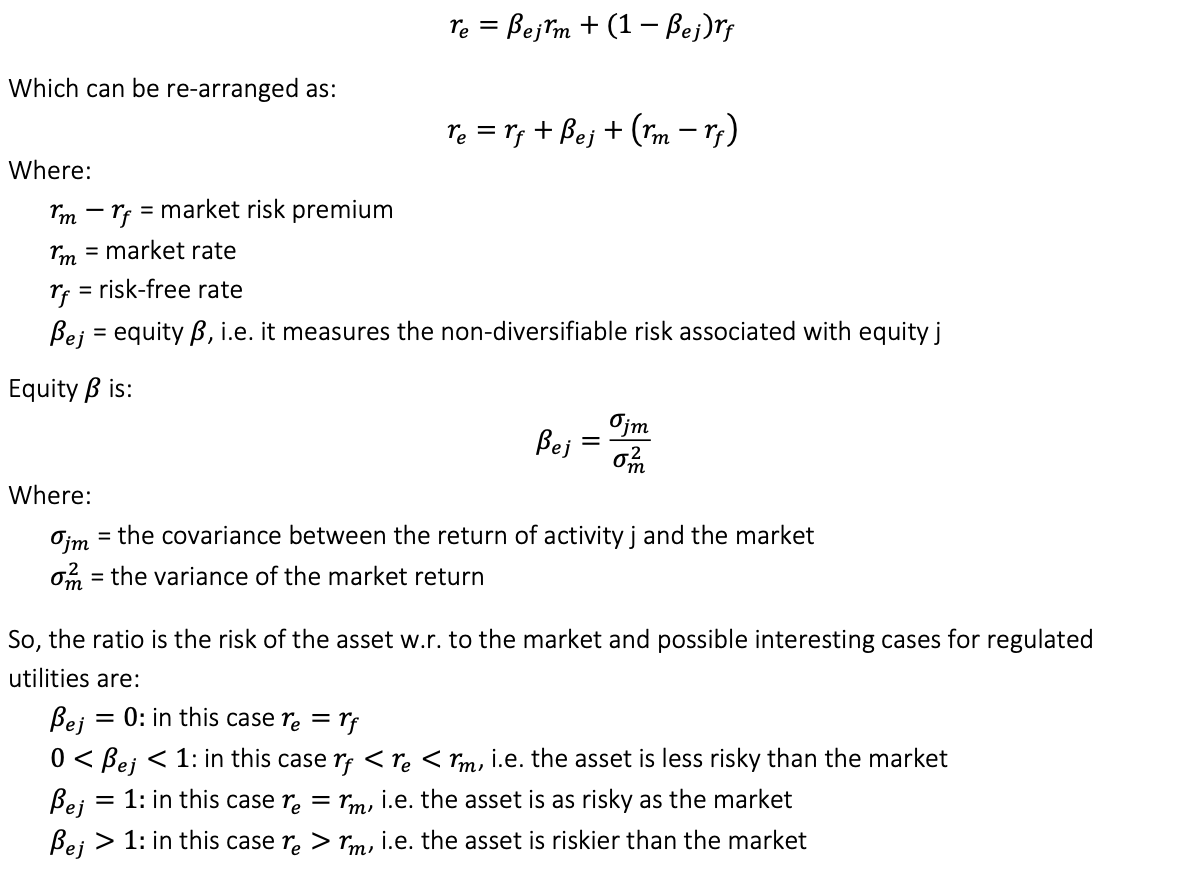
Define CAPM & ße
CAPM starts from the assumption that investors prefer the portfolio with the lowest variance for a given
level of expected return
The return that an investor requires to invest in a firm j is a weighted average between rf (risk free assets) and an alternative investment in the market rm:
Privde some ß estimates for different sectors
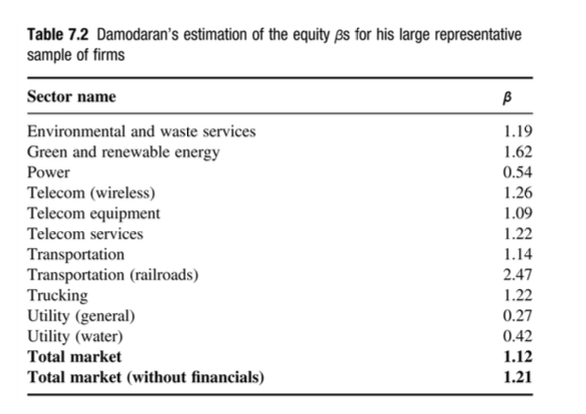
Practitioners employ 𝛽ZV calculated from historical data through regression models building on: 𝑟e= 𝛼 + 𝛽ej 𝑟m + 𝜀
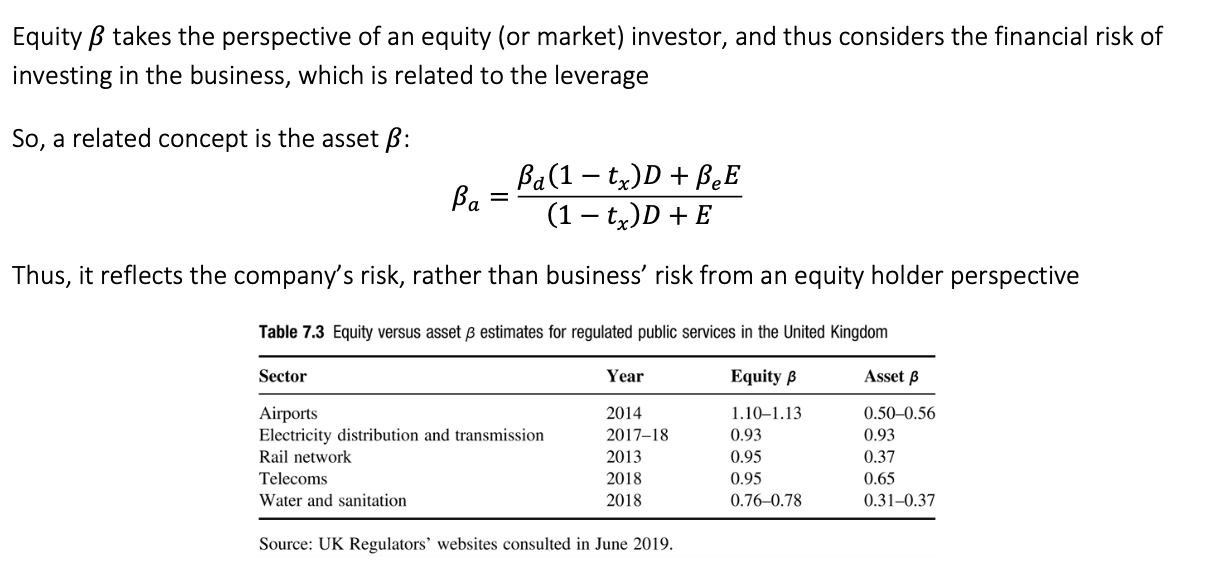
Define ßA
Define risk free rate
The risk free rate 𝑟f: this is less obvious than what it seems but in general it is used an average return of
→ 10-years government bond (possibly with other adjustments)
• Dutch regulator uses a 3-years average of 10-years Dutch and German gov. bond
• UK regulator mixes a 10-years UK bond with an average of real yields obtained from 20-years bonds
• Regulators in developing countries use a mix of US, UK, French bonds
Define cost of debt rd
The cost of debt 𝑟d this can be estimated in various ways:
• From similar regulated companies issuing new debt
• From the estimation of experts
• From historical cost or debt of the regulated company or a portfolio of regulated companies
→ The different approaches can be run against the other to get a sense of their differences