ECON Exam 1
1/47
There's no tags or description
Looks like no tags are added yet.
Name | Mastery | Learn | Test | Matching | Spaced |
|---|
No study sessions yet.
48 Terms
How do you find marginal benefit
difference in total benefit - subtract total benefit from each other
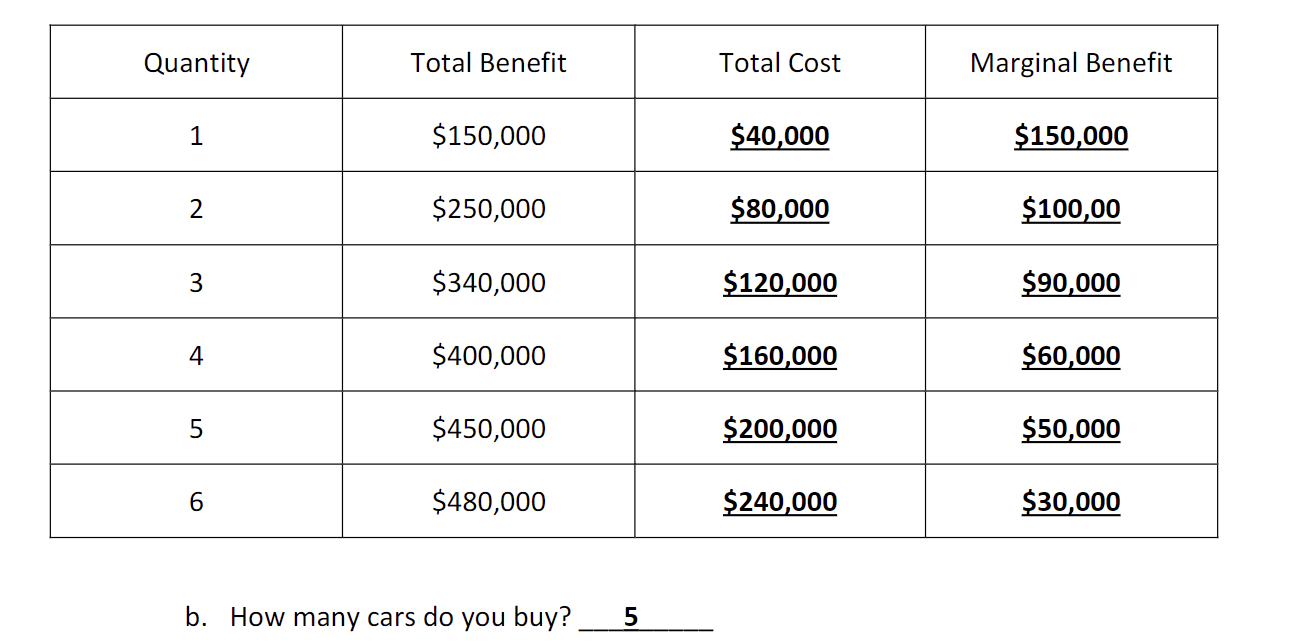
how should you know how many cars you would buy in a graph like this one
You should look for the point where the marginal benefit of purchasing a car equals the marginal cost, indicating the optimal quantity to buy. in this case 50k > 40k
how to find net benefit when looking for opportunity cost
you would take what you value something as - the actual market cost of it to determine the net benefit
how to find answers with net benefit for opportunity cost
it would be the highest net benefit you have to give up
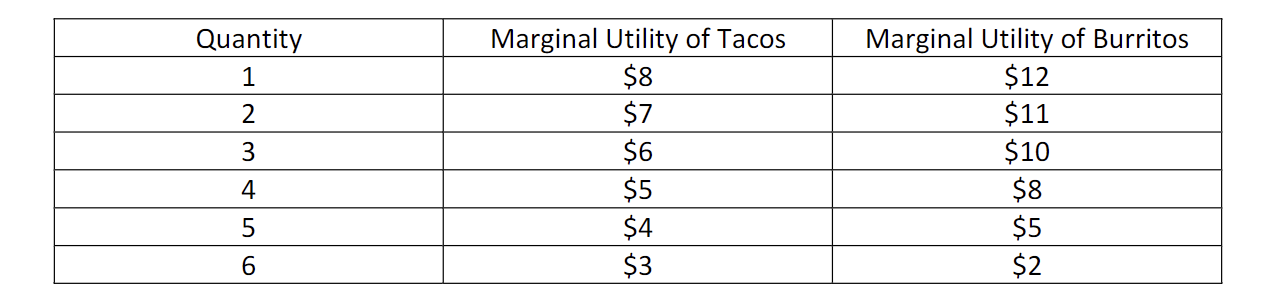
what is the opportunity cost if you buy 3 tacos and 3 burritos assuming you give up 1 taco to buy 1 more burrito
it would be 6$ because thats the marginal utility you have to give up for another burrito
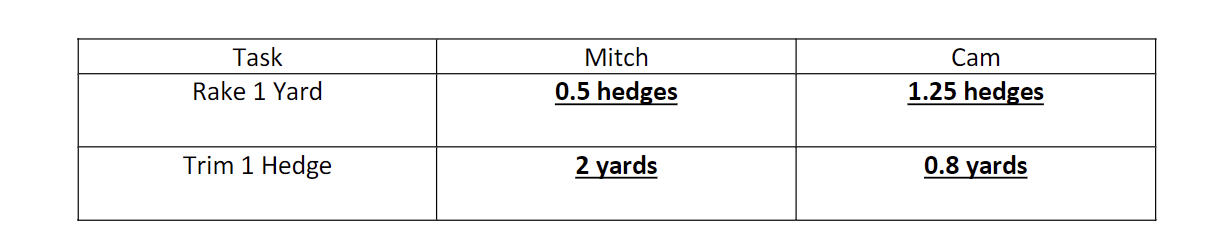
how would you find the opportunity costs of each person in this graph
dividing the times by each other (ex 30/60 for rake 1 yard and 60/30 for trim 1 hedge)
how to find comparative advantage
the lowest opportunity cost for producing a good
What is the equation of elasticity
%change in QD or QS / %change in Price
whats a perfectly inelastic curve look like
A perfectly inelastic curve is a vertical line on a graph, showing that the quantity demanded does not change regardless of price changes.
What happens to supply if the numbers of sellers increase
The supply shifts to the right showing an increase in quantity supplied at every price level.
Demand for _______ increases when income decreases.
inferior goods (because people are going to demand a cheaper option because of their income more than an expensive one)
if the price in the market for something like gasoline increases, what happens?
The supply curve will shift left because the higher cost will reduce supply of the gasoline (Up $ Down Q)
Equilibrium
a state in which there is no incentive for any agent to change his or her behavior
Market Equilibrium
the market clearing price(s) and the corresponding quantity
traded
what does a perfectly elastic supply curve look like
A horizontal line on the graph
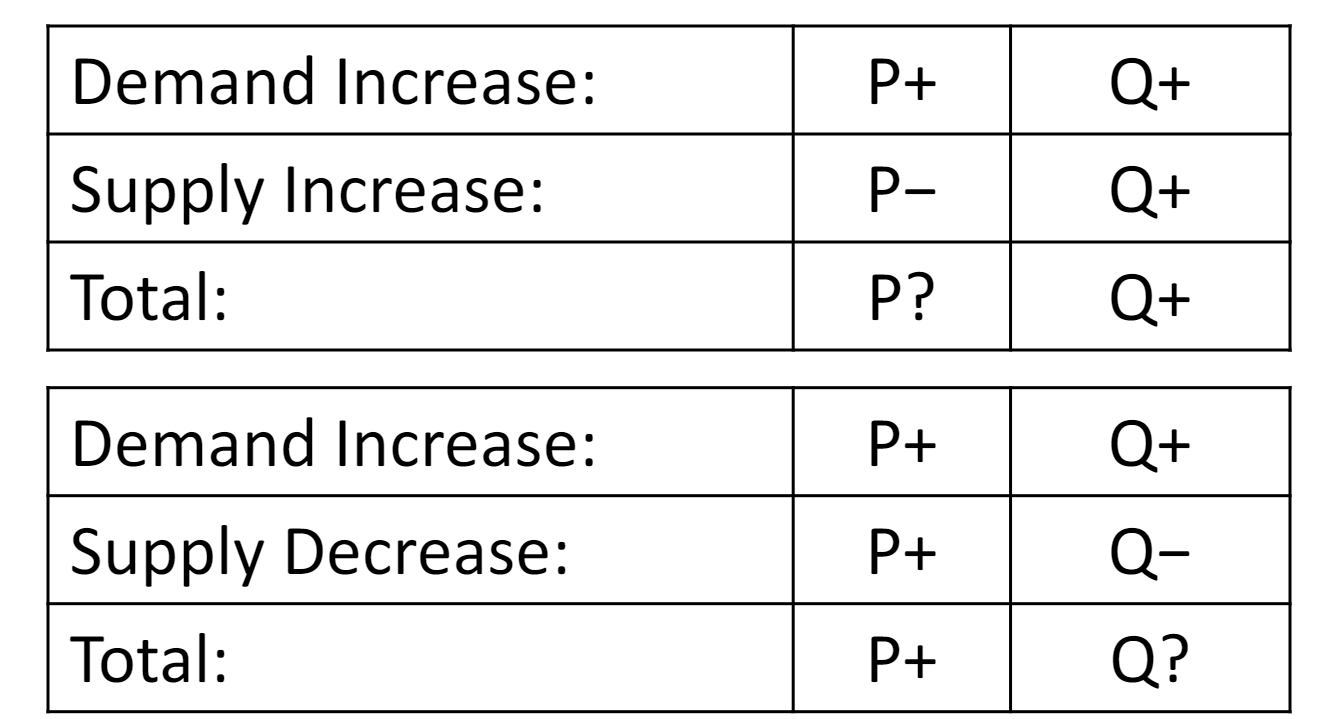
to figure out what the change in the equilibrium price is what should you do
put together a graph like this and compare the changes in supply and demand if they are different then it is ambiguous but if not determine whether it is an increase or decrease
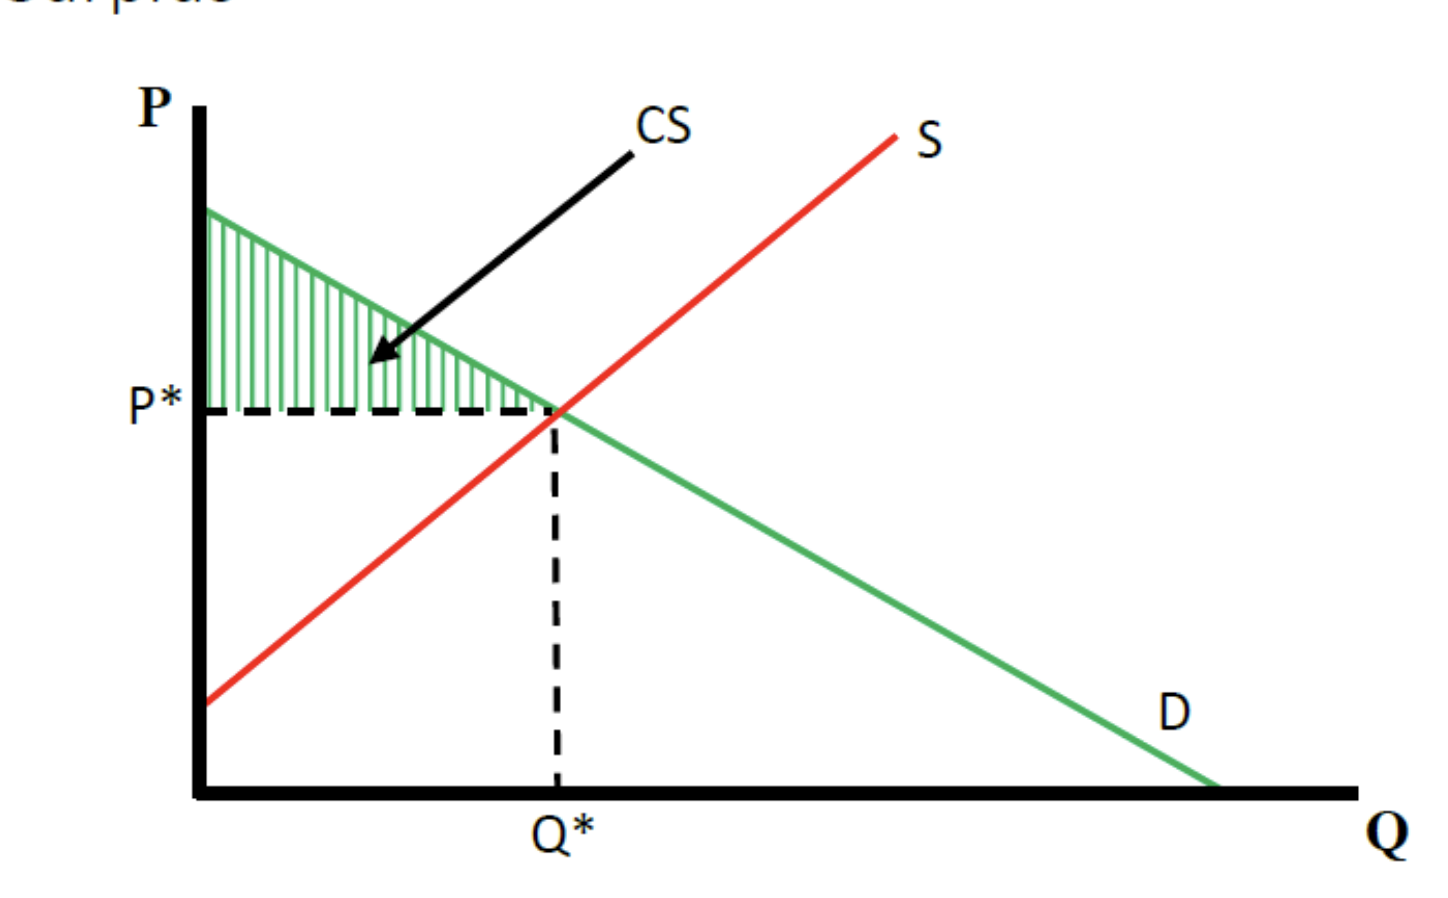
Consumer Surplus
the monetary gain to consumers because they are able to purchase the product at a lower price than their maximum buying price
what does a consumer surplus look like on a graph
what does a producer surplus look like on a graph
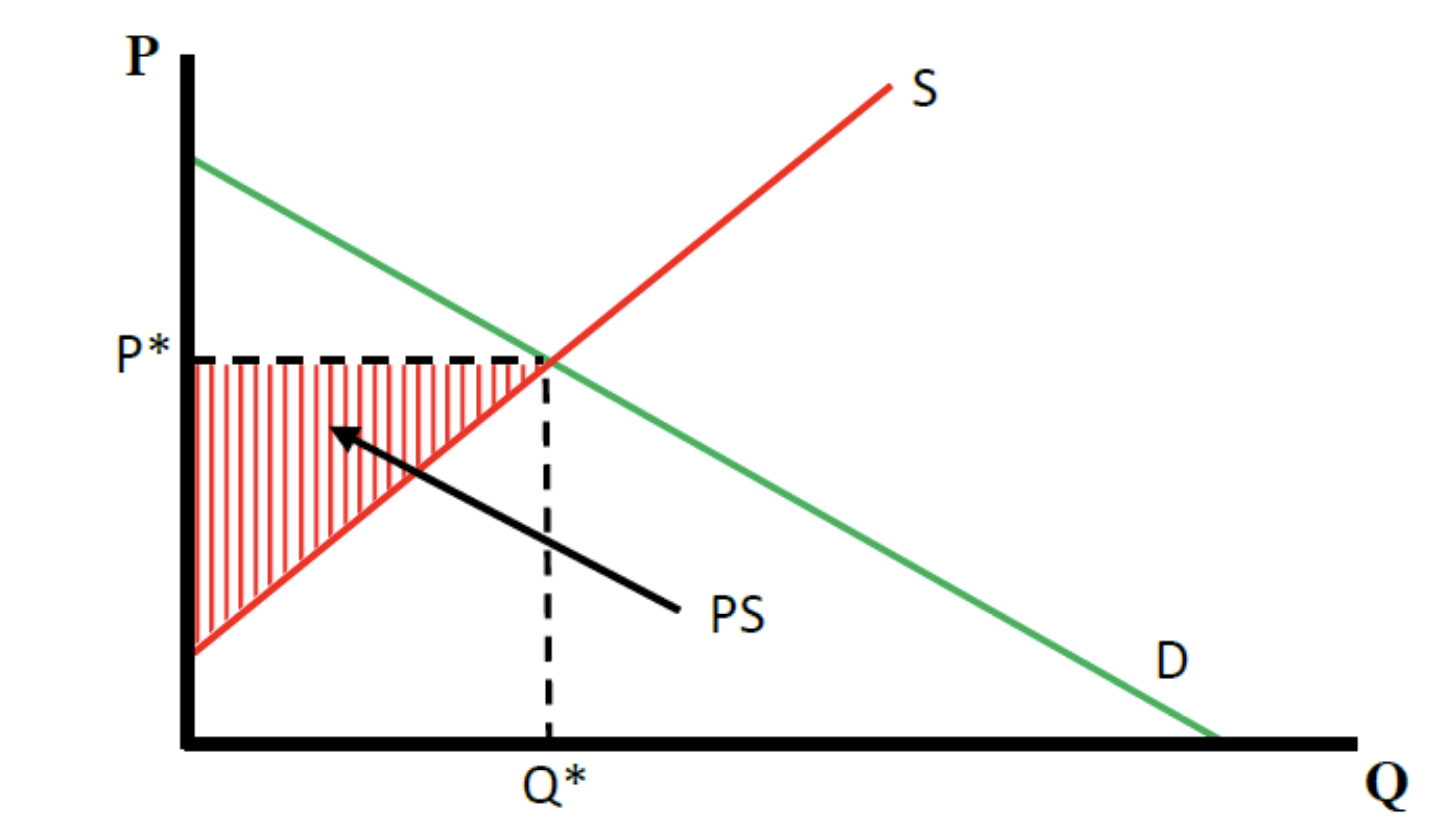
Producer Surplus
the monetary gain to producers because they are able to sell the
product at a higher price than their minimum selling price
price control
a legal restriction on how high or low a market price may go
Price Floor
– a limit on how low the price for a
product can be
• Examples: minimum wage, price supports in
the agricultural industry
what does a price floor look like on a graph
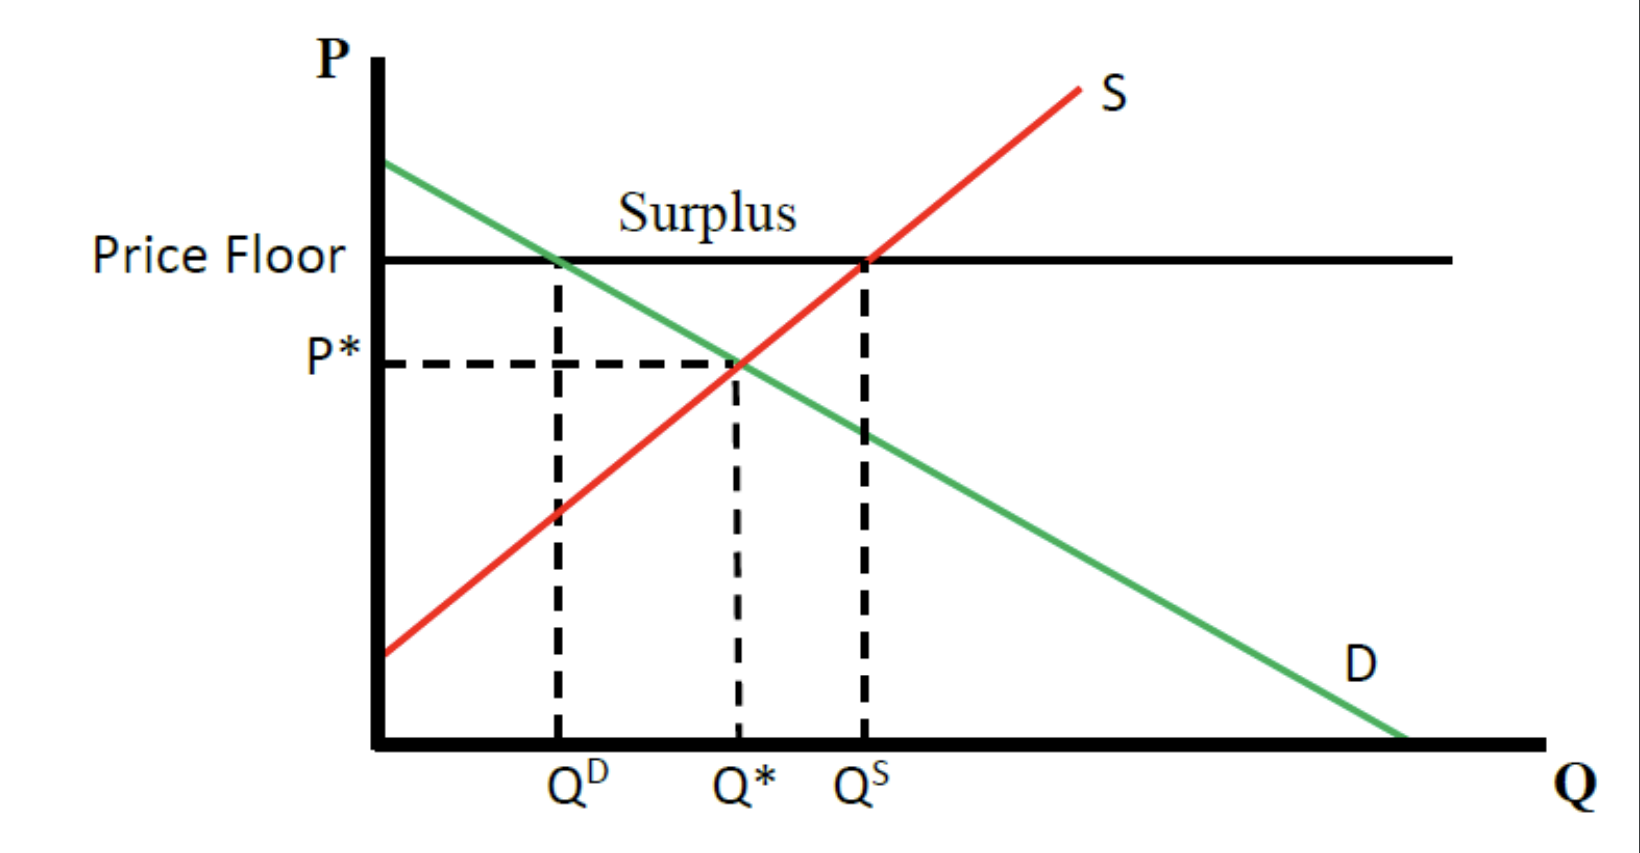
a binding price floor is ______ the equilibrium
above
a nonbinding price floor is ______ the equilibrium
below
Deadweight Loss
– gains from trade that are not being made
• Deadweight loss is present when the quantity traded in the market is below the equilibrium quantity
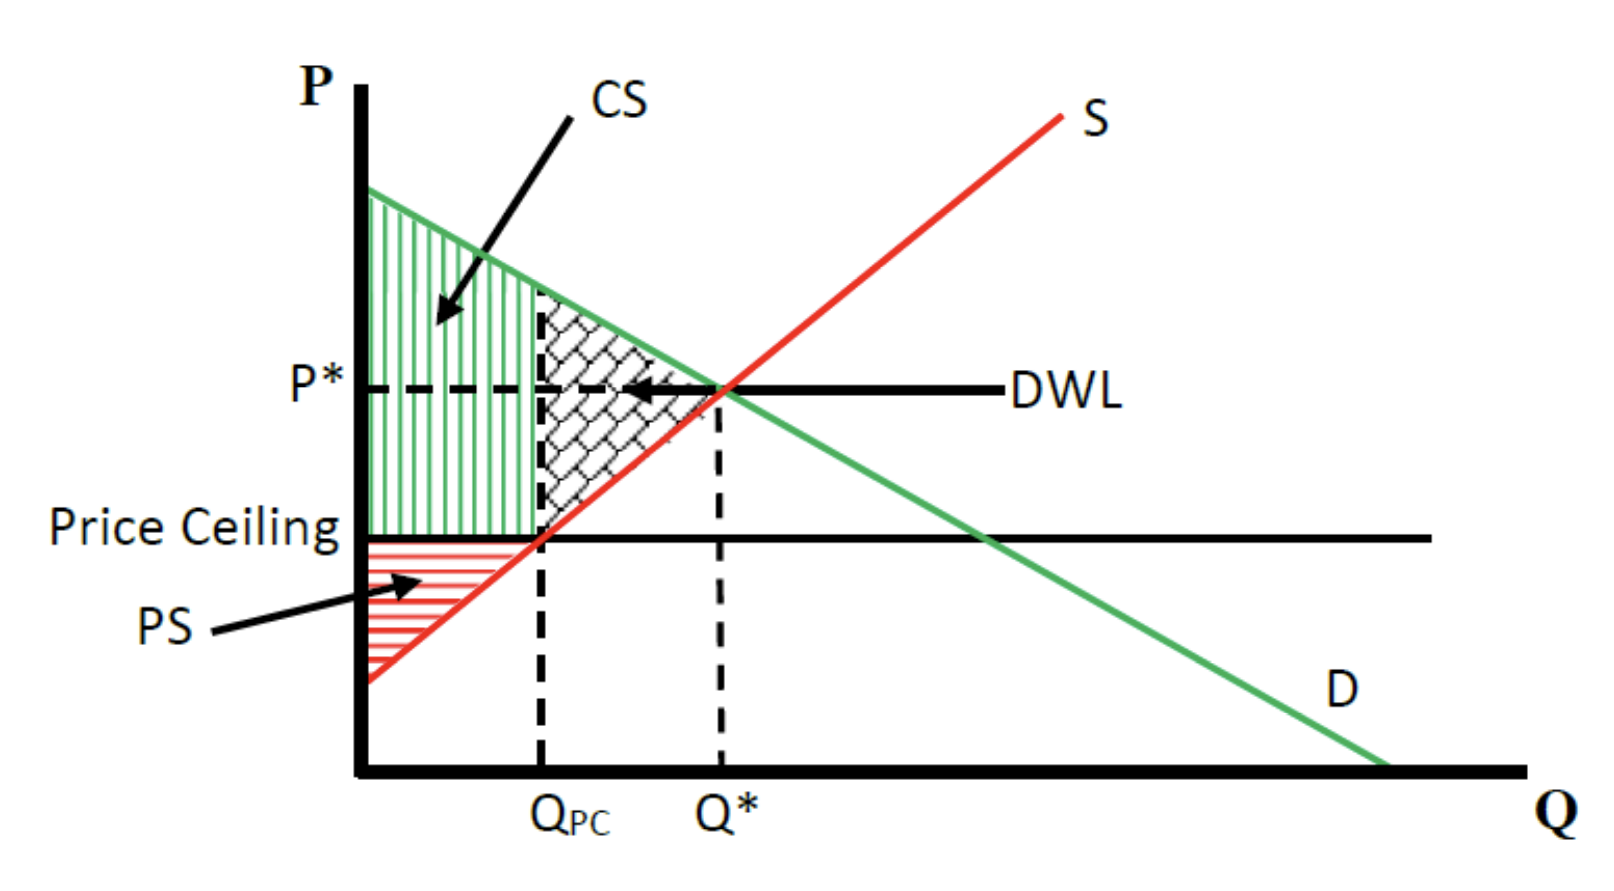
Price Ceiling
– a limit on how high the price for a product can be
price ceiling on a graph
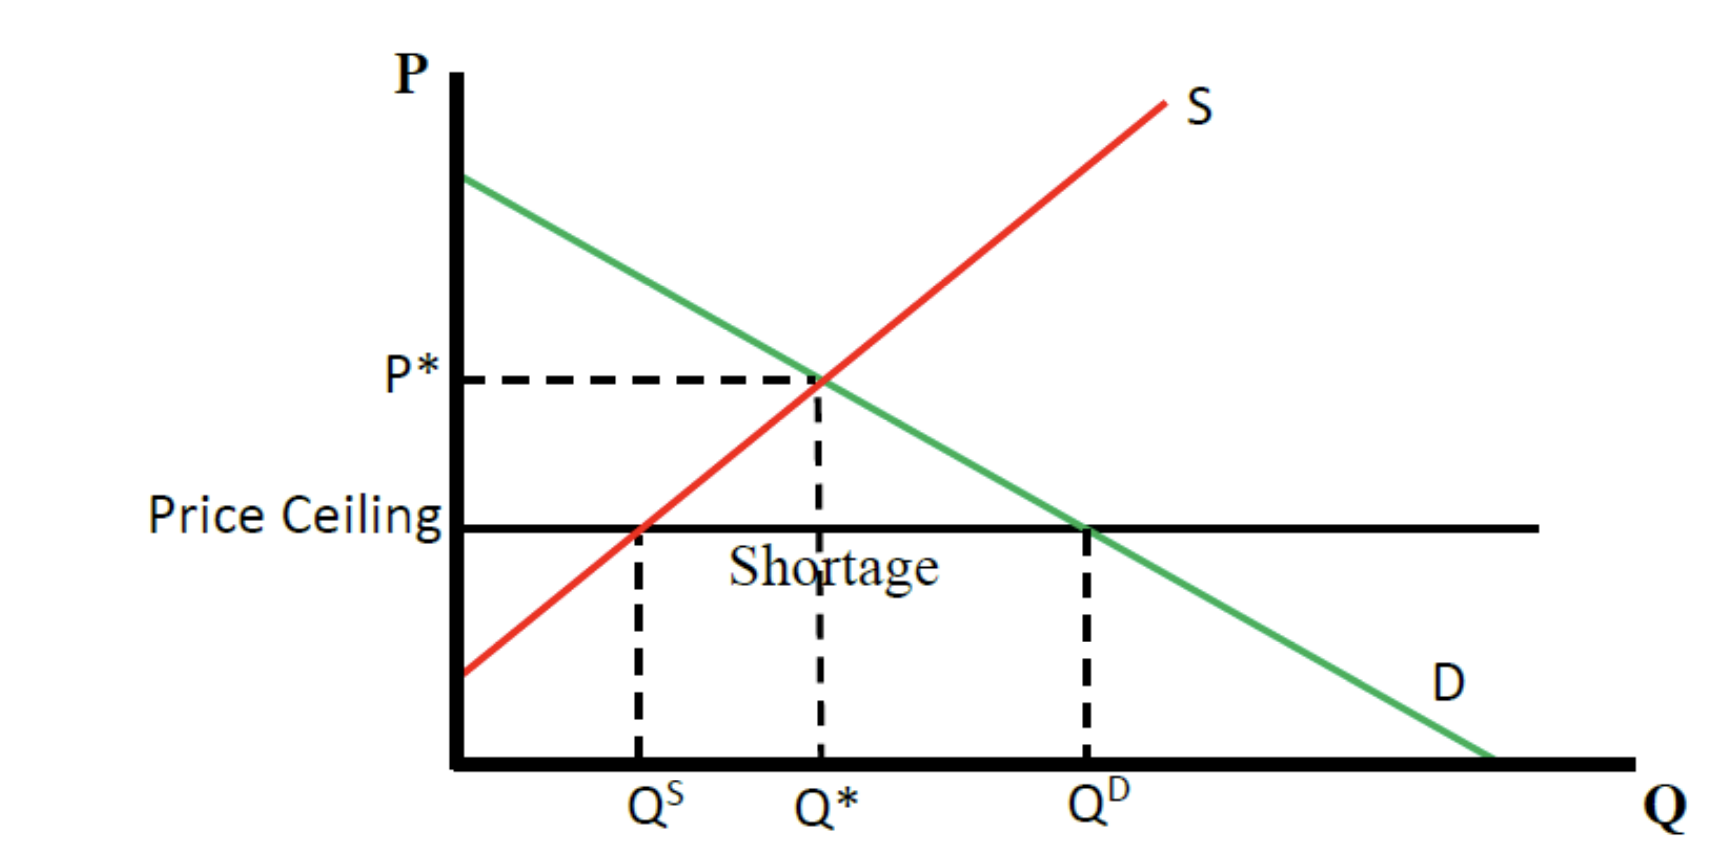
effects of a price ceiling
a price floor results in a
surplus
a binding price ceiling results in a
shortage
positive statement
a factual claim, an affirmation, or a statement that describes the world without judgment.
normative statement
an opinion or value judgment that expresses how things should be.
microeconomics
the study of how individuals and businesses make decisions when resources are limited
macroeconomics
the study of how an economy functions as a whole, including its structure, behavior, and performance
if marginal benefit is down
price utility goes down
whats a sunk cost
a cost that has been incurred in the past and cannot be recovered
price elasticity of demand is
peof x change in price
What type of analysis involves trying to describe how processes work and explain why they work that way?
Real analysis
what theory says that a person should specialize in producing the product for when they have the lowest opportunity cost
Comparative advantage
what would cause a decrease in supply of good like soda
a tax on the product would cause its supply to go down
what is the definition of marginal utility
it would be the additional utility that a person gets from having one more unit of a good or loses from having one less
if a market equilibrium price decreases and the equilibrium quantity decreases, what situation would cause this
the people exhibit a decrease in demand, possibly due to a reduction in consumer income or preferences. (ex less people driving cars)
what would cause an increase in demand in a market
An increase in consumer income, a rise in the price of substitutes, or an increase in consumer preferences or advertising can cause demand to rise or an increase in consumers