Economics 102: Macroeconomics Ch 3. Demand, Supply and Market Equilibrium
1/52
There's no tags or description
Looks like no tags are added yet.
Name | Mastery | Learn | Test | Matching | Spaced | Call with Kai |
|---|
No analytics yet
Send a link to your students to track their progress
53 Terms
Economics
is the study of how people use scarce resources in order to satisfy unlimited needs and wants
Quantity Demanded
the quantity of a good or service that an individual is willing and able to buy at a certain price
the quantity of a product or service demanded changes as price changes
Demand Schedule
a table that lists the quantity demanded for a good that people are willing and able to buy at all possibilities prices
The Market Demand Schedule
a table that lists the quantity demanded for a good or service that people throughout the whole economy are willing and able to buy at all possible prices
Which of the following statements is TRUE?
Demand for a good tends to change when you increase or decrease the price.
There is no relationship between demand and price.
Demand for a good goes down when the price goes down.
Demand for goods remains constant at all prices.
Demand for a good goes up when the price goes up.
Demand for a good tends to change when you increase or decrease the price.
Why do economists use a demand schedule?
It lists the quantity supplied for a good that people are willing and able to buy.
It is a schedule of demands that suppliers place on consumers.
It lists the quantity of a good that people demand and are willing and able to buy.
It is a schedule of when people demand certain goods throughout the year.
It shows how much of a good people would buy if money were no object.
It lists the quantity of a good that people demand and are willing and able to buy.
What is quantity demanded?
It is a description of the relationship between unemployment and quantity.
It is the quality of a good or service that consumers are looking for.
It is the quantity of a good or service supplied by producers.
It is the quantity of a good or service that is unavailable because of regulations.
It is the quantity of a good or service that consumers are willing and able to buy at a certain price.
It is the quantity of a good or service that consumers are willing and able to buy at a certain price.
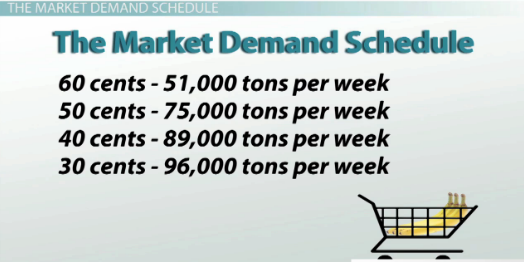
This image shows the market demand schedule for bananas. If the price goes from 60 cents to 40 cents, how many more tons of bananas will be purchased per week?
75,000
38,000
89,000
70,000
51,000
38,000
What is a market demand schedule?
It is a table that lists the quantity for a good demanded throughout the economy at many different prices.
It is a table that shows the price that suppliers are willing to sell.
It is a schedule that shows the demand for a particular good in one location only.
It is a table showing the unlimited desires of consumers.
It is a schedule of when markets are open and closed.
It is a table that lists the quantity for a good demanded throughout the economy at many different prices.
Supply
the relationship between the quantity of a good service and its price
how much is available for sale in market
Quantity Supplied
is how much of a good or service sellers are willing and able to supply at a particular price
Supply Schedule
a table that illustrates how much of a good or service suppliers are willing and able to supply at many different prices
The Market Supply Schedule
a table that lists the quantity supplied for a good or service that suppliers throughout the whole economy are willing and able to supply at all possible prices
What is quantity supplied?
It is only useful in a command economy.
It is how much of a good or service that sellers are willing and able to supply at a particular price.
It refers to the quality of goods and services in an economy.
It is how much of a good or service that consumers are willing and able to buy.
It is how much money consumers want to borrow in an economy.
It is how much of a good or service that sellers are willing and able to supply at a particular price.
What is a market supply schedule?
It is based on the schedule of holidays for Federal employees.
It is a table that lists the quantity supplied for a good or service at a single price.
It is a table that lists the quantity supplied for a good or service at different prices in one local area.
It is a schedule of when markets will demand goods and services throughout the year.
It is a table that lists the quantity supplied for a good or service at different prices throughout the economy.
It is a table that lists the quantity supplied for a good or service at different prices throughout the economy.
How do economic drivers relate in the supply of a good or service?
The drivers remains constant regardless of the price charged for it.
There is a relationship between the quantity of a good or service and its price.
There is a relationship between the quality of a good or service and its tax rate.
There is a relationship between demand and taxes.
There is a relationship between how much of the good or service consumers are willing and able to buy.
There is a relationship between the quantity of a good or service and its price.
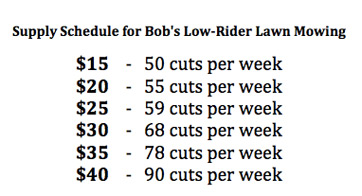
The image shows the supply schedule for Bob's Low-Rider Lawn Mowing services. Which of the following statements is true regarding the supply of lawn cuts at a price of $25?
Bob would be willing to cut more lawns if the prices were lower.
Bob is willing and able to cut 39 lawns per year
Bob is willing and able to cut 50 lawns per week.
The supply of lawn cuts remains constant at all prices.
Bob is willing and able to cut 59 lawns per week.
Bob is willing and able to cut 59 lawns per week.
Which of the following statements is FALSE regarding a supply schedule?
It is a table illustrating quantities supplied.
It shows you how much of a good or service is supplied at one price only.
It illustrates what's happening with the supply of a good or service.
It is unique and different from a demand schedule.
It includes quantities supplied at many different price levels.
It shows you how much of a good or service is supplied at one price only.
Economics
the study of how people use scarce resources in order to satisfy unlimited needs and wants
Law of Demand
if the price of a good or service goes up, the demand for it will decrease, and if the price of a good or service goes down, the demand for it will increase
Demand Schedule
a table illustrating the quantity demanded for a good or service at different prices
The Substitution Effect
the price of one good goes down enough so that it becomes cheaper than something else
The Downward Sloping Demand Curve
a graph that illustrates the relationship between price and quantity demanded for a good or service
Demand Shifters
variables besides price that cause a shift in demand, whether it’s an increase or a decrease
What is the correct relationship between price and quantity demanded shown by the law of demand?
when prices go up, demand goes up
when prices go up, demand stays the same
When prices go down, demand goes up
there is no direct relationship between price and demand
when prices go down, demand goes down
When prices go down, demand goes up
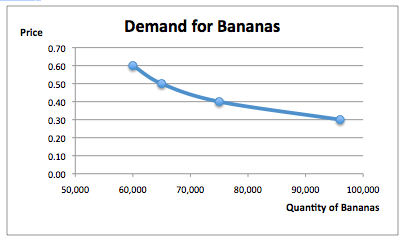
The demand curve below shows the demand for bananas at different prices. According to this demand curve, what quantity of bananas would be demanded at a price of 40 cents?
65,000 bananas per week
no bananas would be sold at this price
96,000 bananas per week
75,000 bananas per week
60,000 bananas per week
75,000 bananas per week
Which of the following statements is inaccurate regarding the demand curve?
A visual representation of the demand schedule
A change in the price of a good is represented by movement along the curve
It shows quantity demanded at different prices
It is upward sloping
It is downward sloping
It is upward sloping
Which of the following factors would NOT lead to a shift in the demand for an item?
Changes in demographics and preferences
Income
Prices of unrelated goods
Expectations
Prices of substitute goods
Prices of unrelated goods
What does the law of demand state?
The demand for goods and services are fixed
As price decreases, quantity demanded decreases
As price increases, quantity demanded decreases
As price increases, demand increases
As price decreases, demand decreases
As price increases, quantity demanded decreases
Supply Schedule
a table illustrating the quantity supplied for a good service at different prices
The Upward-Sloping Supply Curve
a graph that illustrates the relationship between price and quantity supplied for a good or service
Supply Shifters
factors that cause a shift in supply
prices of inputs
technology
the number of sellers in the market
returns from alternative activities
seller expectations
nature disasters
Which of the following statements is FALSE regarding the supply curve?
It is upward-sloping
A change in price results in movement along the curve
It is downward-sloping
It is a visual representation of the supply schedule
It is a graph illustrating the relationship between price and quantity supplied
It is downward-sloping
The _____ of a good, the _____ that suppliers are willing and able to supply.
lower the price, easier
greater the price, larger the quantity
lower the price, larger the quantity
higher the quality, lower the tax
greater the price, lower the quantity
greater the price, larger the quantity
A shift in the supply of a good or service is impacted by all of the following except:
prices of inputs and returns from alternative activities
the number of sellers in the market
technology
seller expectations
consumers' expectations
consumers' expectations
An improvement in technology affecting businesses in country A will most likely lead to which of the following?
A change in consumer preferences for shoes
An increase in the supply of goods and services in country A
A recession
A decrease in the demand for goods and services in country A
A decrease in the supply of goods and services in country A
An increase in the supply of goods and services in country A
A natural disaster strikes country A, destroying bakeries across half of the country. How will this affect the supply of cakes?
The supply of cakes will remain the same
There is no connection between natural disasters and supply
The supply of cakes will remain the same in the short run and increase in the long run
The supply of cakes will increase
The supply of cakes will decrease
The supply of cakes will decrease
Demand Curve
quantities of goods buyers are willing and able to buy
Supply Curve
quantities that sellers are willing and able to sell
Market Equilibrium
quantity demanded = quantity supplied
Surplus
quantity supplied exceeds the quantity demanded
Shortage
quantity demanded exceeds the quantity supplied
Which of the following statements is NOT true regarding the market equilibrium?
Unless something causes a shift in supply or demand, it will not change
It is the only price at which quantity demanded exceeds quantity supplied
It is where quantity demanded equals quantity supplied
It is found at the intersection of the supply and demand curves
It is the only price at which quantity demanded exceeds quantity supplied
When a market price is set below the market equilibrium price, a _____ exists, which will _____.
shortage, create downward pressure on the price
shortage, create upward pressure on the price
surplus, create downward pressure on the price
surplus, create upward pressure on the price
supply, increase the amount of goods and services available
shortage, create upward pressure on the price
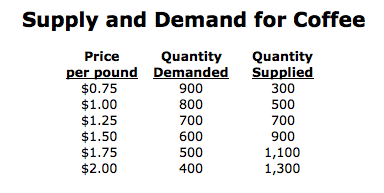
The image illustrates the supply and demand for coffee. What is the equilibrium price (per pound) and quantity (pounds)?
$1.50, 600
$1.00, 800
$0.75, 900
$2.00, 400
$1.25, 700
$1.25, 700
When a market price is set above the market equilibrium price, a _____ exists, which will _____.
shortage, create downward pressure on the price
supply, increase the amount of goods and services available
surplus, create upward pressure on the price
surplus, create downward pressure on the price
shortage, create upward pressure on the price
surplus, create downward pressure on the price
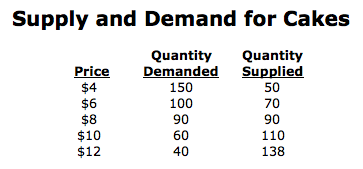
The image is a demand and supply schedule for cakes. What is the market equilibrium price?
not enough information to answer
$10
$6
$4
$8
$8
Equilibrium
price at which the quantity demanded by consumers is equal to the quantity supplied by suppliers
A shift of the supply curve to the right indicates which of the following?
An increase in supply, which results in a higher equilibrium price.
An increase in supply, which results in a lower equilibrium price.
A decrease in supply, which results in a higher equilibrium price.
A decrease in supply, which results in a lower equilibrium price.
An increase in supply, which results in a lower equilibrium price.
What does a shift of the demand curve to the right indicate?
A decrease in demand, which results in a lower equilibrium price.
A decrease in demand, which results in a higher equilibrium price.
An increase in demand, which results in a lower equilibrium price.
An increase in demand, which results in a higher equilibrium price.
An increase in demand, which results in a higher equilibrium price.
What happens when the demand for a good and the supply of that good increase simultaneously?
The new equilibrium price and quantity will definitely increase.
The new equilibrium price and quantity will definitely decrease.
The new equilibrium quantity will rise, and the new equilibrium price may or may not change.
The equilibrium price and quantity will remain the same.
The new equilibrium quantity will rise, and the new equilibrium price may or may not change.
The market for coffee is currently in equilibrium. If the demand for coffee decreases, which of the following would LEAST likely happen?
The equilibrium price would be lower.
The demand curve would shift to the left.
The demand curve would shift to the right.
A new equilibrium would arise at the intersection of the supply and demand curves.
The demand curve would shift to the right.
An increase in household incomes across the nation leads to an increase for the demand for coffee. How would the demand/supply curve change?
A rightward shift in the demand curve for coffee.
A leftward shift in the supply curve for coffee.
A leftward shift in the demand curve for coffee.
A rightward shift in the supply curve for coffee.
A rightward shift in the demand curve for coffee.