Development economics - RQ
1/62
There's no tags or description
Looks like no tags are added yet.
Name | Mastery | Learn | Test | Matching | Spaced | Call with Kai |
|---|
No analytics yet
Send a link to your students to track their progress
63 Terms
Please give some reasons why food only constitutes about ½ to ¾ of the total consumption expenditure for the extremely poor people in the world
nutrition only explains a very small part of health gains
they also spend on durable goods, entertainment and save
other goods like entertainment probably a network effect
Banerjee and Duflo
Please give some reasons why the extremely poor people in the world are often involved in many occupations
Low skills
credit restrictions → cant scale one company so multiple
risk spreading, not quitting ag-job in case industry sector goes wrong
not wasting time
Please explain the referencing problem in theoretical poverty analyses and explain how the referencing is “solved” in practice using the cost-of-basic-needs method.
We use consumption expenditure with reference prices as a measure of wellbeing and seek the threshold between poor and non-poor
Problem: Finding the threshold and is it
Absolute
Relative
Note: economic theory has very little to say here
Ravallion argues that the choice depends on the purpose
By using the cost-of-basic needs method creates a poverty line that is the bare minimum of what you can survive on - “objective” poverty
need nutritional requirement for good health
what does it cost
adding non-food component - usually found from share used by reference group
absolute poverty line can be found from engel curve regression
Please explain the identification problem in theoretical poverty analyses and explain how the problem is “solved” in practice in most poverty measurements developing countries.
we measure poverty on individual level but consumption is on HH level
Developed countries: use equivalent income (take EofS and children eat less into account)
Developing: HH consumption / size of HH
Explain the concepts strongly relative versus weakly relative poverty lines and describe the problems with each respective measure. Outline a possible solution to the problems.
strongly relative: poverty is solely based on the median/mean income → if everyones income increases 5% → no change in poverty
assumes elasticity of 1, empirically 0.5
weakly relative: base of absolute poverty → if everyones income increases 5% → change in poverty
you can be poor in the context of the world or your country
if median income < absolute poverty line then you have an issue
solution: hybrid
Give some reasons why GDP may fail to measure value added in a country
GDP does not take the main “freedoms” into account
political, social, transparency guarentees, protective security
GDP may decline if leisure expands (reduced market participation)
GDP can expand through increasion resource extraction
Market prices may not be the right prices (externalities)
GDP has no information about the distribution of income and wealth
Briefly explain the difference between exchange rate conversion and PPP conversion of GDP.
exchange rate conversion: purchasing power in the currency market
PPP: purchasing power on the goods markets
Using the information in PRLB Table 2-1, use Indian prices to calculate GDP for US and India in PPP Rupees. Comment on the result relative to using US prices and USD
(India steel price)*(US quantity of steel)+(India retail price)*(US quantity of personnel)
Based on the growth rates presented in Table 2-3. How many years would it take for the average country in each region to double its GDP per capita if it grew as recorded in the 2000s?
half-time: T_2 = log(2)/log(a)
Explain the so-called Easterlin paradox
incomes rise, but happiness does not (found from US survey data). Raised concerns of using GDP as a measure for well-being.
Explain briefly whether the Washington Consensus was consistently grounded in economic theory or should more be considered as a policy paradigm
incentivizing market-liberalization - from the white paper that formed the WC did not reflect the nuance of the paper itself
mostly based on economic theory rather than empirical proven strategies, the WC also did take into account some important issues in economic theories
didnt consider the fact that many developing countries have multiple market failures, which is well known to dismantle the standard neo-liberal analytical framework - it rather stated that any market failures were not ”serious”
developed standards for all economies without taking into account different initial stages of development, and therefore ignored the negative ”late development effect”.
common knowlegde that it is important to differentiate between conditional and unconditional convergence (as well as diminishing growth rates over time).
→ purpose of the WC was not entirely consistent with the underlying economic theory, but rather another goal: to promote the US (and
OECD) position, based on ’dependency theory’ (i.e. financial aid on form of debt) rather than a fully formed development policy→ policy paradigm
Outline the six common elements of sustained growth experiences, and highlight which channel was under-emphasized in the Washington Consensus strategy.
macroeconomic stability
high levels of investments and saving
good leadership and governance
success in exploiting the international market for technology/knowledge (facilitating environments for spillovers)
diversified outward orientation - advancing economic complexity
allowing the market to play a role in resource allocation
managing the distributional aspects of growth patterns to put boundaries on inequality in various dimensions
Didnt take good institutions into account → ton of market failures they ignored
Please explain briefly, why intra-household inequality may be a source of bias in survey-based estimates of inequality and state if the bias is positive or negative
Men dont take the woman’s income into account when estimating the HH income → negative bias
Please explain how it is possible to argue that:
- Global inequality has increased from around 1980 to around 2000
- Global inequality has decreased from around 1980 to around 2000
- Global inequality has been roughly constant from around 1980 to around 2000
three measure of global inequality
“Naive” unweighted average of Gini → inequality has risen
Weighted average of Gini → equality has risen
Gini for the entire world as 1 country → inequality unchanged (calculated for much fewer years)
Please explain how income inequality may affect the accumulation of physical
capital.
Clsasical theory by Kaldor: richer families have higher savings rates - Therefore, redistribution in favor of the rich increases savings and thereby accumulation of physical capital
Please explain how income inequality may affect the accumulation of human capital.
Human capital is not transferrable. If accumulation of human capital is costly - and we have capital market imperfections or restrictions - then poorer people with underinvest in human capital
Please describe the difference between absolute and relative inequality
Absolute inequality: depends on absolute differences in levels of living
- is unchanged if all incomes increase by the same amount
Relative inequality: a function of the ratios of individual incomes to the mean
- if all incomes are multiplied by a constant then inequality is unchanged
Please explain how to easily test the poverty-inequality relationship. Comment on
the empirical relationship between:
a. Absolute Poverty and Absolute Inequality
b. Absolute Poverty and Relative Inequality
The Econometric test by Ravallion. Question: is there an unconditional correlation between poverty and (absolute and relative) inequality?
The Ravallion "trick": Study the changes over time in both measures of poverty an inequality.
Assumption: controlling for fixed effects with adequately sweep away any extraneous other factors at country level
Measures used: relative inequality: Gini, absolute inequality: Gini controlling for mean income or consumption = absolute Gini-index
a. Absolute Poverty and Absolute Inequality
Trade-off. Negative correlation.
Lower absolute poverty is associated with higher absolute inequality.
b. Absolute Poverty and Relative Inequality
No trade-off. There is a positive correlation.
Economic growth shows little correlation with changes in relative inequality.
Please explain what is meant by the notion “conditional convergence” and clarify how
it differs from “unconditional convergence”
all else equal, poor countries have the potential to grow faster than rich ones
as countries become richer, growth rates tend to slow
as consequence of 1 and 2 → income levels of rich and poor countries should converge - all else equal
Conditional: depends on if the parameters are the same
Unconditional: regardless → signs of it recently
Please define and explain the development and growth accounting, respectively
growth accounting: decompose the growth into contributions from differing factors.
development accounting: decomposing development indicators with respect to some benchmark, usually the US economy.
Assume final goods are produced according to the Cobb-Douglas production function. Using the information in Table 1, please calculate the sources of growth (annual average growth rate) for the BRIC countries. Choose two African countries of your own choice from the pwt100.dta file and do the same calculations. Comment briefly on the results
Done in excel
growth:
what is driving their growth
Assume final goods are produced according to the Cobb-Douglas production function. Using the information in Table 1, please calculate the production per person engaged (y) and the productivity (A) relative to USA for the BRIC countries in 2000 and 2019. Choose two African countries of your own choice from the pwt100.dta file and do the same calculations. Comment briefly on the results.
Done in excel
Development:
the importance of the levels of the factor variables
Please describe the 4 stages of the demographic transition.
both high birth and death rates
death rates declining faster than birth
birth rates declining faster than deat
zero population growth (again)
TODAY: almost all population growth in high-income countries is attributable to immigration
Please outline and describe the 3 scenarios for how total fertility rates can stay
above replacement rates.
Desire for large families
a failure to achieve the desired number of children (so-called unwanted children)
Population momentum
Please describe likely causes of the mortality and fertility transitions, respectively and discuss the sequencing of the transitions
What caused the mortality transition?
nutritional improvements
improvements in sanitation
technology (germ theory early on)
Fertility transition?
Income and substitution:
low level of income → income effect dominates, the relative cost of time with children is low
high level of income → substitution effect, the children costs too much time compared to the value of work
Mortality:
more children to reduce risk of them all dying
as mortality decreased → risk decreased → the no. of children to have for the E(living children)>1 decreased
Quantity/Quality:
accelerating technological changes increases return to skill investments. Better children > many children
The evidence points to the mortality transition happening first and the fertility transition following, this reinforces som of the theories regarding the changes in fertility.
Outline the basic ideas of population pessimists versus population optimists
Population pessimists:
The most basic reason why population growth may reduce prosperity is Capital Dilution
Key reasons why population growth may lower prosperity:
Limits physical capital per capita (capital dilution) and thus labor productivity
Limits natural resources per capita (fixed factor) and thus labor productivity (extended Solow model)
Population optimists:
Reasons why a bigger population (or population growth) may be good for growth
Division of labor (Adam Smith)
Technology adoption in the presence of population pressure (Ester Boserup)
More people, more ideas / non-rivalry of ideas (Phelps-Jones)
Outline the likely estimation biases faced when analyzing the relationship between population growth and income.
n = f – d (f=fertility, d= death). Slower n could be caused by higher d as well as lower f.
Fertility influenced by income (simultaneity bias)
Being poor can also lead to population growth (Q-Q theory). (omitted variable bias)
Describe using a Solow model framework how migration is likely to influence capital accumulation (including the underlying assumptions). Consider both the case where migration is “just” influencing population growth (n) as compared to the situation where migrants is assumed to bring productive capital.
same as usual,but M is introduced which is the net-flow of immigrants
kappa is the amount of capital each immigrant brings in
for given conditions in other economies:
k increases → m increases
reduction in wage rates in foreign countries → migration to domestic more attractive → m(k) shifts up
slope of m(k): relation between cost of moving and the volume of migration
if cost increases rapidly with no. of immigrants then curve is relatively flat
if migrants bring 0 capital they have a more negative effect than otherwise
lower k* and higher m* as it must be a result of worse conditions in outside world
Outline the 4 important questions to ask when evaluating traditional migration models against empirical evidence?
Did migration arise from failed economic development in poor countries?
just the opposite: mexicans are not in the US because Mexico fell into poverty, but because Mexico emerged from poverty
did more migration result from a retreat of trade and capital flows?
just the opposite: they soared during the same year.
Did initial waves of migration reduce the incentive for further migration by spatially equilibrating the labor market?
just the opposite.
Did the large rise in migration from the developing world substitute for workers in the destinations? NO
But it did course wage pressures in origin countries.
+ remittances higher than aid and causing lasting increases in human capital improvements.
Did migration typically select for the least productive workers? NO
Did more migration substitute for other forms of globalization via factor-price equalization? NO
Global wealth increased and modestly reduced (between country) inequality as a result of migration.
But moderate increases in (within-country) inequality at the destinations as a result.
Please explain the difference between the gross and the net enrollment rate and explain how the
average primary gross enrollment rate can be larger than 100%.
\textit{The gross enrollment rate:} The number of children enrolled at a particular level of education, regardless of age, as a percentage of the population in the age group associated with that level
\textit{The net enrollment rate:} The number of children enrolled at a particular level of education, who are of the age associated with that level of schooling, as a percentage of the population in the age group associated with that level
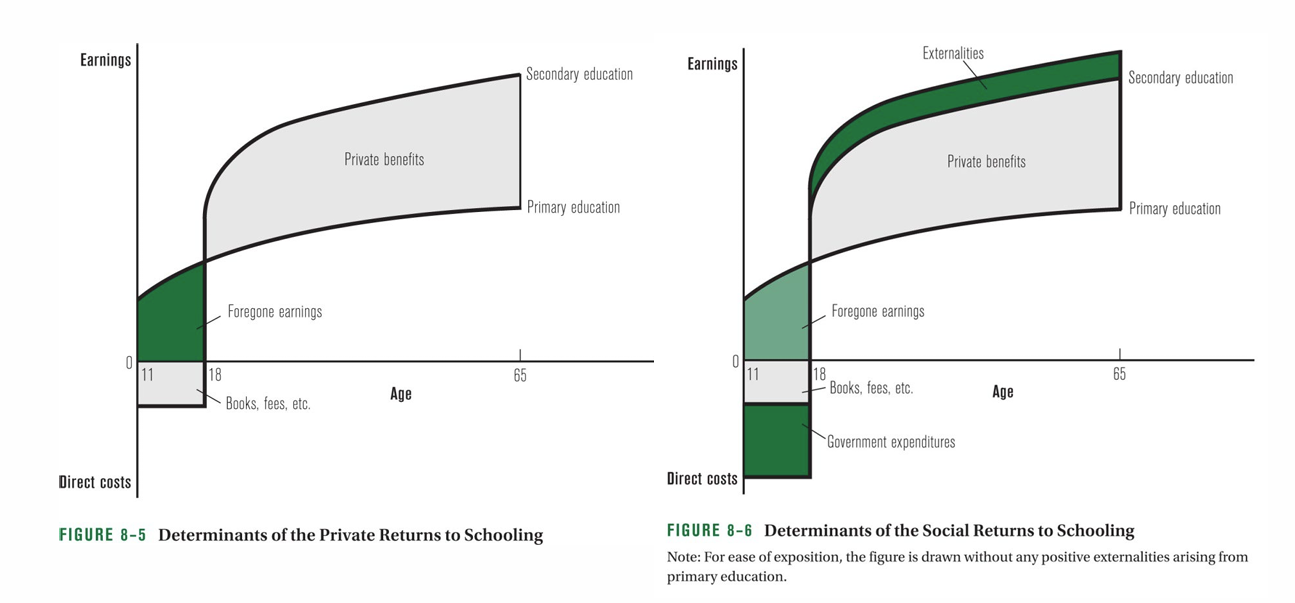
Please explain (graphically) the Mincerian investment decision in education.
The long term primary benefits shall be larger than the lost in income from taking the education (alternative cost) as well as the cost of the education itself. The problem can also be made as a social problem, that includes government spending as the cost as well as positive externalises in the benefits (here it should be noted that government spending are/become much larger for the tertier education than the externalety).
Please give three examples of problems of school funding in developing countries
developing countries underfund education compared to developed countries
developing countries spend relatively too much on tertiary education
resources for primary education have huge leakage problems moving from the central government to the local schools
aid donors have too strong preferences for buildning new schools rather than funding current expenditures on education
Please illustrate and describe the 3 main lessons learned from the Preston Curves.
People in rich countries can expect to live longer than people in poor countries
The curve has shifted up throughout the years → income is not the only thing that affects health. if only income they would have just shifted along the curve
In the 2000s there are several countries where life expectancy is substantially lower than its predicted level. Have the technological improvements of the last 70 years passed over these countries? Disease (HIV/AIDS, malaria, TB) and lack of ”oil benefits”?
Please explain the theoretical relationship between health and education using the envelope theorem.
health affects both benefits and costs of education
Implies that improvements in health affect income by making human capital more productive - but not via more investment (Bleakley, 2010)
Lifetime income rise because childhood health allows you learn faster and grow up stronger
Health can increase investments, but the discounted change in lifetime income from such investment will be zero if the marginal benefits and costs of schooling are in equilibrium (equal)
Years of schooling is not a sufficient statistic for measuring the impact of (early-life) health on lifetime income
It is possible that when health improves, lifetime income goes up, but years of school declines (if healthy kid raises wages more than the returns to the schooling
→ we should focus on measuring first order effects of health interventions. Whether the other (h) related inputs are substitutes or complements is of secondorder importance.
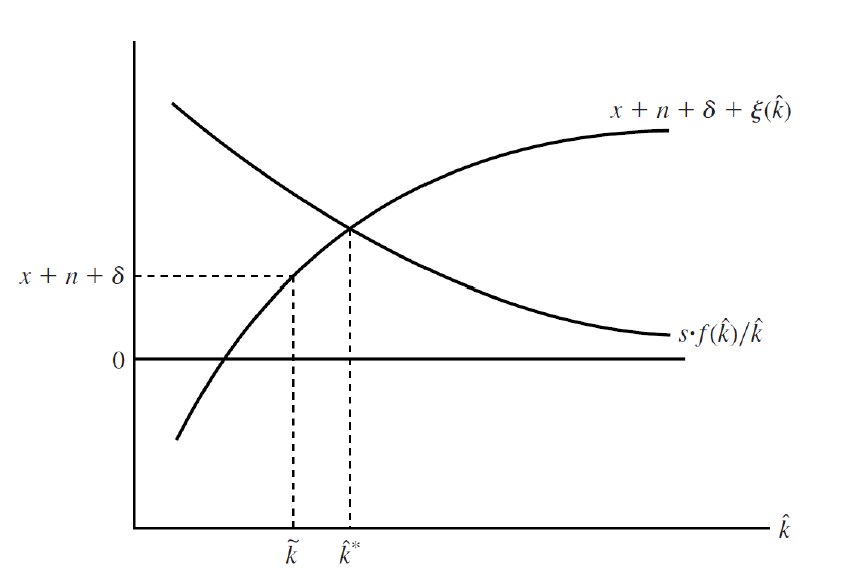
Please describe at least two reasons for why savings rates differ across countries, and briefly explain each of the reasons/implications for development policy?
Endogenous:
saving rates rise with development: as income rises so does savings rates:
if poverty: almost everything is consumed
beyond: savings can rise
Solow model: as capital stock rises, so does y, lowering poverty → savings rate rises
multiple SS: the root cause of poverty is poverty
potentially big policy implications
Differences between low, middle income and rich countries is due to differences in s?
Exogeneous:
two examples:
Life cycle theory: you save for old-age retirement, based on expected life-time income
rising life-time income (growth) means younger cohorts save more than older cohorts
Implication: faster growth may induce a greater savings ration
Changing composition of the population
early stages of development: rising share of (saving) young people → savings rises
later stages of development: rising share of (dissaving) old → savings fall
Government savings: Tendency for G savings to be higher in rich compared with poor economies
Size of G sector is larger in rich countries
BUT: difficult to ascribe to the growth process per se; income elasticities in government consumption <1
Overall impact on savings: depends on the extent of which Ricardian equivalence holds
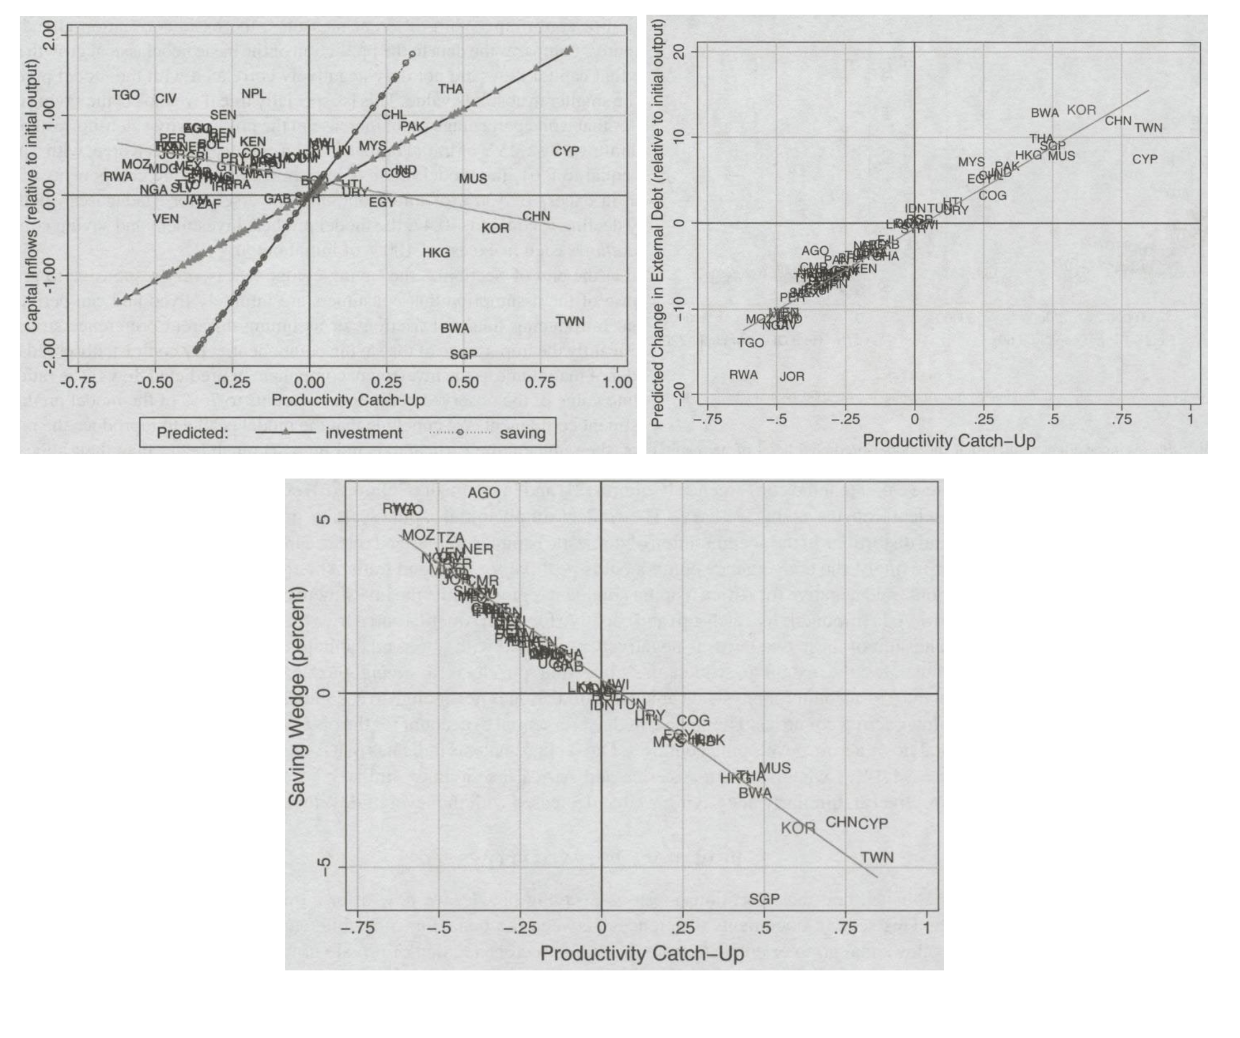
Based on the 3 figures below explain the allocation puzzle and whether it is an investment or a savings puzzle.
the correlarion between productivity growth and net capital inflows is zero at best (maybe even negative)
Method:
diagnostic tool that points to the first-order conditions (FOCs) that exhibit the largest discrepancies in the data
trying to understand these FOC discrepancies can guide us to ways in which we may solve the puzzle
Strong negative correlation between the savings wedge and productivity catch-up
countries that subsidize savings are the ones that catch-up while countries taxing savings are countries that fall behind
→ THE ALLOCATION PUZZLE IS A SAVINGS PUZZLE
Please outline and describe the main pros and cons of attracting FDI.
Pros
increases total investment
increases foreign exchange reserves
increases tax revenue
transfers technology
Cons
lowers domestic savings - thereby lowering total investment
decreases foreign exchange reserves over time
no increase in tax revenue because of race to the bottom and transfer pricing
no technology transfer but inhibiting domestic entrepreneurship and innovation
influence on political decisions
Please describe the key FDI knowledge transfer/spillover mechanisms
Horizontal or intra-sector spillovers:
FDI firm-specific asset with a public goof characteristicc
cannot prevent it from being transferred to competing firms
Vertical or intersector spillovers:
through the supply chain
Backward: from foreign firms to domestic input suppliers by increasing demand for specialized inputs → upstream sectors
Forward: from foreign intermediate input suppliers to domestic producers by increasing the production of more complex inputs → downstream sectors
Describe the positive and negative mechanisms of vertical FDI spillovers (backward
and forward spillovers)
Backward spillovers
Positive:
deliberate knowledge transfer e.g. technical assistance, management experience, quality assurance
Direct linkage not spillover externality
higher requirements for product quality and ontime delivery introduced by MNE → incentives for domestic producers
MNE entry increasing demand for intermediate products → local suppliers reap benefit of scale economies
Negative:
asymmetric bargaining power
domestic firms not suited to producing input varieties demanded by foreign firms
increased competition from other MNEs supplying inputs or from imported inputs
Forward spillovers:
positive:
embodied technologies
accompanying services
competition effects
negative:
lock-in to using inputs purchased from MNEs
asymmetric bargaining power possible if MNEs gain dominant position upstream
Please outline 3 sources of productivity (TFP) growth at the firm level.
within firm → the firm gets better at using their resources (tech channel)
between firms → the resources are misallocated → move them to more productive firms (misallocation channel)
Selection → bad firms leave market, good firms enter (creative destruction processes)
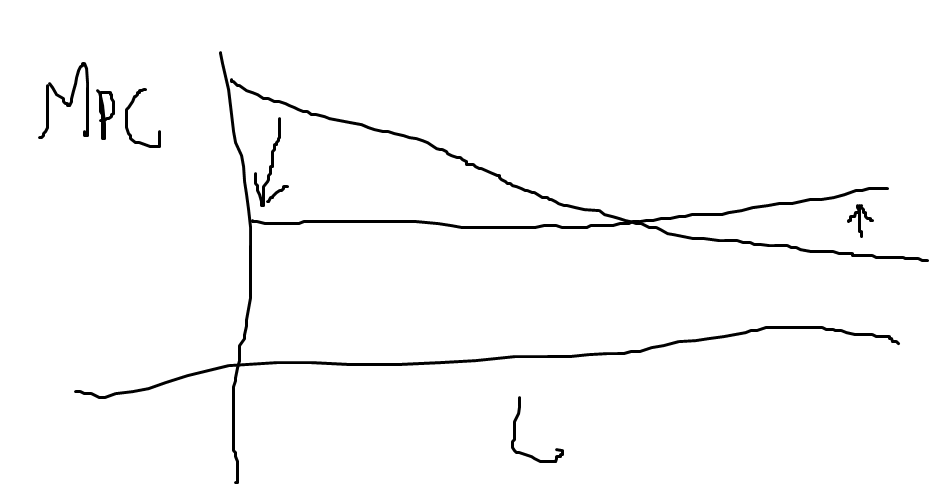
Please describe what is meant by resource misallocation and illustrate how relative marginal products of capital can be used to identify whether firms of different employment size are financially constrained.
Resource misallocation refers to distortions in the allocation of inputs
(such as capital, land, and labor) across production units of varying sizes. Distortions here meaning that the marginal product of labor or capital is lower or higher for capital, land, labor etc down to a firm-specific level.
Please explain what increased variance in TFPQ and TFPR, respectively will do to sector level TFP (assume elasticity of substitution is larger than 2).
TFP_s=(\sum_i (A_{si} \frac{\bar{TFPR_s}}{TFPR_{si}})^{\sigma-1})^{\frac{1}{\sigma-1}}
Where A_{si}=TFPQ (quantity based TFP)
The negative effect of distortions on aggregate TFP can (partly) be summarized by the variance of log TFPR
The extent of misallocation is worse when there is greater dispersion of marginal products
If \sigma > 2 , more variance of A (TFPQ) increases TFP
Holding constant distortions, firms with high A have lower marginal cost
Since there is a constant markup over marginal cost, they also charge (proportionately) lower prices
Hence, their output will be higher, and they get more weight in the calculation of TFP than the firms with lower A
The higher the elasticity of substitution, the larger will be the output response to price differences, and hence, the higher TFP for a given distribution of A
If \sigma > 2, more variance of TFPR decreases TFP
Holding A (TFPQ) constant, a firm with higher TFPR has higher marginal cost and, hence, (proportionately) higher prices
This will induce the firm to produce less than in the absence of distortions
If TFPR and A (TFPQ) are positively correlated, then the distortions render firms with high physical productivity (high A) smaller than optimal, which hurts aggregate TFP (since those firms get less weight)
From the Table, please calculate the relative firm size difference between the 75 percentile and the 25 percentile for the 4 African countries. Moreover, comment on the magnitude of the correlated distortions.
Cote D'Ivoire: e^{0,88}=2,4
Kenya: e^{1,99}=7,3
Ghana: e^{1,43}=4,2
Ethiopia:e^{1,26}=3,5
Kenya appears to have the biggest distortions in the market as there is a much larger difference between firm size for the 25th and 75th percentile
Please outline the assumptions leading to marginal products of capital (MPK) being proportional to average product of capital (APK).
marginal revenue (MPK) is proportional to average product of capital if:
CD revenue
factor intensities and markups constant
no fixed costs
Please describe what is meant by the “missing middle” and outline two different
ways of testing the hypothesis.
Missing Middle is a concept implying that industries in developing nations such as India are controlled by a high number of small businesses and a few major corporations, but disproportionately few medium businesses
Guess: developing countries exhibits a missing middle, reflecting market frictions and policy distortions that discourage production at an intermediate scale
Tests:
small firms constrained or do not benefit from industrial policy interventions (inst env discriminate against smaller firms) (C)
Dual economy theories:
Fixed costs of modern relative to primitive tech very high
large firms are subject to constraints and regulations that small firms evade (D)
Method: measure average return to inputs:
results hold for MR as well if
CD revenue
factor intensities and markups constant
no fixed costs
Please give three different motives for providing foreign aid
Foreign policy, political alliances and national security
historical (political) motives (e.g. former colonies)
Economic motives
trade
subsidies in donor countries
Humanitarian motives
Less obvious motives
democracy
country size
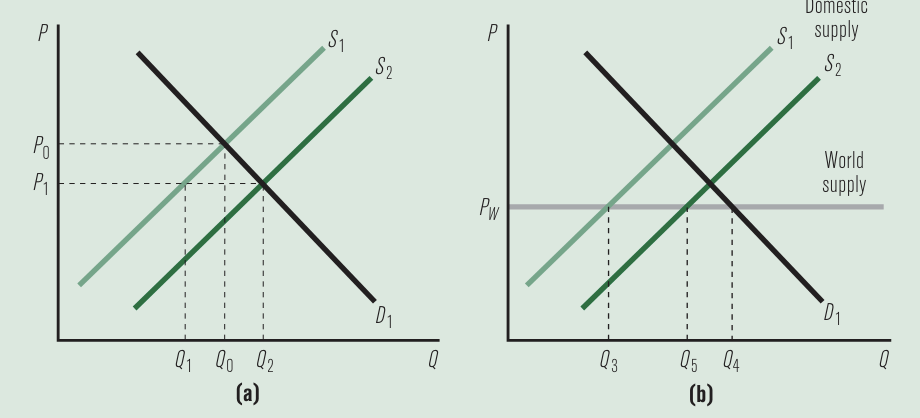
Please explain how donations of food to a country can hurt local farmers by
undermining the incentives for them to produce food. [PRLB box 14-5]
No import:
Increase in food from aid donations → supply curve for food up + food prices down → CS up, PS down (figure a)
Consumers are clearly better off (important if there is a true food shortage) while producers are worse off.
Import:
With a world price of Pw , initial production takes place at Q3 with consumption at Q4 and imports of Q4 - Q3
food aid displaces imports, with imports falling to Q4 - Q5 and food aid making up the difference Q5 - Q3
Domestic prices, food production, and consumption do not change, with food aid, in effect, saving the economy the cost of the displaced imported food
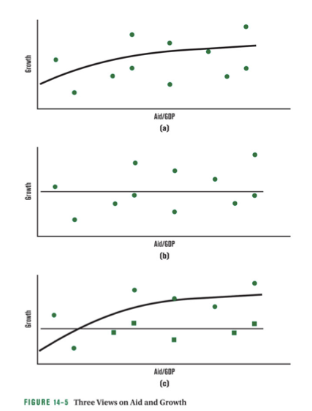
Please explain and present graphically the three views on aid and growth given in PRLB chapter 14
a positive relationship, usually with diminishing returns
increases savings and investments
increase productivity (long term if health and education)
channel for technology
improves efficiency
no relationship (or a negative one)
dutch disease
crowding out
corruption
keeps bad government in power
a conditional relationship in which aid works in some circumstances but not others.
quality of institutions (corruption)
type of aid (easily detectable, such as electricity production, more effective)
characteristics of recipient country
donor practices (multilateral better - no politics)
![<p>Please sketch or draw two simple versions of the Solow growth model in which a temporary inflow of foreign aid may have permanent effects on the level of income per capita. [Hint: Think of low-income traps generated by low savings rates and high population growth rates].</p>](https://knowt-user-attachments.s3.amazonaws.com/5350c996-ae81-41ad-9895-e1bfe542ff84.png)
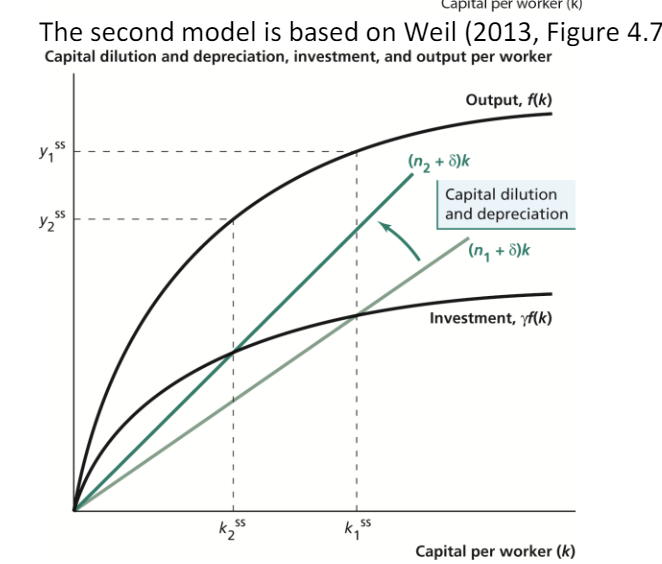
Please sketch or draw two simple versions of the Solow growth model in which a temporary inflow of foreign aid may have permanent effects on the level of income per capita. [Hint: Think of low-income traps generated by low savings rates and high population growth rates].
Changing savings rate: Foreign aid may have permanent effects on the level of income per capita if there is a shift in a parameter in the growth model, which is an indication of something akin to a poverty trap. Weil (2013) has two examples: In Figure 3.9 he illustrates a Solow model with saving dependent on the income level. Savings and investments are low when output per worker is below y* (when capital intensity is below k*), while savings and investments are high when output per worker is above y*. This model has a “jump” in the line representing investment.
Decrease in pop growth: The figure can be interpreted to show how reducing the population growth rate from n2 to n1 affects the steady state level of capital per worker and the steady state level of output per worker. If fertility is a function of income, as for the savings rate above, then this gives rise to a model with multiple equilibria as above.
Please explain how Galiani et al. (2017) identifies exogenous changes in foreign aid to 38 recipient countries.
Setting
WB has an income threshold for countries that are eligible for ODA from IDA
set in 87 to limit the countries available
35 countries crossed the threshold between 87-2010
Idea:
crossing the threshold does not imply that the countries stop receiving ODA, but they start negotiating with WB on different terms
move from IDA to IBRD
event study (natural experiment)
Aid is the dependent variable
includes:
dummy for crossing
log(GDP per capita)
pop size
country fixed effects
period fixed effects
Results
ODA drops 59% in the periods following crossing
ODA effect on growth is significantly positive even when accounting for
country FE
period FE
pop size
GDP per capita
when “just” using aid as own variable effect of increasing aid/GNI by 0.01 %-point = 0,12%-point
when crossing is instrument = 0.31%-point
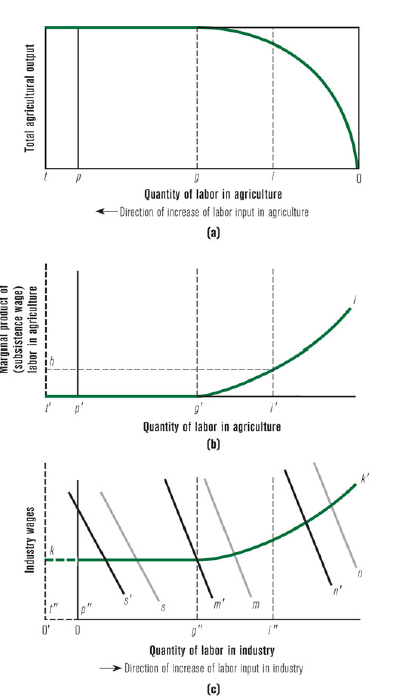
Please outline and describe (graphically) the Lewis model
in developing countries line between employee and dependents is thinly drawn
no social security → keep people even if not profitable
MPL may be 0 but wages are higher
Modern sector:
Uses capital → limits scope of production at any given time
Employs people wrt. MPL, taking the subsistence wage as given
Predictions
gradually shifting labor allocation towards manufacturing (modern sector) during development
initially accompanied by modest (or no) increases in wages in manufacturing
secularly rising savings rate during development
substantial productivity differences between agricultural and manufacturing sector
→ support the manufacturing sector during transition
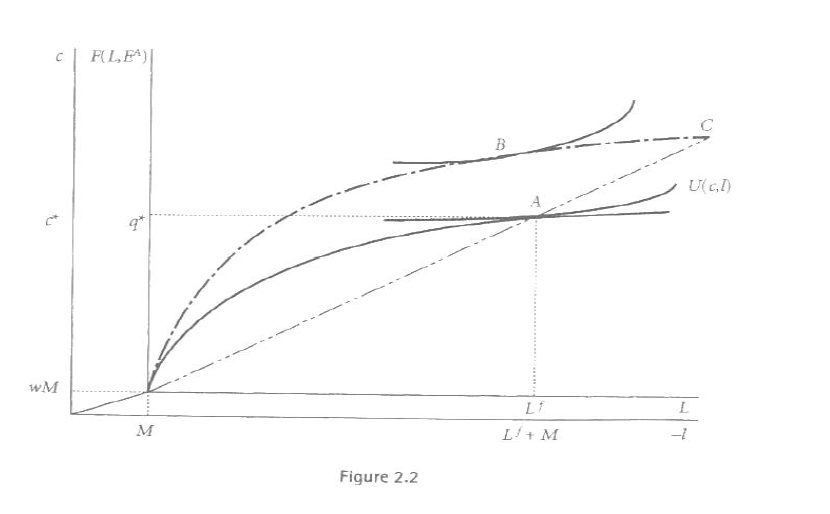
Please explain and describe graphically how to reach the result of an inverse
relationship between land size and farming intensity
AHM - model
when separation doesnt hold i.e.
no land market
surplus of labor
HH no longer optimize separately between firm and HH
if separation then end in C when land increase as CRTS
as doesnt hold → end in B
Intuition
Consider a household with more land than the HH at point A (new production function is the dot-dash line).
Assume they are facing the same wage/labor market constraints. Then the HH with more land should choose to produce and consume at point C given the same cultivation intensity.
If leisure is a normal good, point C will not be chosen. Optimum is at point B where the larger farm HH will cultivate less intensively (Lower L/E ratio).
Please describe the “separation hypothesis” and outline an empirical test to verify
or falsify the hypothesis.
When HH also earns a farm, they make decisions as owner as consumer separately
first max profit
then max utility
theoretically holds when only when market fails
Empirically: Benjamin
tests the separation property against an alternative of participation restrictions in the labor market
results:
the separation property holds: given an adequate set of markets, the farm-HH will act like a profit maximizing firm on the production side and a utility maximizing consumer on the demand side
The inverse size-productivity relationship: a combination of labor and land market failures leads to a break down of the separation result: as HH endowment of land increases, the intensity with which it cultivates declines
Please outline the pros and cons (from an efficiency point of view) of smallholder
farming.
empirical evidence that they are quite efficient
Pros: the inverse productivity relationship
cons: economies of scale
skills and tech
finance and acces to capital
organization of logistics
Which is the dominant effect?
evidence (both theoretical and empirical) point toward EofS as the dominant effect when looking at efficiency
Owner-cultivated farms most efficient
Please provide a 2 country-2 product example that explains absolute versus comparative advantages
England Portugal
Wine and cloth
England use:
100 hours to produce one unit of cloth
120 hours to produce one unit of wine
5/6 units of wine for same hours as cloth
Portugal use:
90 hours to produce one unit of cloth
80 hours to produce one unit of wine
9/8 units of wine for same hours as cloth
Portugal has an absolute advantage in both
England has a comparative advantage in cloth due to lower opportunity cost
If no trade: England spends 220 hours to get one of each, Portugal spends 170
If specialization and trade:
Portugal solely produce wine
England solely produce cloth
→ pareto improvement as >2 units of each is made
Issues: Empirical observation of two-way trade in similar products
Please explain the predictions of traditional trade theory in relation to within country inequality in developing countries and what the empirical evidence suggests
theoretically trade should have helped the less skilled (presumed to be the locally relatively abundant factor in developing countries)
Empirically they are not better off, especially not compared to high skilled workers
The inequality paradox
Please explain the underlying idea behind the theory of economics complexity
It is very expensive to “gamble” by creating a new product takes a considerable risk
if product is profitable → more entries (positive externality) → cost discovery become socialized
if product is unprofitable → loss remains private
→ Investment levels in cost discovery are suboptimal if the industry or G finds a way to internalize the externality
positive association between export “sophistication” and subsequent economic growth
the type of good you specializer in matters for economic performance
To leapfrog and grow faster a country needs to diversify into and scale up at least some sophisticated products
Country and product/specificity are key
Comparative advantages can be created/developed
tech capabilities can be acquired and can change what you export. no need to rely only on your natural endowments to guide export patterns
Policy advice: Produce both high quality/productivity goods and goods, where you have a comparative advantage
Please select the following two countries Tanzania and Ghana at https://atlas.cid.harvard.edu/ and explore their country profiles.
Ghana: The Atlas of Economic Complexity (harvard.edu)
Kenya: The Atlas of Economic Complexity (harvard.edu)
Based on the country profiles how would you evaluate and compare the two countries:
- Recommended strategic approach?
- Potential growth opportunities?
- New product opportunities?
look for products that have the picking winners strategy
high complexity (above country mean)
high opportunity gain
low distance
RCA<1
Please explain how warfare can both lead to an increase and a decrease in post-conflict welfare
warfare destroys infrastructure, HC etc. harming future development (Collier)
warfare is sometimes credited for the technological and institutional development improving future conditions for economic progress (Acemoglu and Robinson)
Please outline the main warfare predictions of the contest model in relation to poverty and wealth effects.
Two competing parties (a rebel group and a government)
analyzes each sides allocation of resources to production vs. appropriation
Treat rebels and rulers as unitary actors. Winning party consumes the resources of both the state and the losers
moving away from unitary actors to representative HH means that participation in soldiering rises as the opportunity cost of fighting falls
Predictions:
odds of winning increase with the relative effectiveness of that sides fighting tech
poverty lowers individual incentives for maintaining order, as soldiering increases with the relative returns to fighting vs. production
Please explain the difference between climate mitigation and climate adaptation.
mitigation: Involves reducing the flow of heat-trapping greenhouse gasses into the atmosphere
eg. carbon taxes/quotas
adaptation: involves adjusting to actual or expected future climate
managing rivers, buliding resilient homes
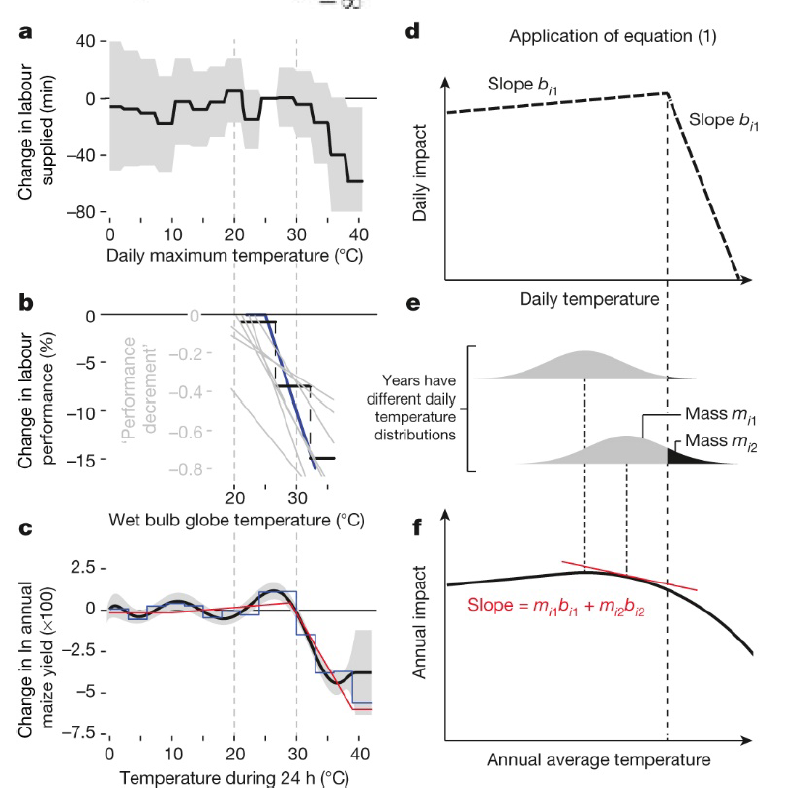
Using Figure 1 on the next page, please explain how Burke et al. (2015) connect
micro evidence on abrupt changes in productivity from increased temperature with
smooth changes at the macro level.
looks at effects from daily temperature on
labor supply
labor performance
crop yield
→ shows similar kinked structures
→ map onto country-level distributions of temperatures across different locations and times within that country
Shift in country-level distributions correspond to changes in avg annual temperature, altering the fraction of unit-hours exposed to different regions of the micro-level response
→ aggregating daily impacts maps annual average temperature to annual output as a non-linear and concave function that is smoother than the micro with a lower optimum
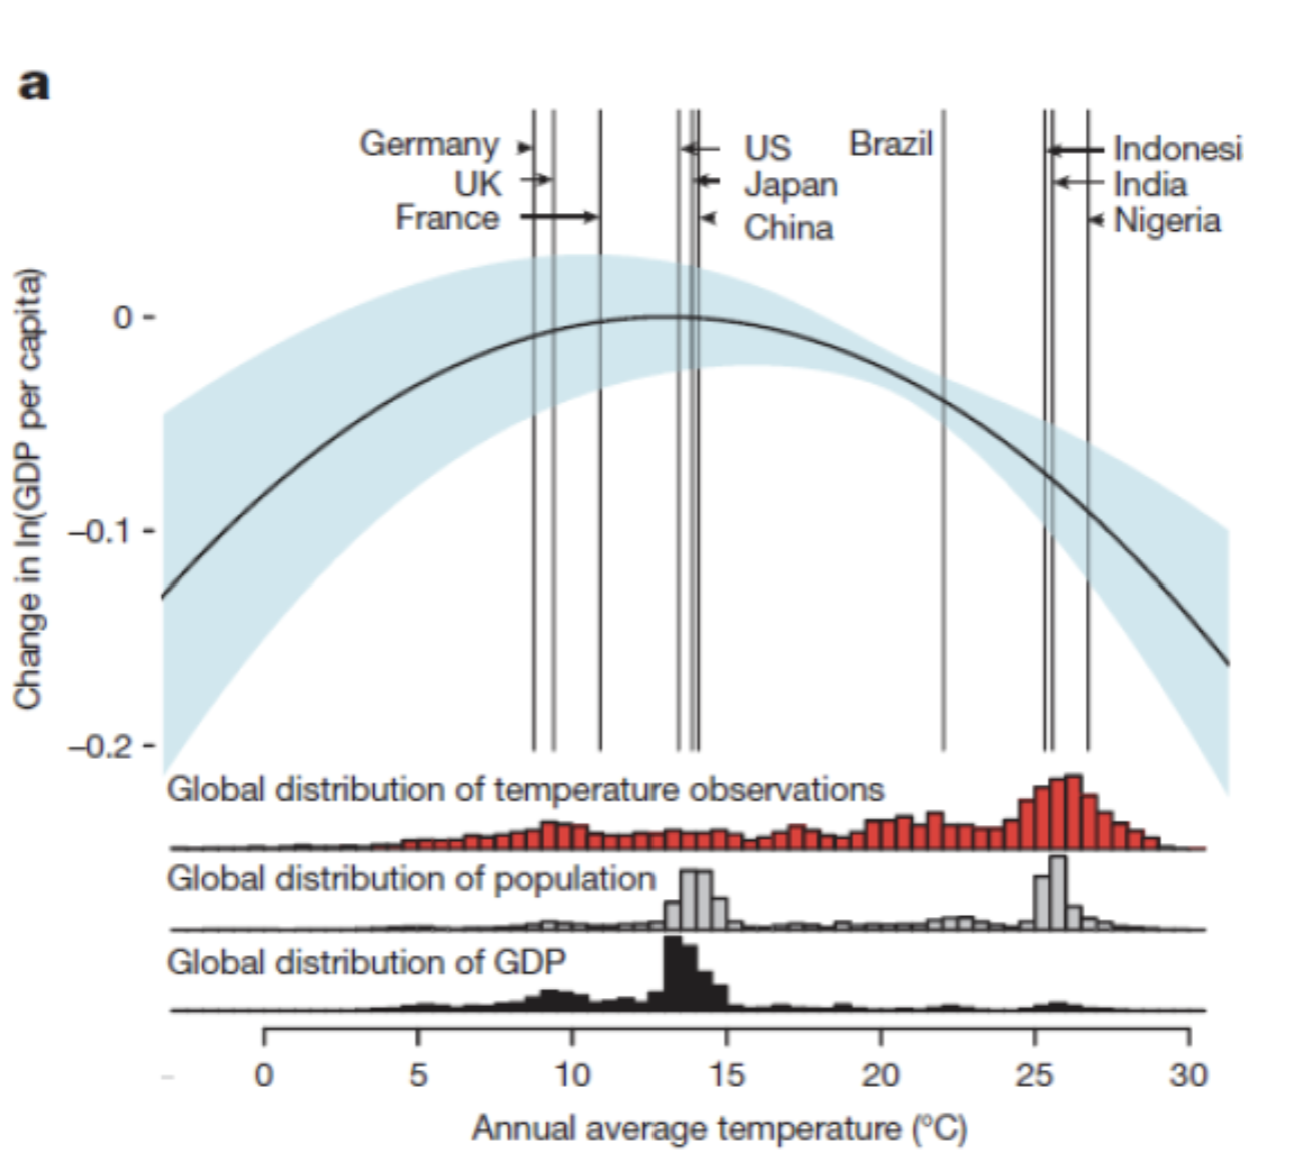
Please explain how Burke et al. (2015) find and compute the global non-linear
relationship between annual average temperature and change in log gross
domestic product (GDP) per capita (thick black line) in Figure 2 below
He looks at effect of temp + temp²+precip+precip²
Uses that countries experience different distributions of temperatures and precipitation
→ regression version of the above