CH 10: General Equilibrium and Economic Welfare
1/38
There's no tags or description
Looks like no tags are added yet.
Name | Mastery | Learn | Test | Matching | Spaced |
|---|
No study sessions yet.
39 Terms
Partial-equilibrium (PF)
an examination of equilibrium and changes in equilibrium in one market in isolation.
General-equilibrium (GF)
the study of how equilibrium is determined in all markets simultaneously.
Pareto efficient
describing an allocation of goods or services such that any reallocation harms at least one person.
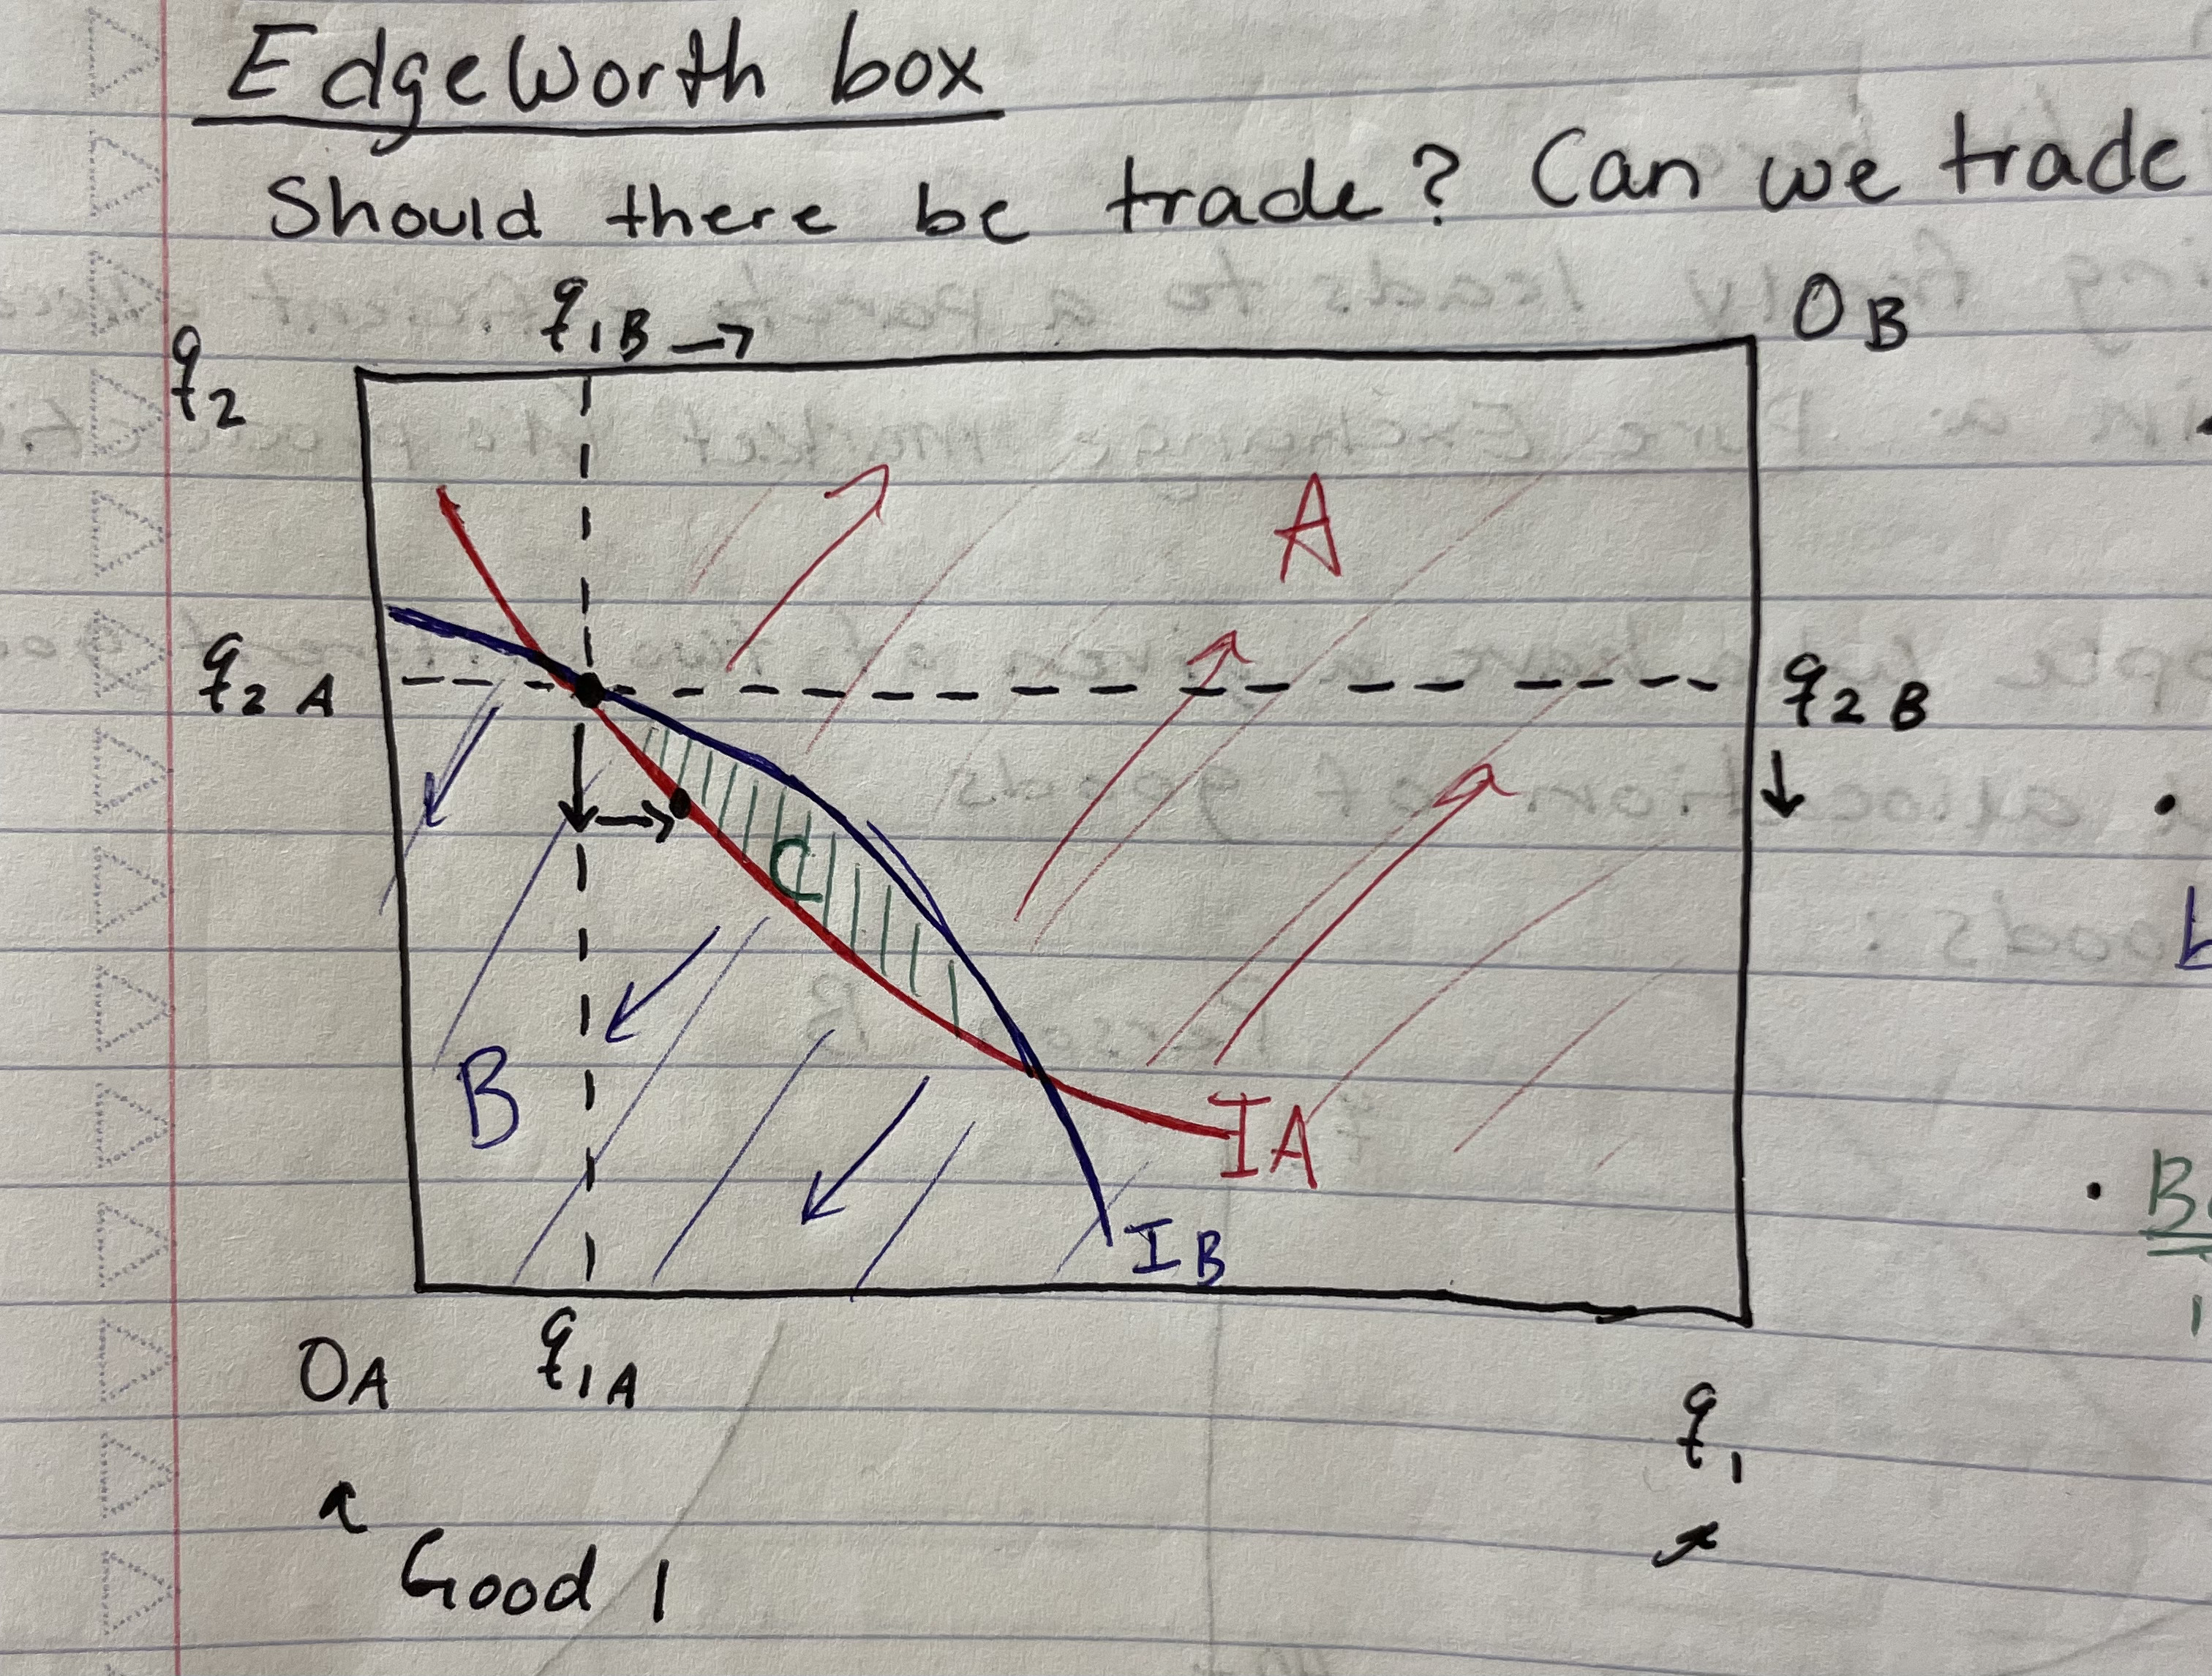
Trading between two people:
Endowments
an initial allocation of goods

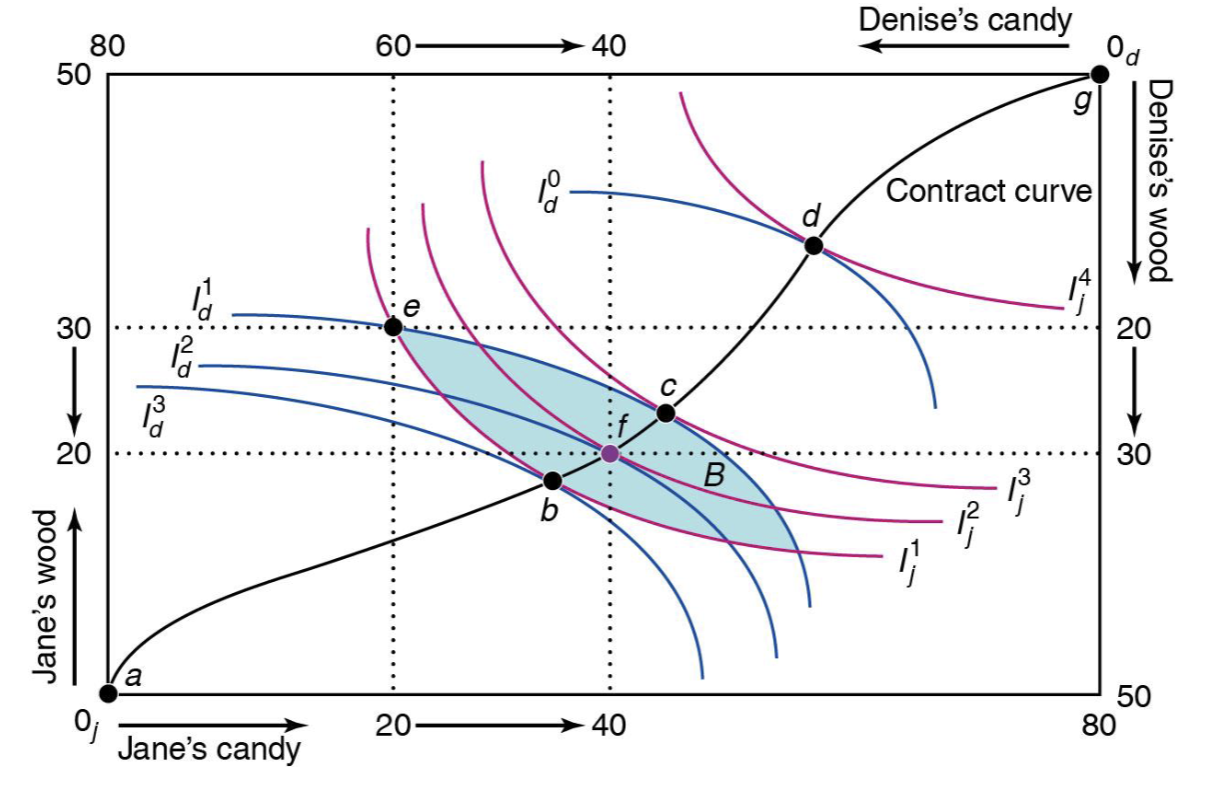
What 4 equivalent statements can be made about the allocation at point f?
The indifference curves of the two parties are tangent at f
The parties’ MRS are equal at f
No further mutually beneficial trades are possible at f
The allocation at f is Pareto efficient
Can allocation still be Pareto efficient when drawn along the indifference curve?
yes
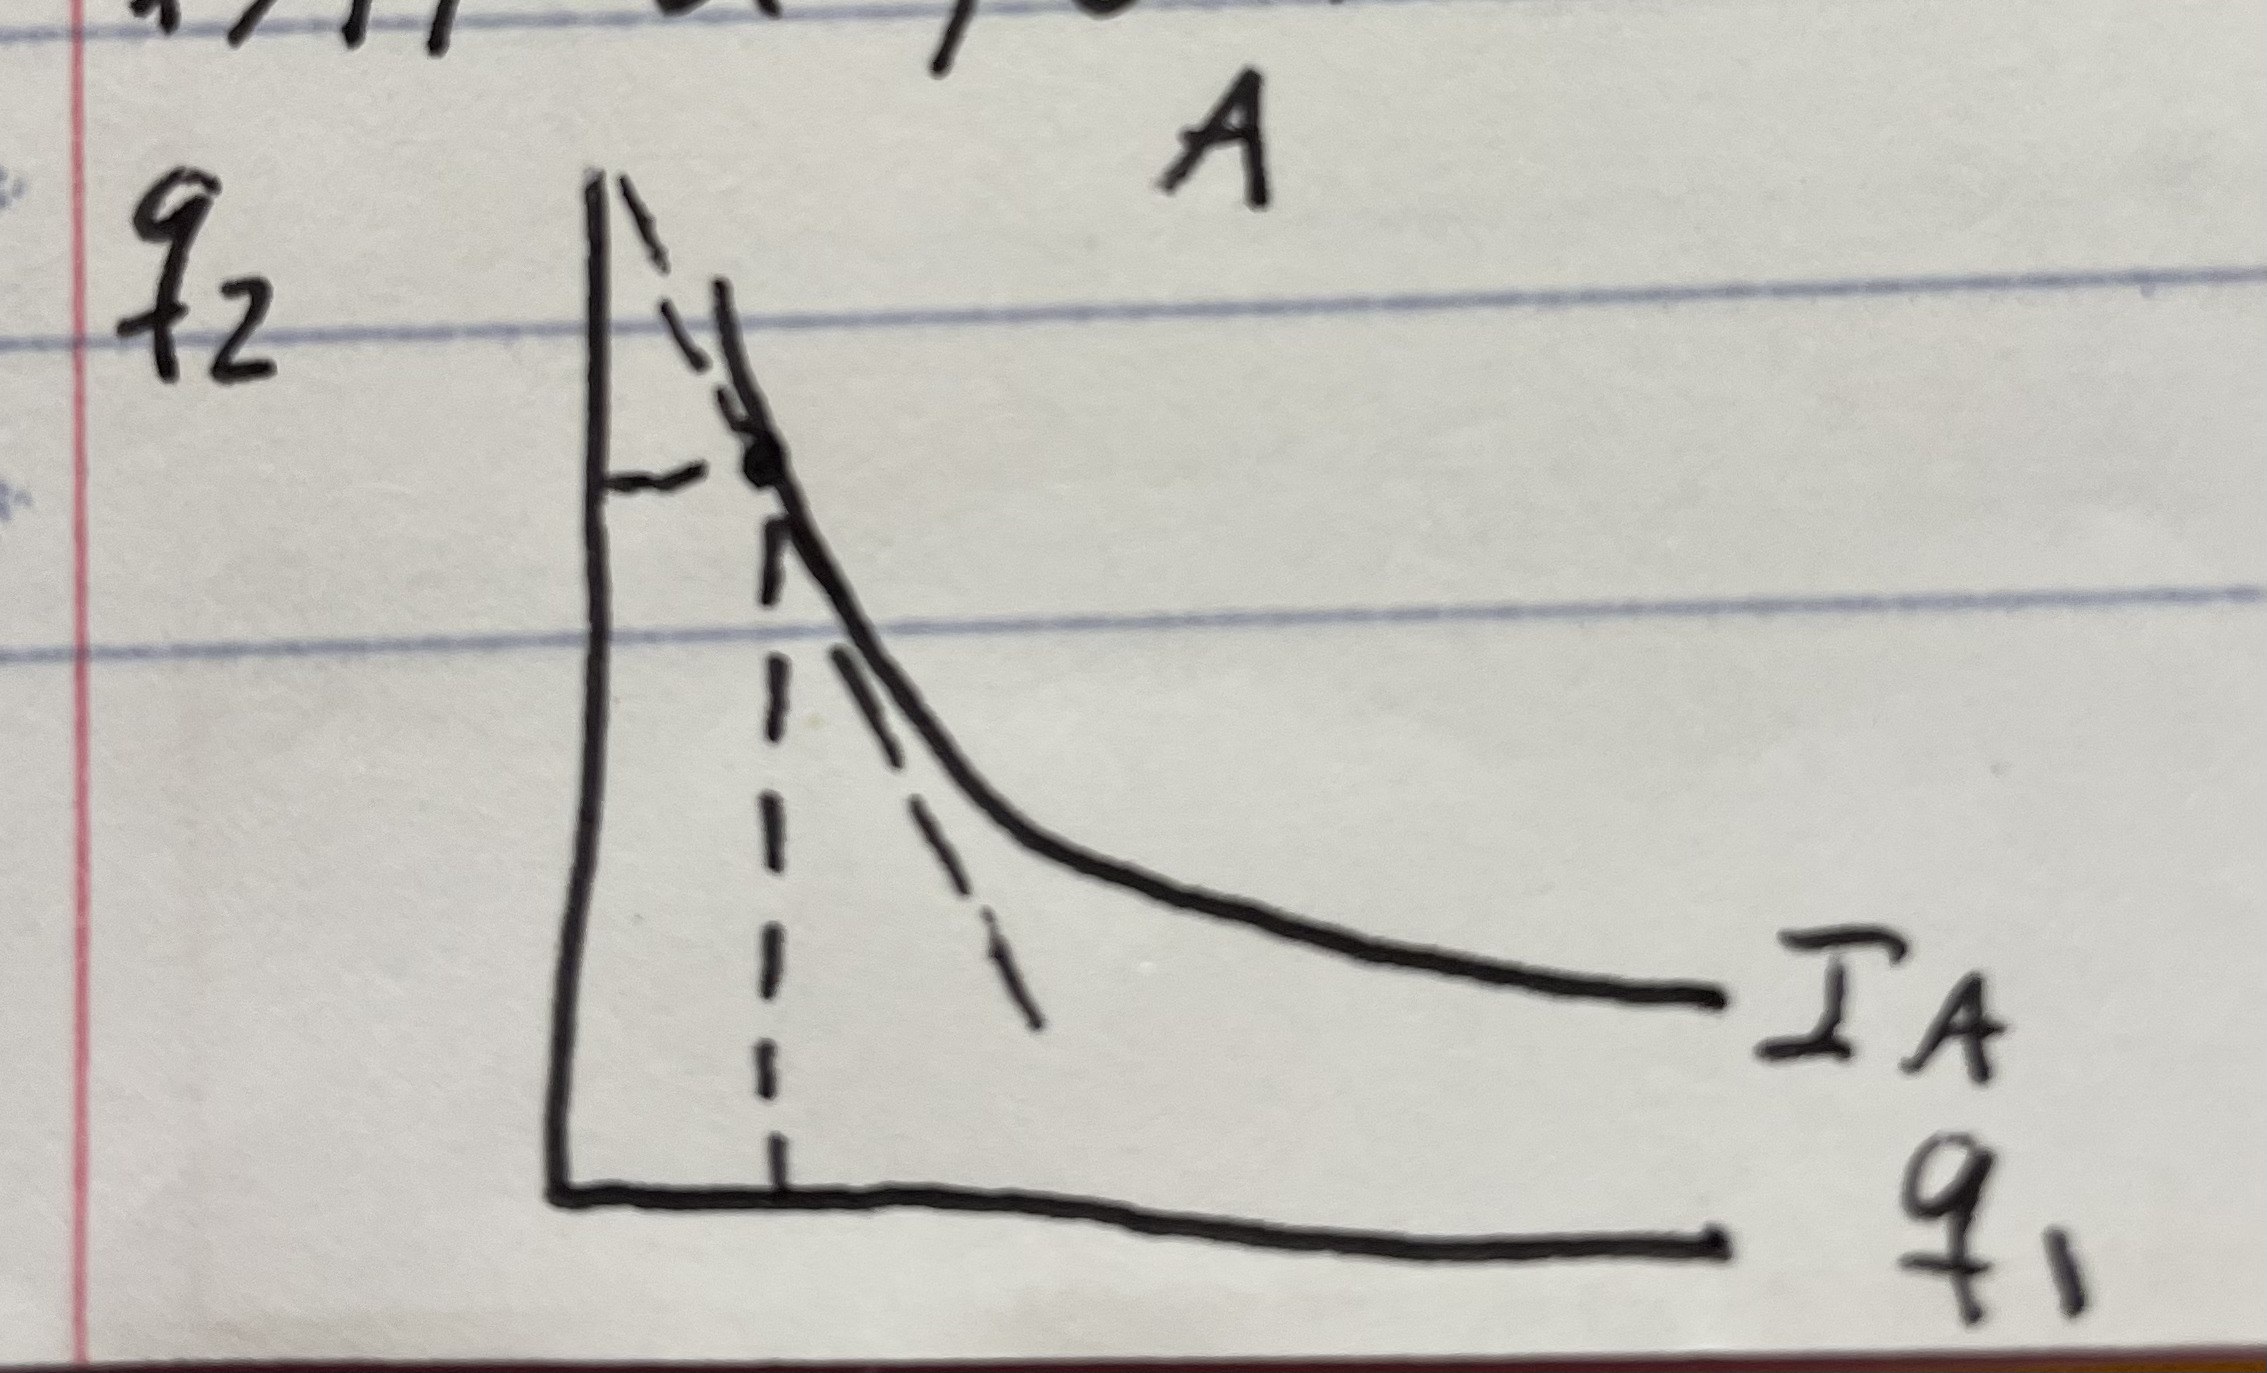
4 Assumptions about preferences
Utility maximization: each person is maximizing utility
Usual-shaped indifference curves: usual convex shape
Non-satiation: strictly positive marginal utility for each good (i.e., never satiated)
No interdependence: neither persons utility depends on the other
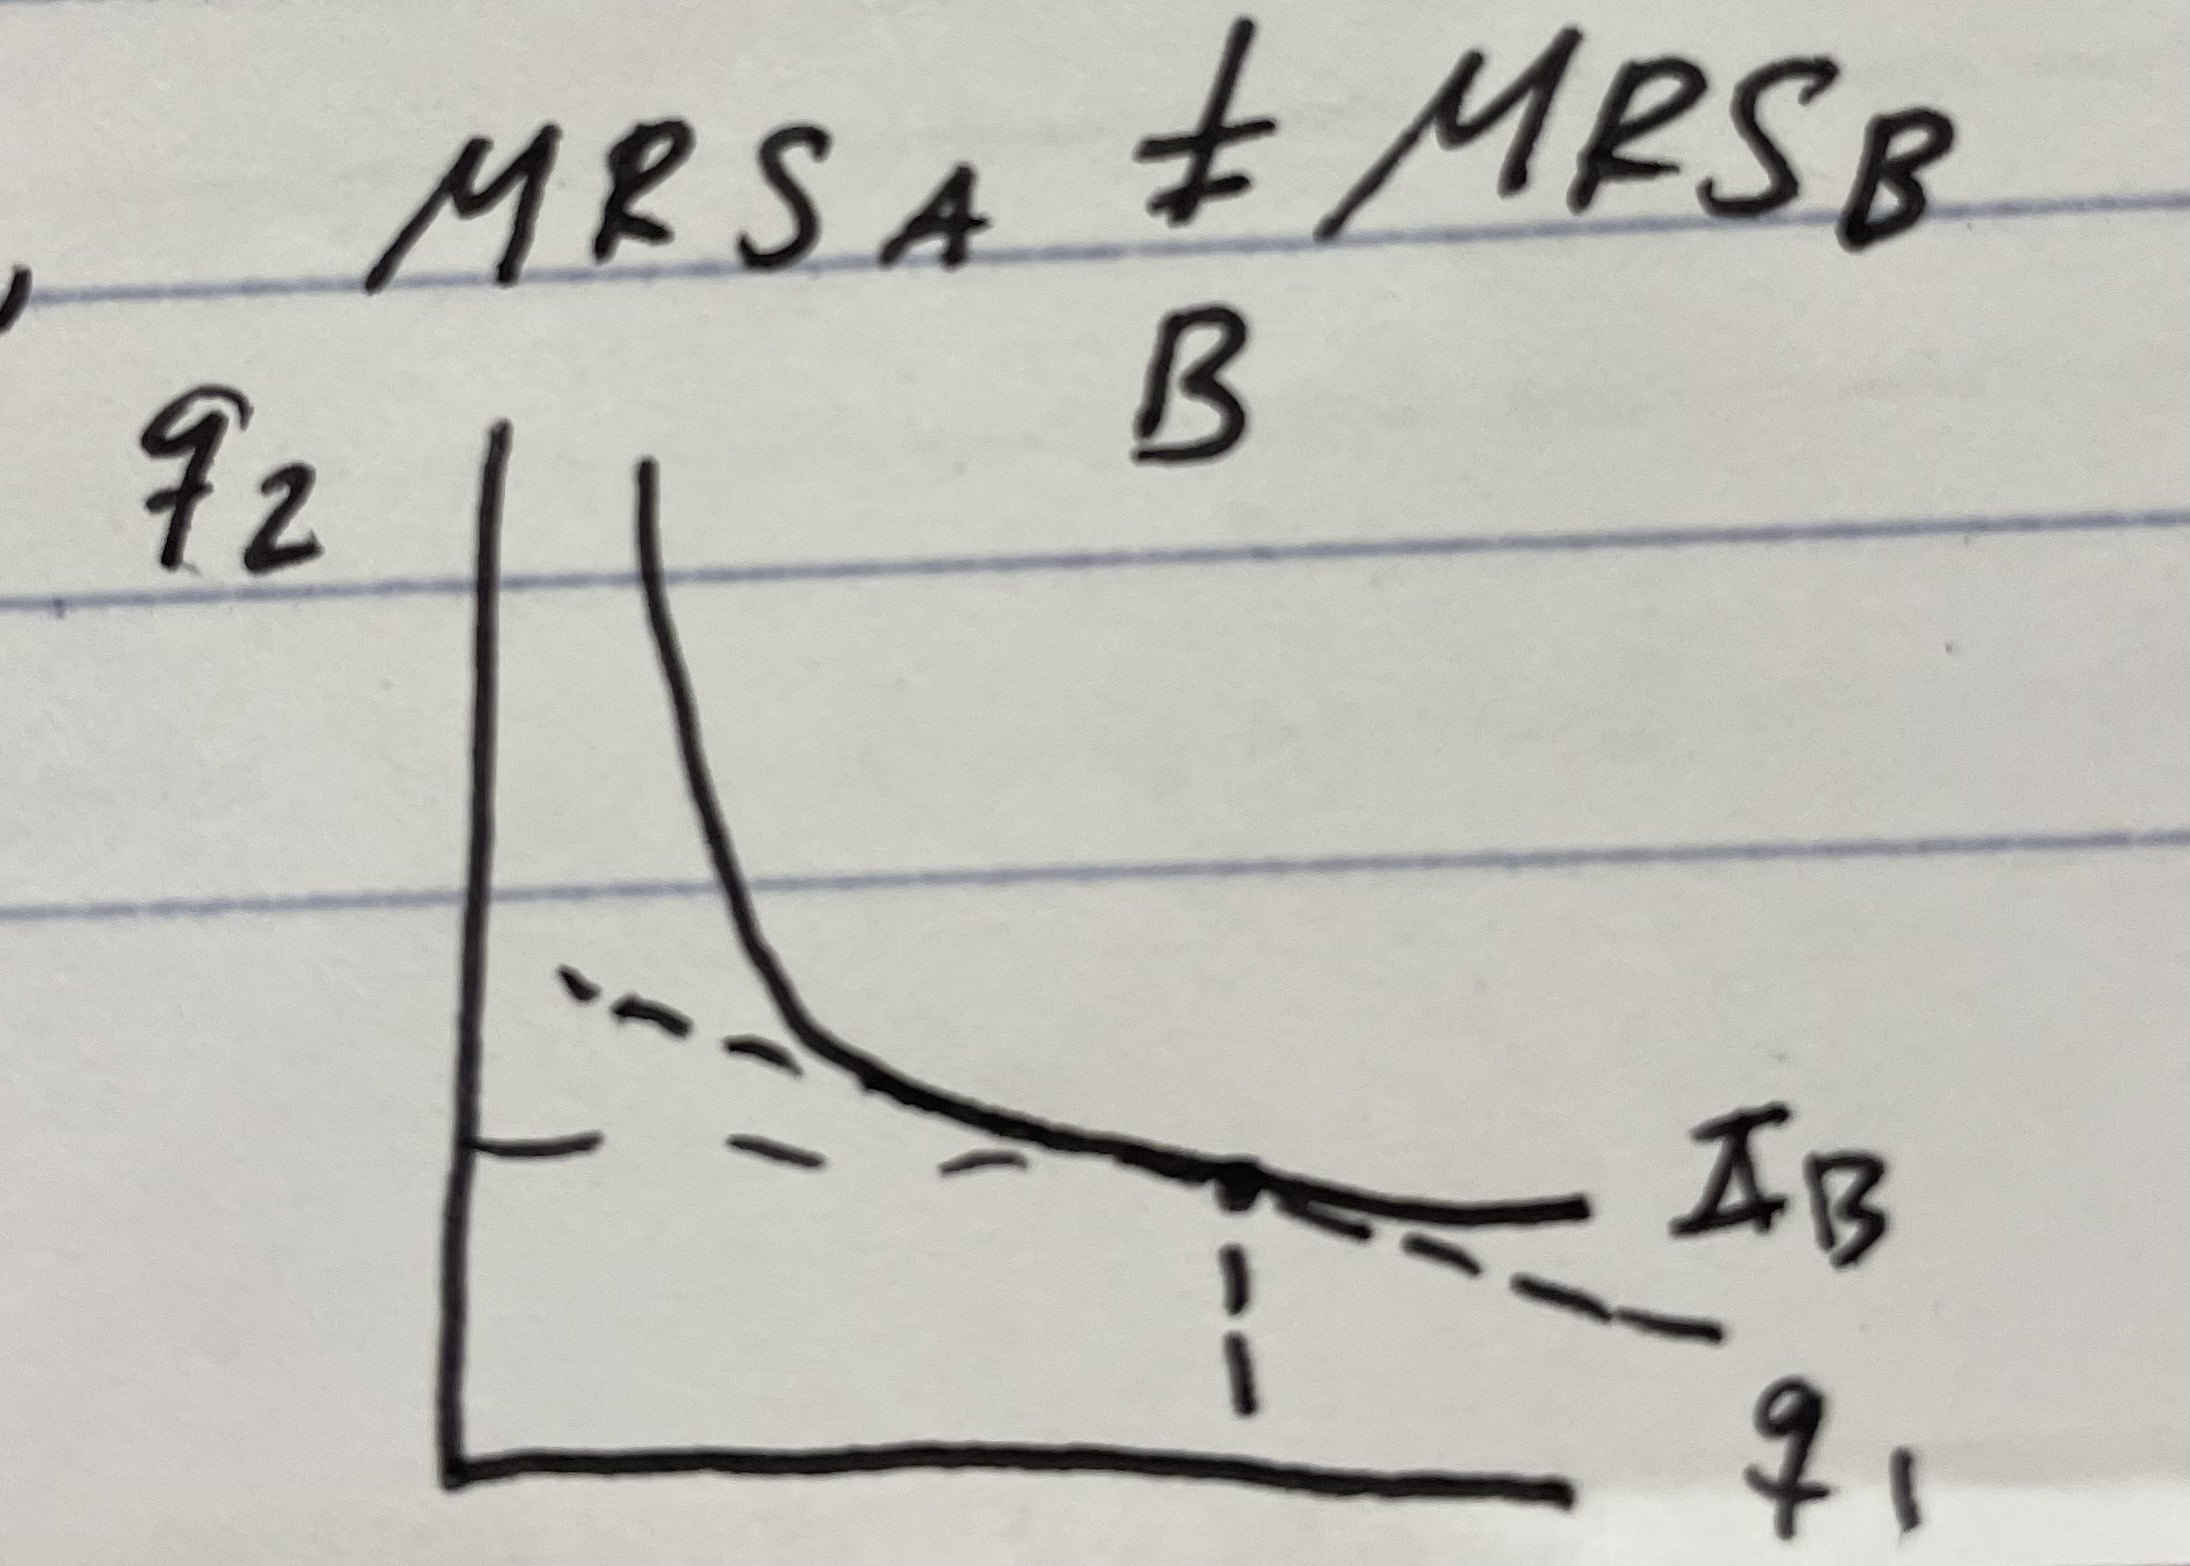
If curves are tangent at point ‘b’ can we make more trades to improve welfare?

No! MRSA = MRSB — this is Pareto efficient
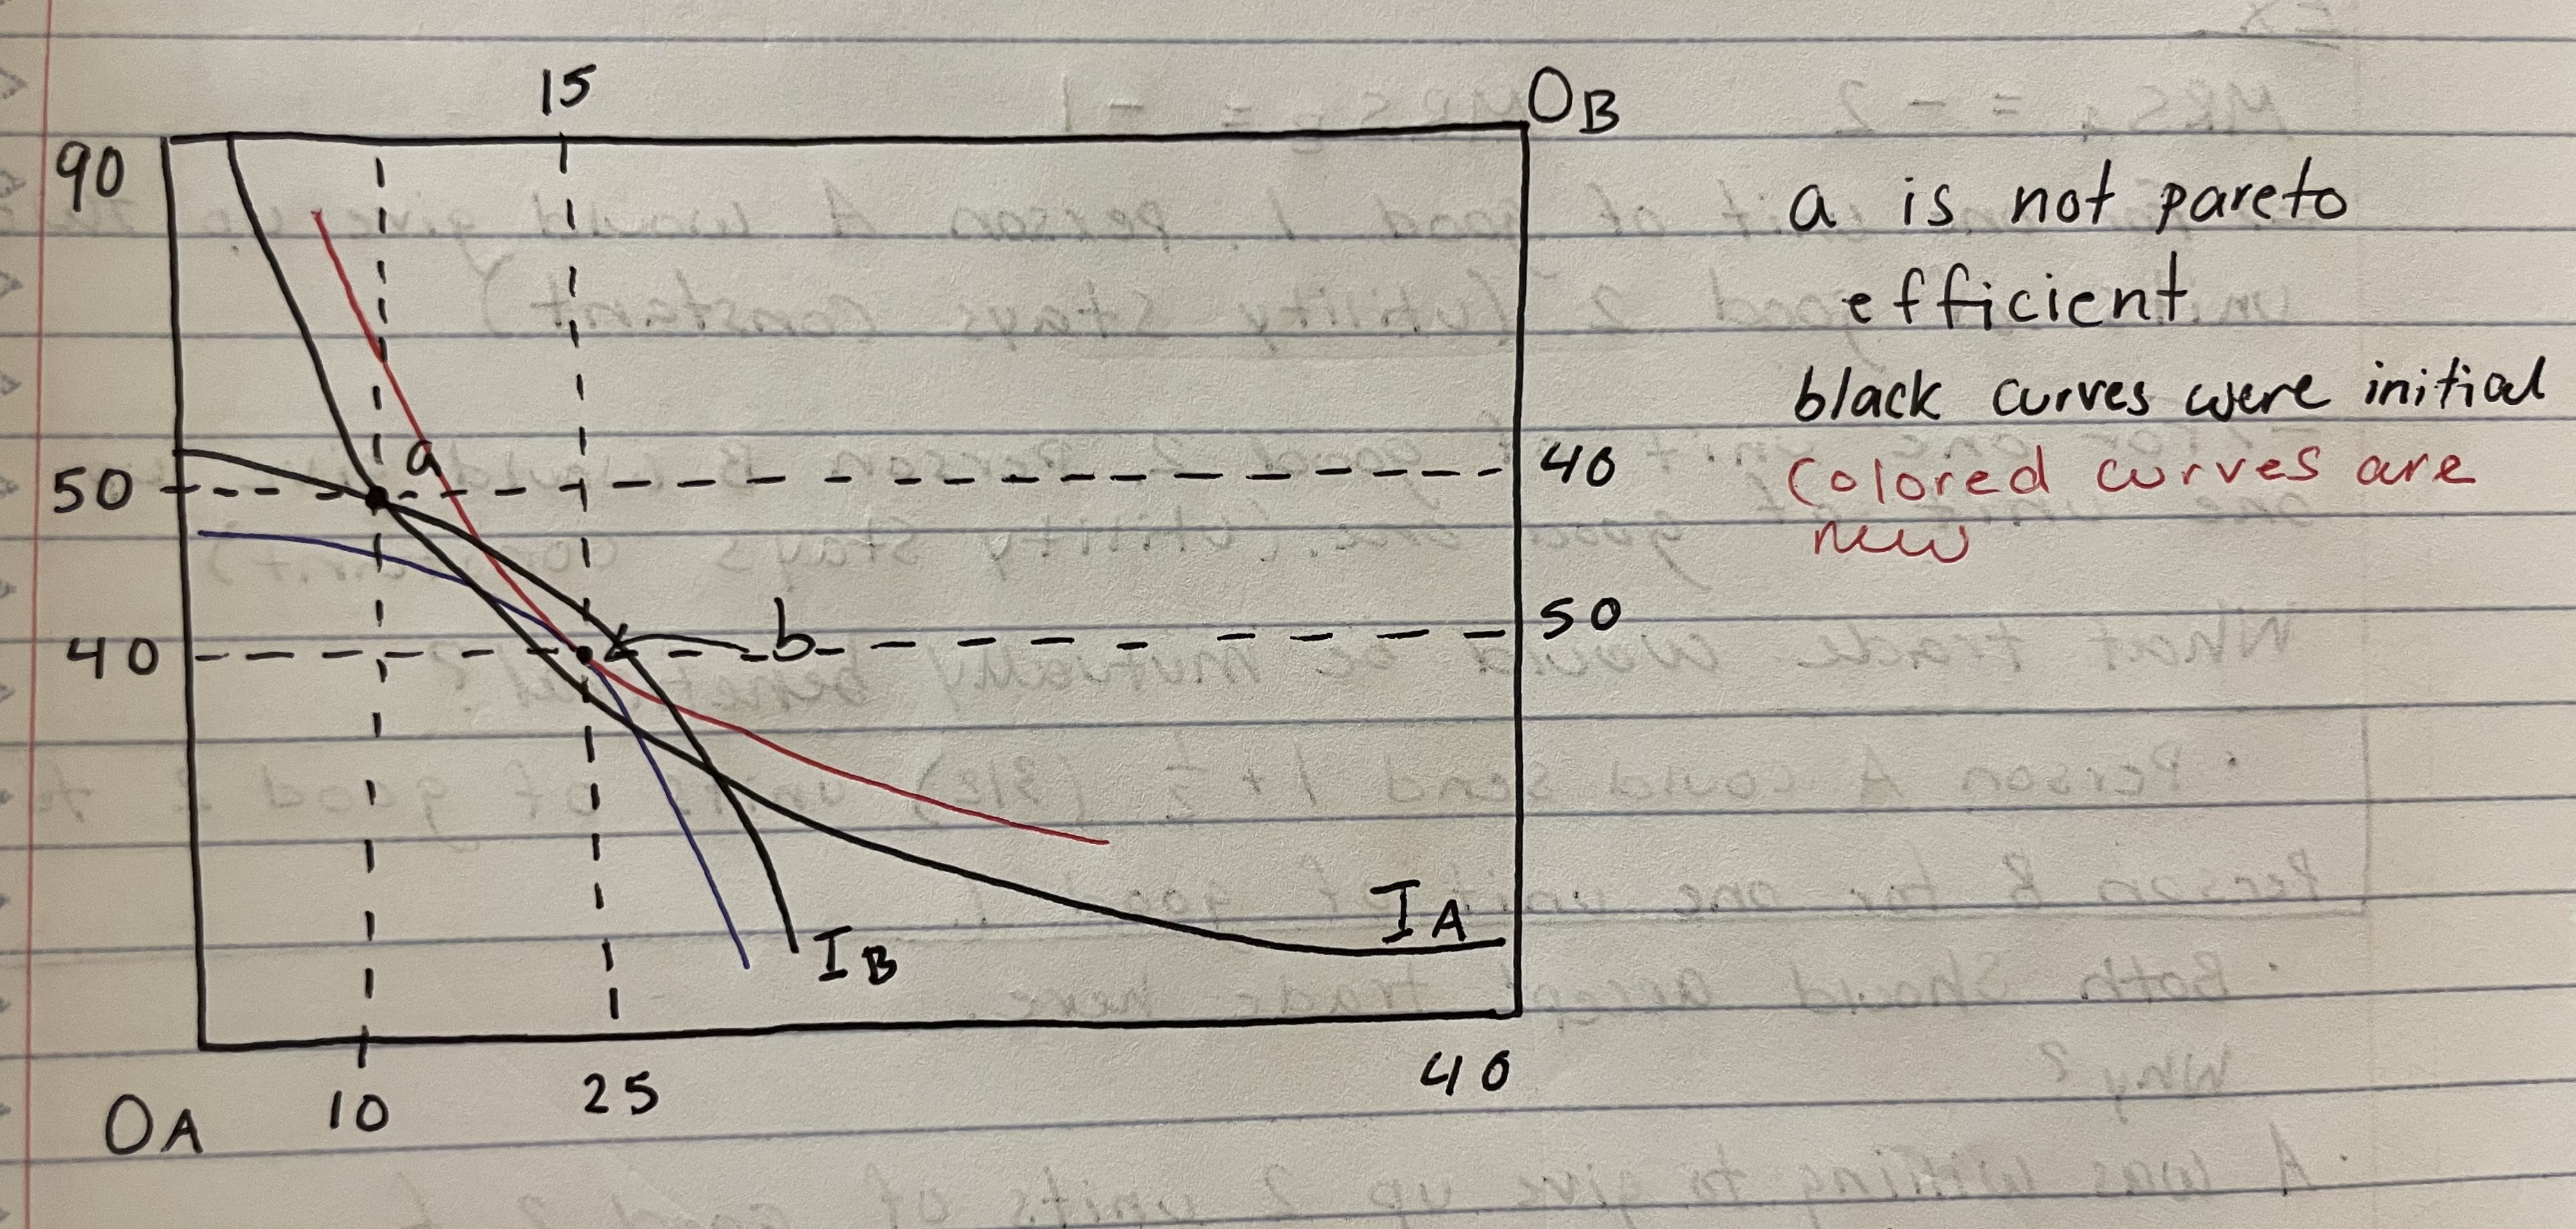

Given
-mu1a/mu2a > -mu1b/mu2b
What is person A willing to give up in exchange for the other good?
Person A is willing to give up more of good 2 for an additional unit of good 1 than person B.

Given
-mu1a/mu2a > -mu1b/mu2b
What is person B willing to give up in exchange for the other good?
Person B is willing to give up more of good 1 for an additional unit of good 2 than person A
Given MRSa = -2 and MRSb = -1
What trade allocation would be mutually beneficial/Pareto efficient?
person A giving B 11/2 units of good 2 for 1 unit of good 1.
Contract curve
the set of all Pareto-efficient bundles
(A move from any bundle on the contract curve will harm at least one person)
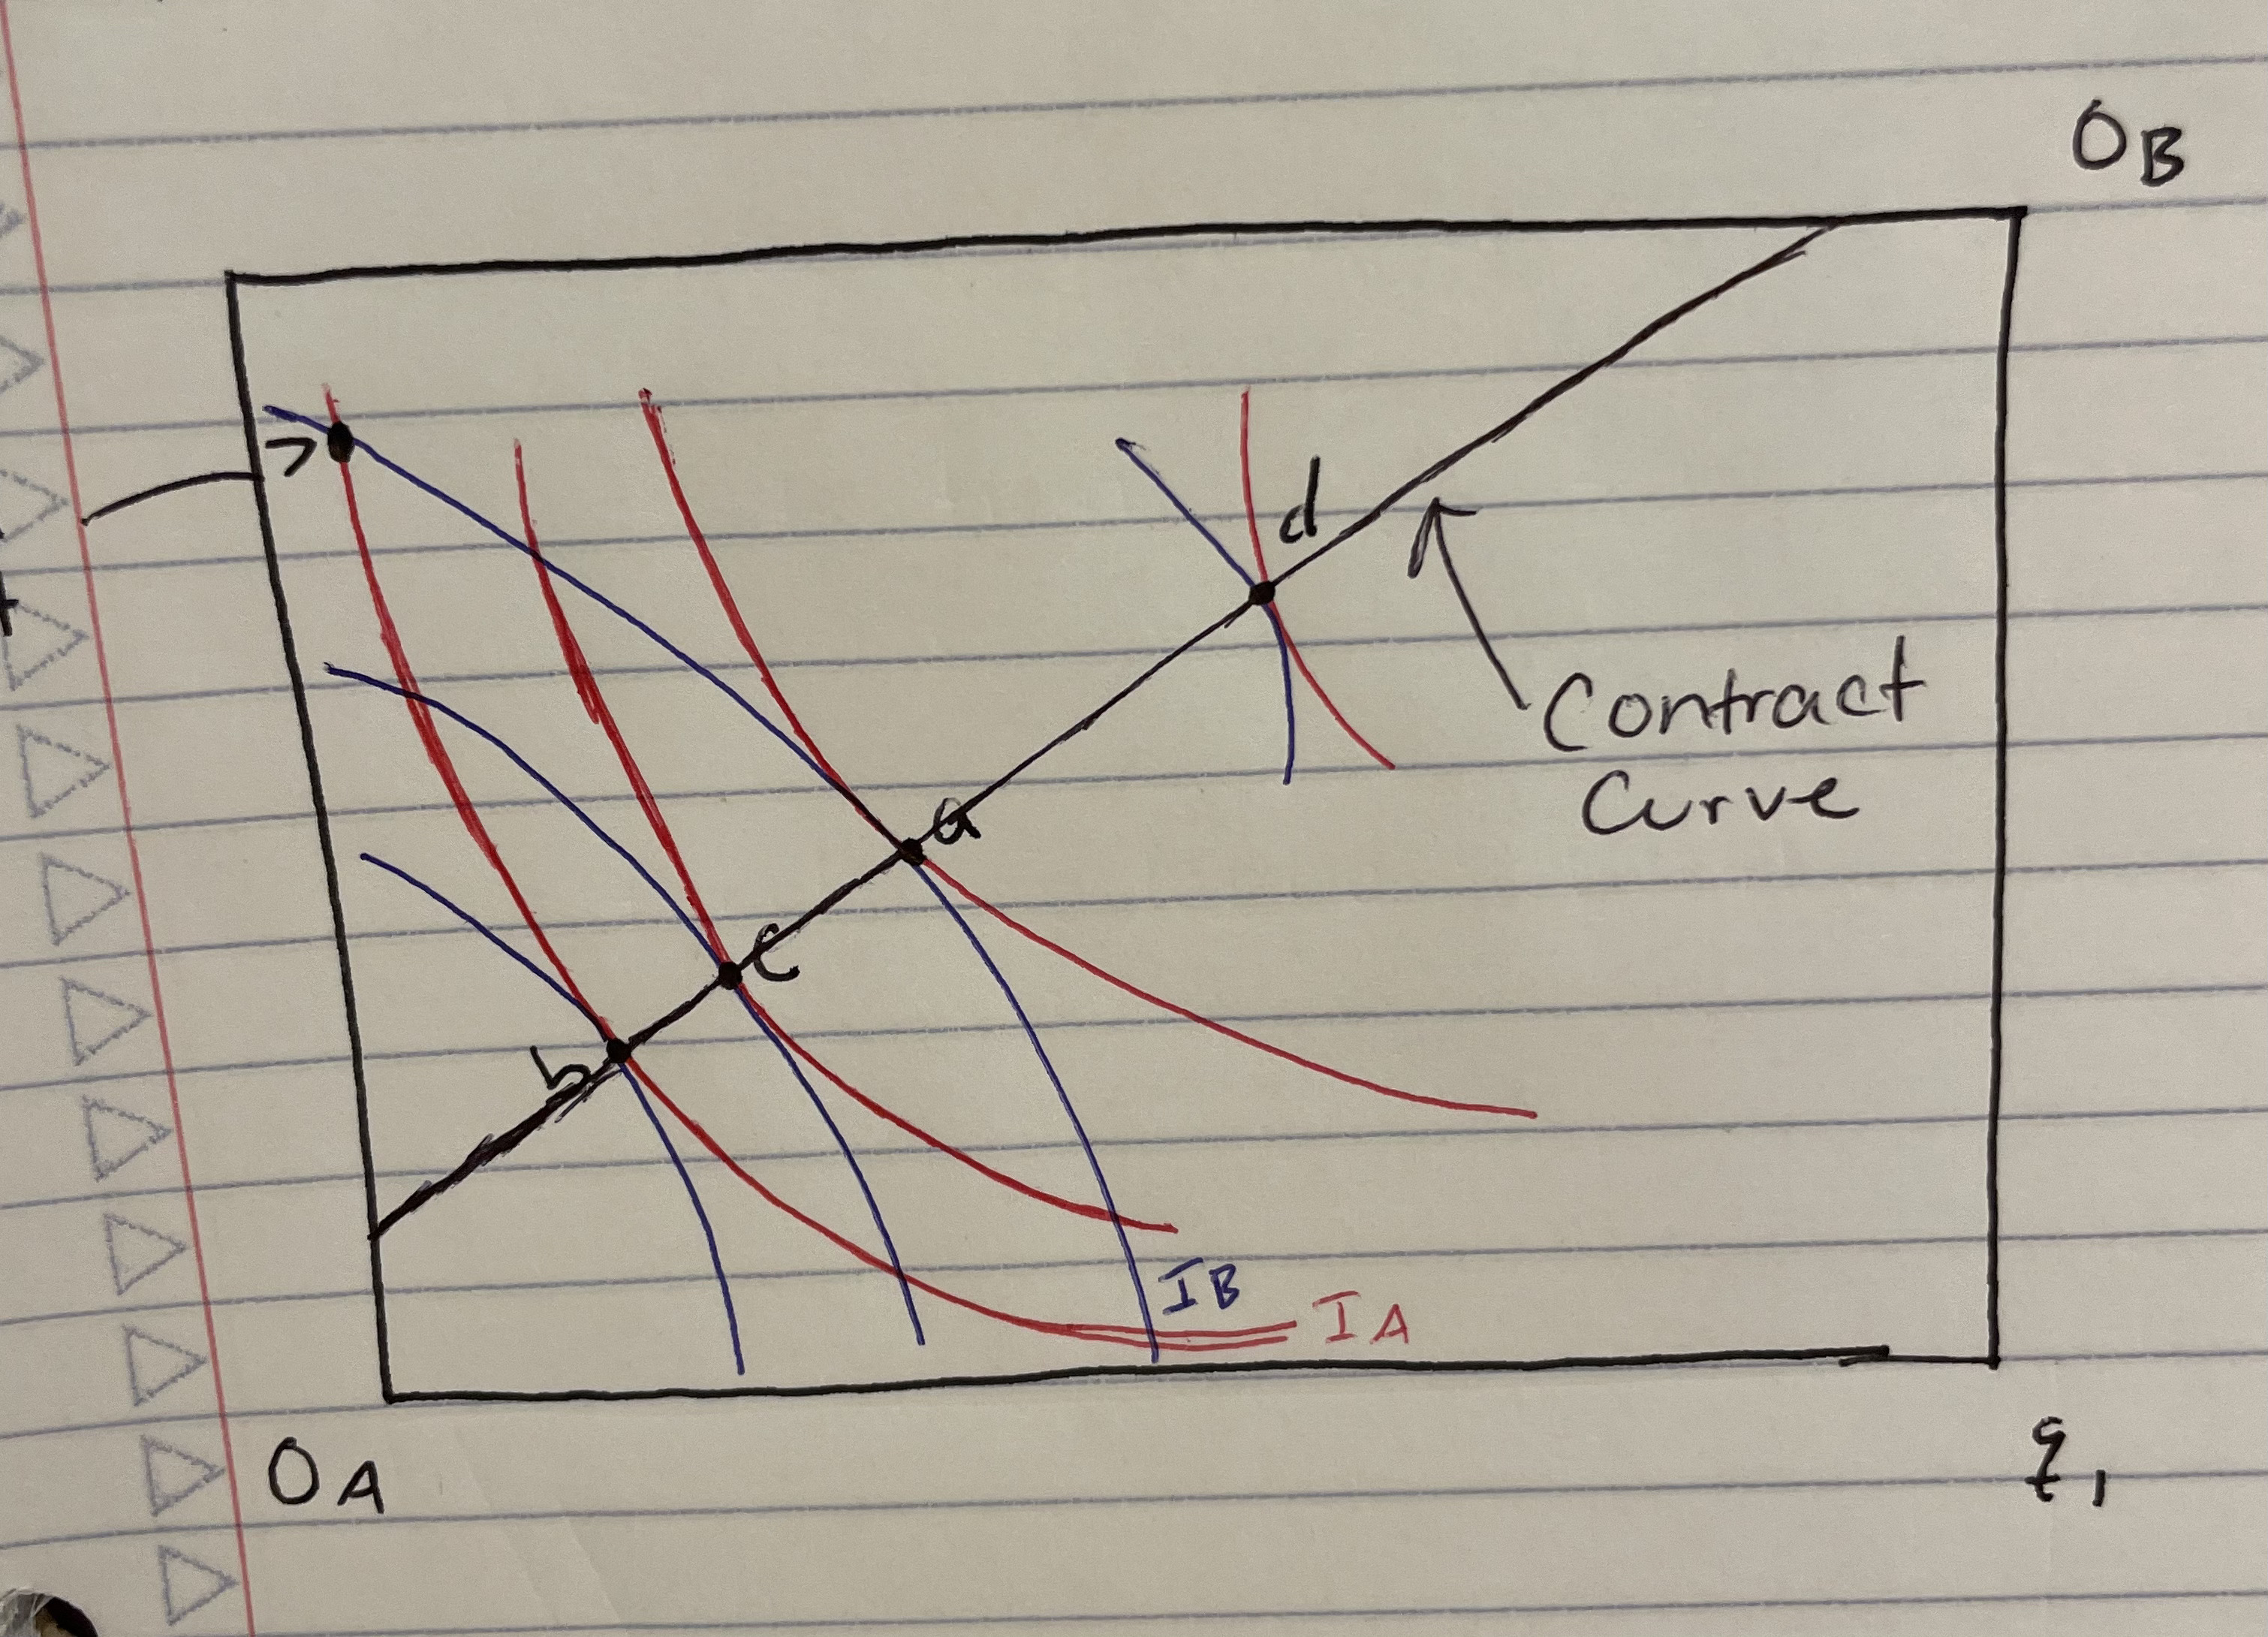
Are allocation points a and g part of the contract curve?
Yes
How to find the contract curve in pure exchange economy (like the in-class worksheet). 5 steps.
Find the MRS for each person
Set MRSA = MRSB
Use resource constraints to find q1B and q2B
Substitute into MRS equality
Solve for q2A in terms of q1A to get contract curve
What exchange do we examine when determining a competitive equilibrium?
A competitive exchange model where consumers are price takers
2 desirable options for competitive equilibrium:
First theorem of welfare economics —
the competitive equilibrium is efficient, i.e. competition results in Pareto efficient allocation
(MRS = -p1/p2)
2 desirable options for competitive equilibrium:
Second theorem of welfare economics —
Any efficient allocation can be achieved by competition (, given an appropriate initial allocation)
(Any initial allocation along the price line will result in the competitive equilibrium)
What should we assume about the structure of competitive equilibriums?
two consumers are price taking agents
Third party who acts as auctioneer — party presents prices to agents they decide how much to buy and sell
If demand does not equal supply, auctioneer changes price until the market clears
What does the price line represent?
A price line is a straight line that shows all possible combinations of two goods an individual can purchase with a given budget and given prices of those goods.
Price line leads to the competitive equilibrium where supply and demand are equal.
(it will be on this line, but not all points on this line are the competitive equilibrium)
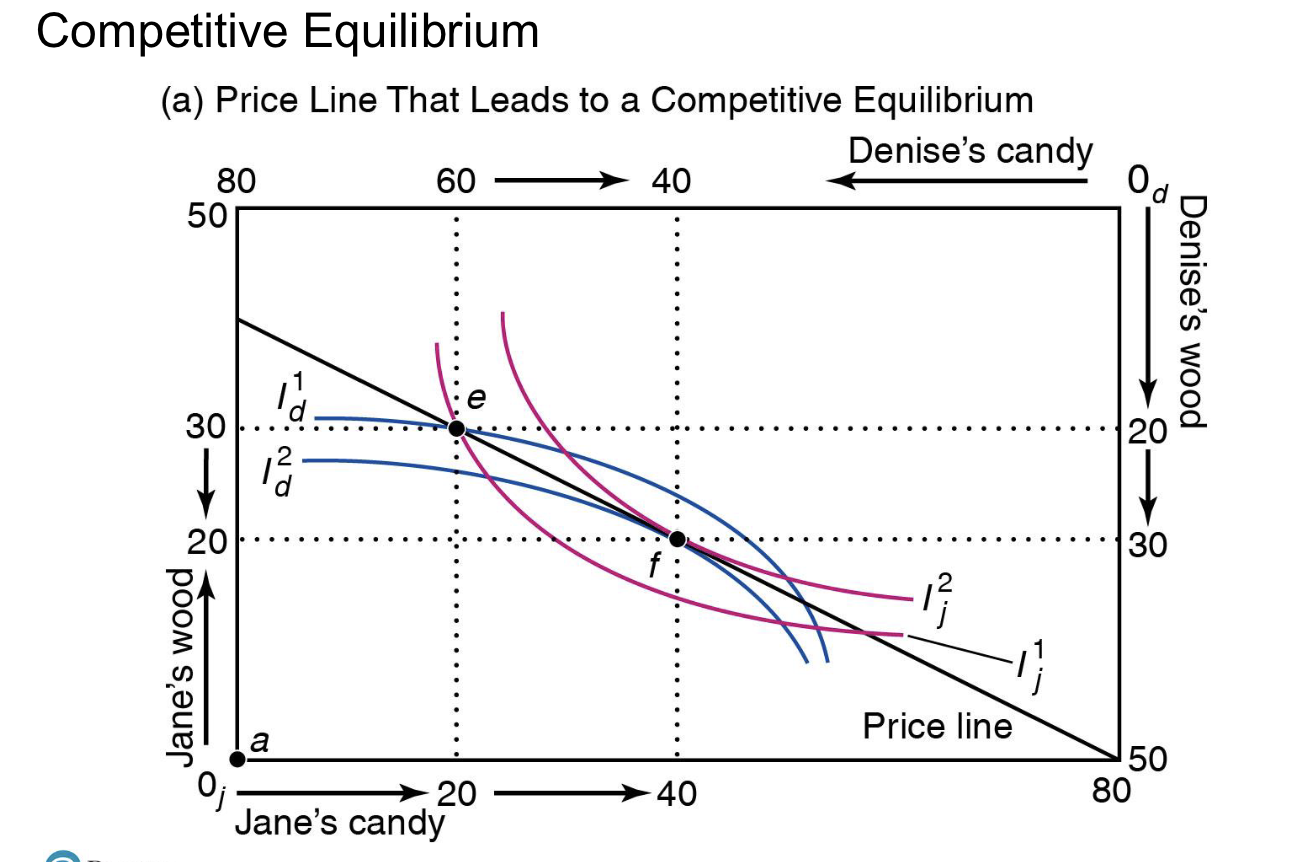
What is the slope of the price line?
-P1/P2
At the competitive equilibrium, what should be equal?
MRSA = MRSB = -P1/P2
Indifference curves are tangent to each other
(1st theorem of welfare economics: any competitive equilibrium is Pareto efficient)
Why does the competitive equilibrium demonstrate the 2nd theorem of welfare economics?
The price-line (or BC) goes through the competitive equilibrium. Any initial allocation along the price line will result in the competitive equilibrium.
Production possibilities frontier (PPF)
shows the maximum combinations of two goods that can be produced from a given input
What is the slope of the PPF?
MRT
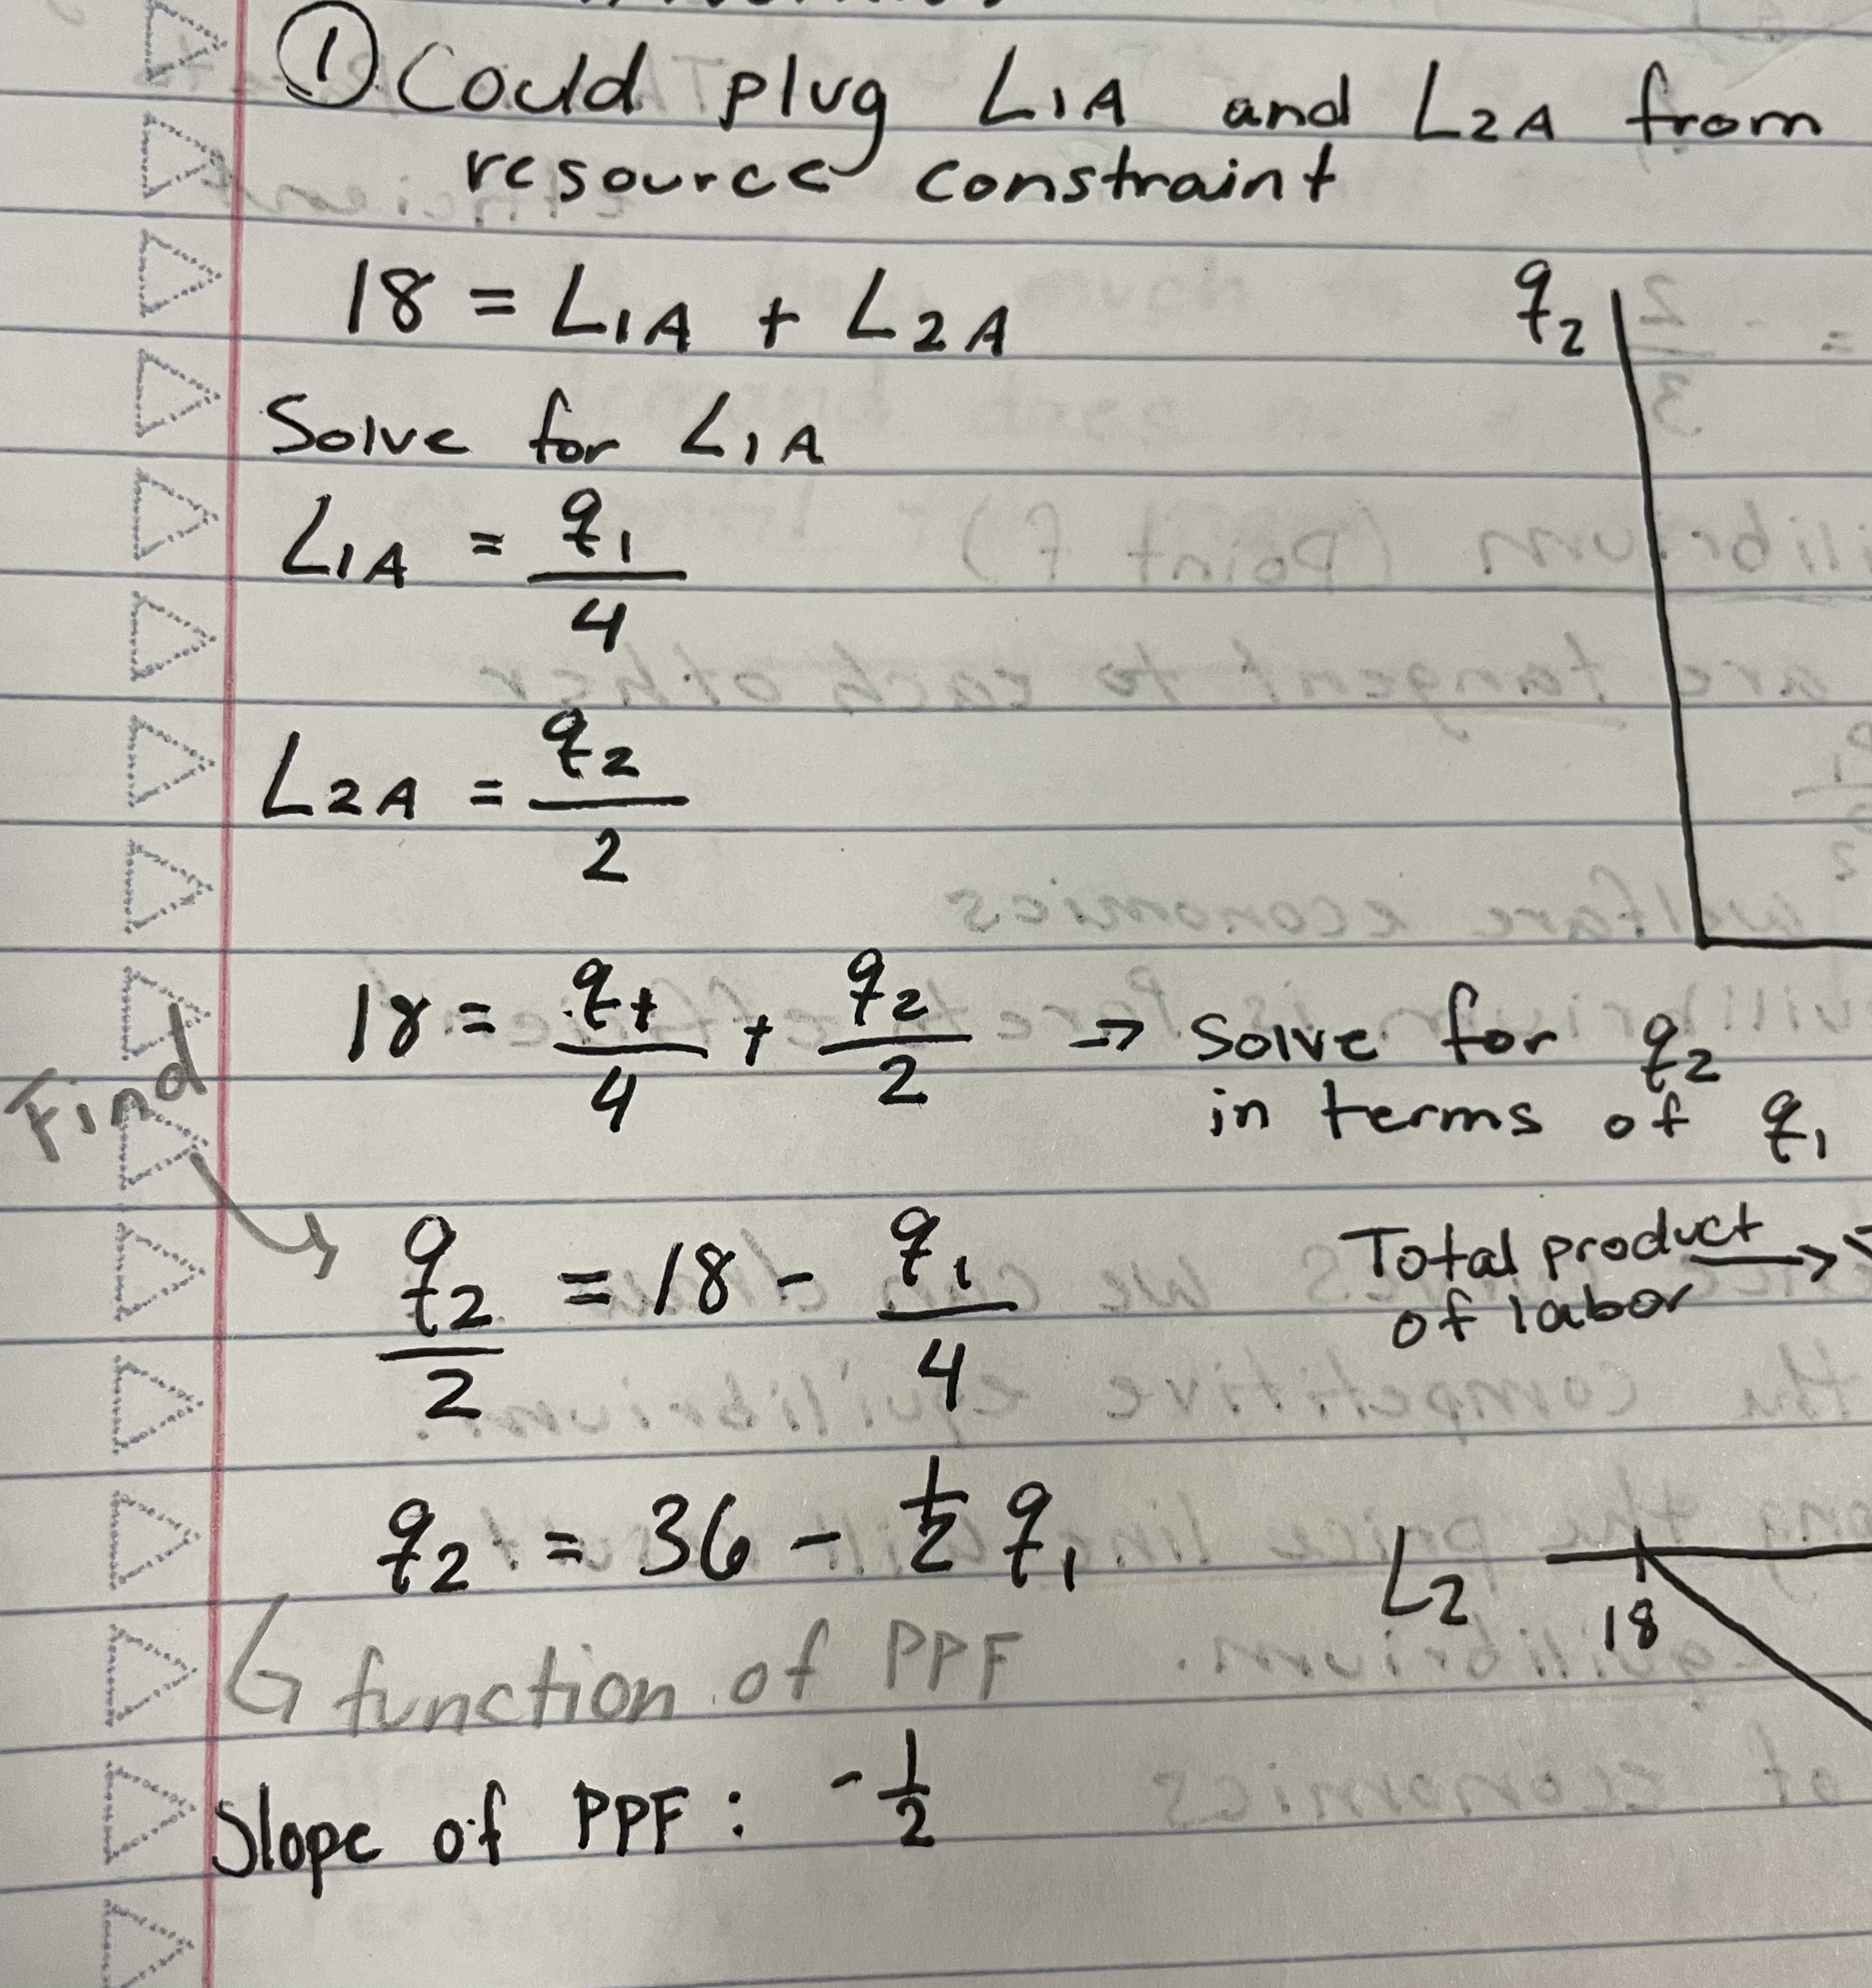
What is the method to find production possibilities frontier given production functions and resource constraints?
*Remember this is an economy with 2 goods and one input: labor
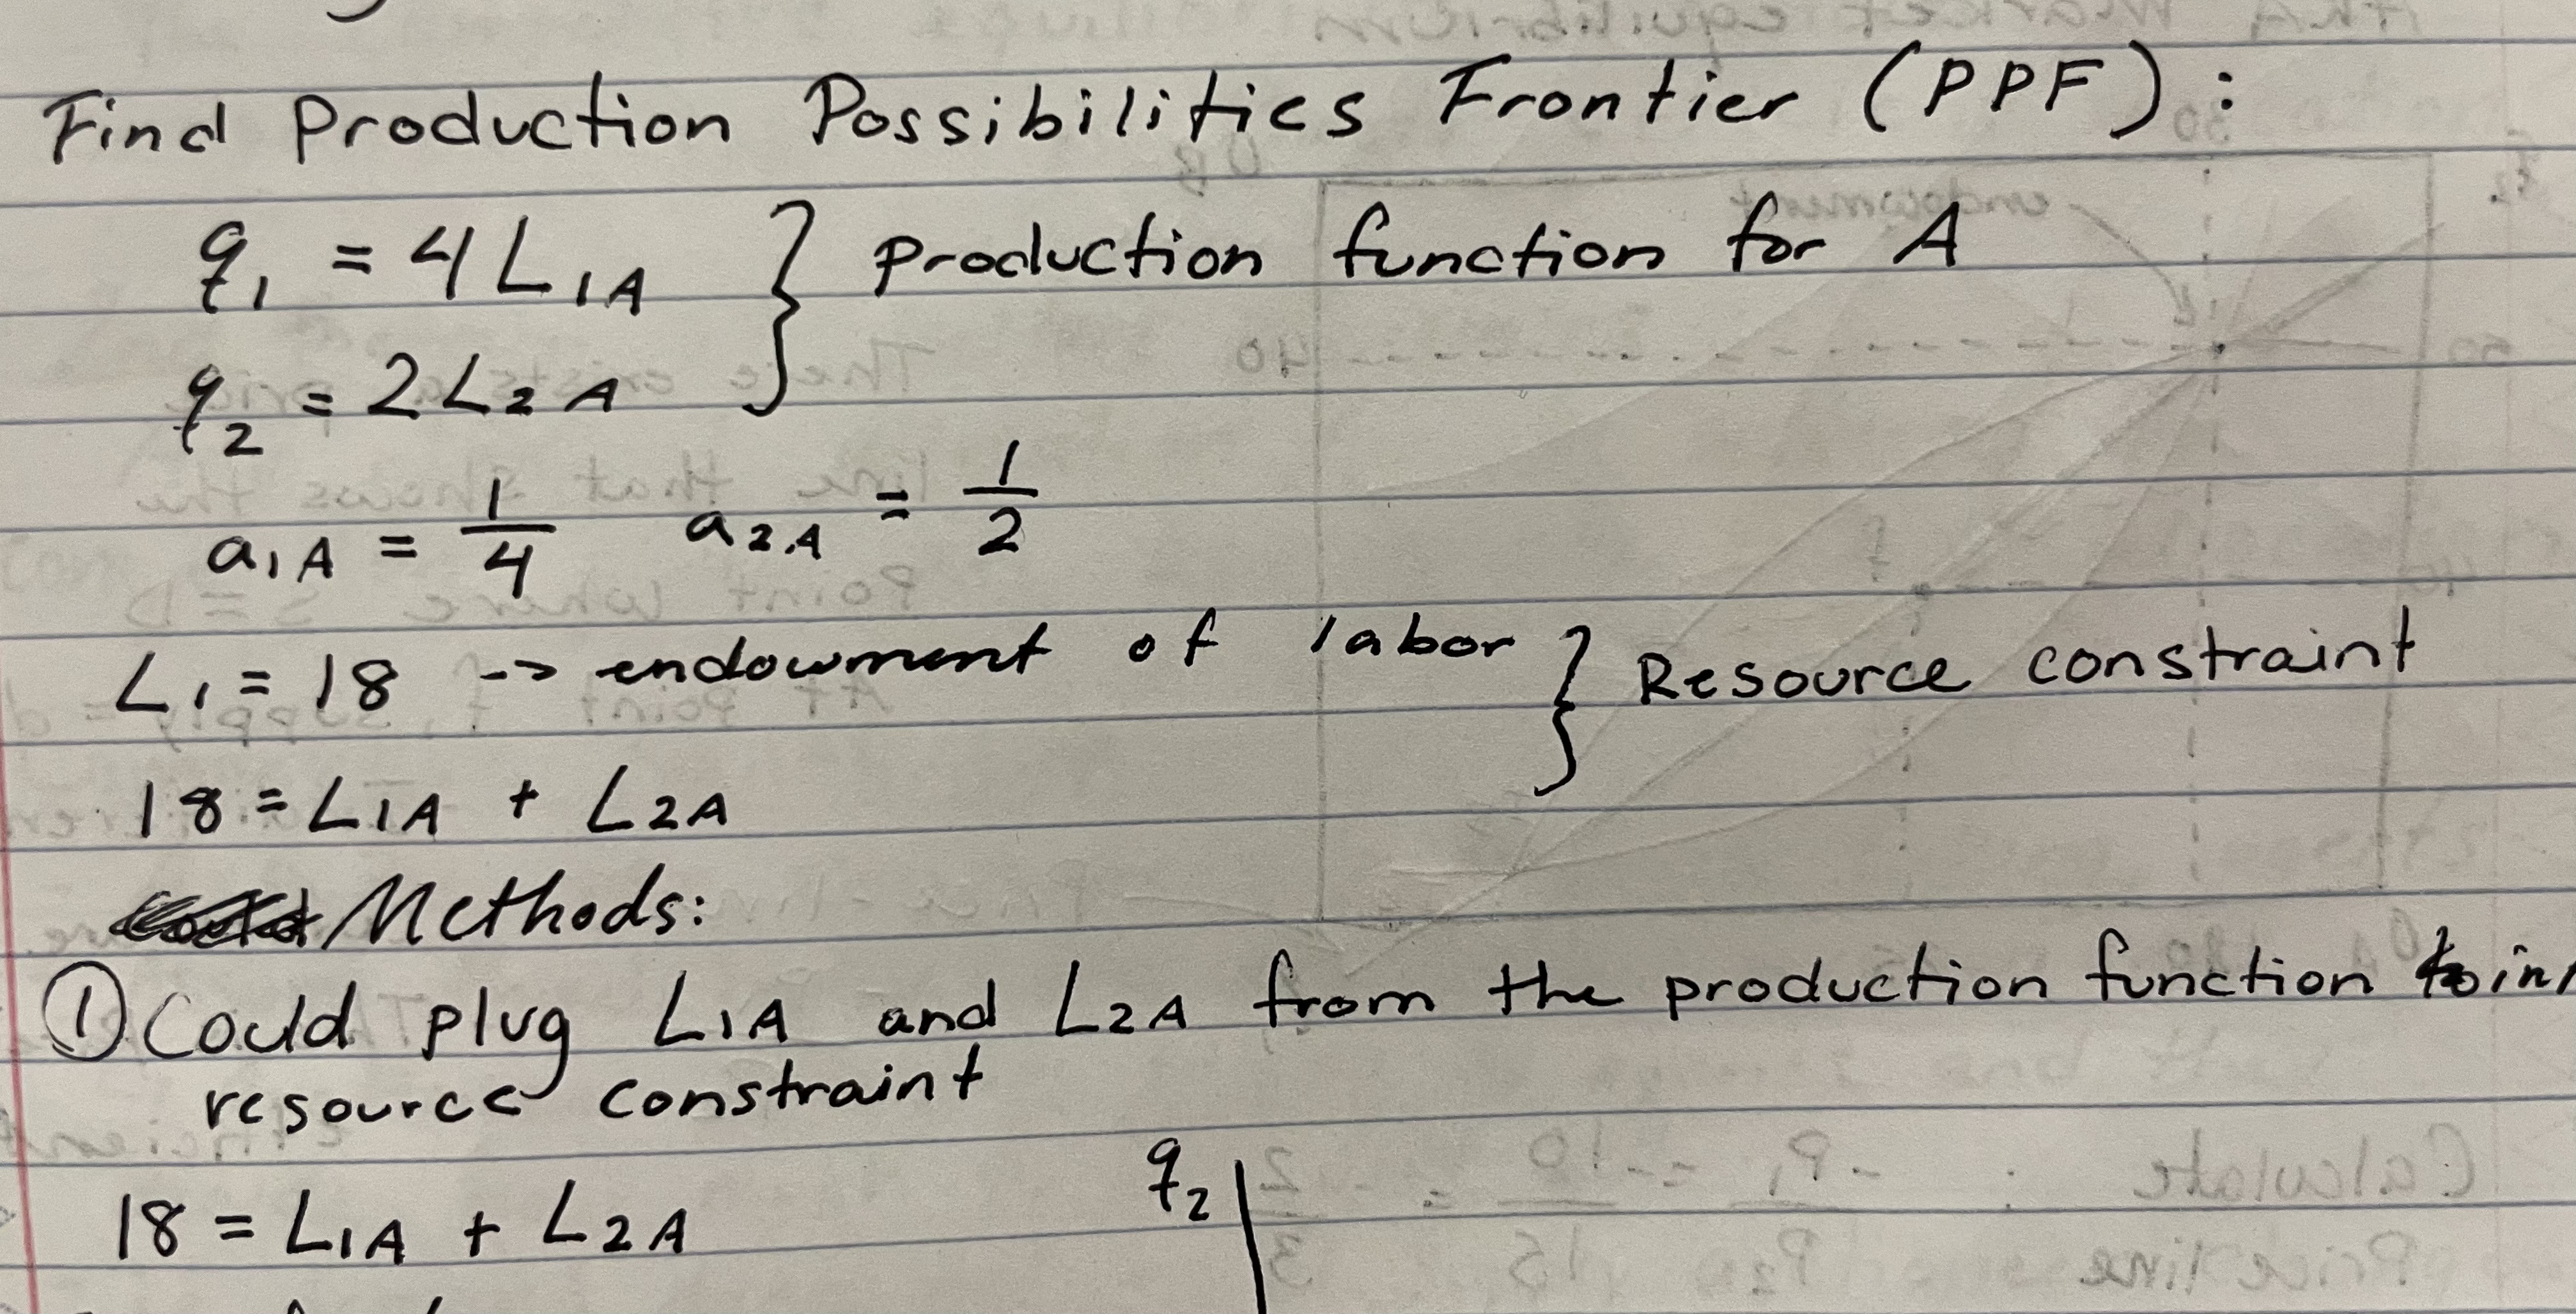
Plug L1a and L2a from the production function into resource constraint.
solve for q2 in terms of q1 (this is function of PPF)
Find slope, which is the MRT or -a1/a2
(*Really just need to look at notes for this one)
What does ai stand for in terms of PPF calculation?
(ai is) units of labor needed to make one unit of good i.
What can we assume about the MRT in perfect competition?
-P1/P2 = -MC1/MC2 = -a1/a2 = MRT
What is a comparative advantage?
Being able to produce at a lower opportunity cost than someone else.
With many producers the PPF is a
smooth concave curve
With a concave PPF, what happens to the MRT as we move up the curve?
the MRT decreases (as we move up the curve; getting closer to 0)
Important formula for MRT
MRT = MCx/MCy
If a single person were to decide on a mix of production, what combination of goods should be chosen?
Choose a combination where utility is maximized
MRT = MRS
At the consumption efficiency, each consumer picks a bundle so that
MRS = -p1/p2
If both goods are sold by competitive firms, the consumption efficiency would equal
-p1/p2 = -MC1/MC2 = MRT
(*So, price ratio must equal the MRT)
The competitive equilibrium lies on the
contract curve
Technical definition (formulas) of how at the competitive equilibrium, we achieve an efficient production mix
MRT = -p1/p2 = MRS
By combining the PPF and an Edgeworth box, we can show the __________ in both production and consumption
competitive equilibrium
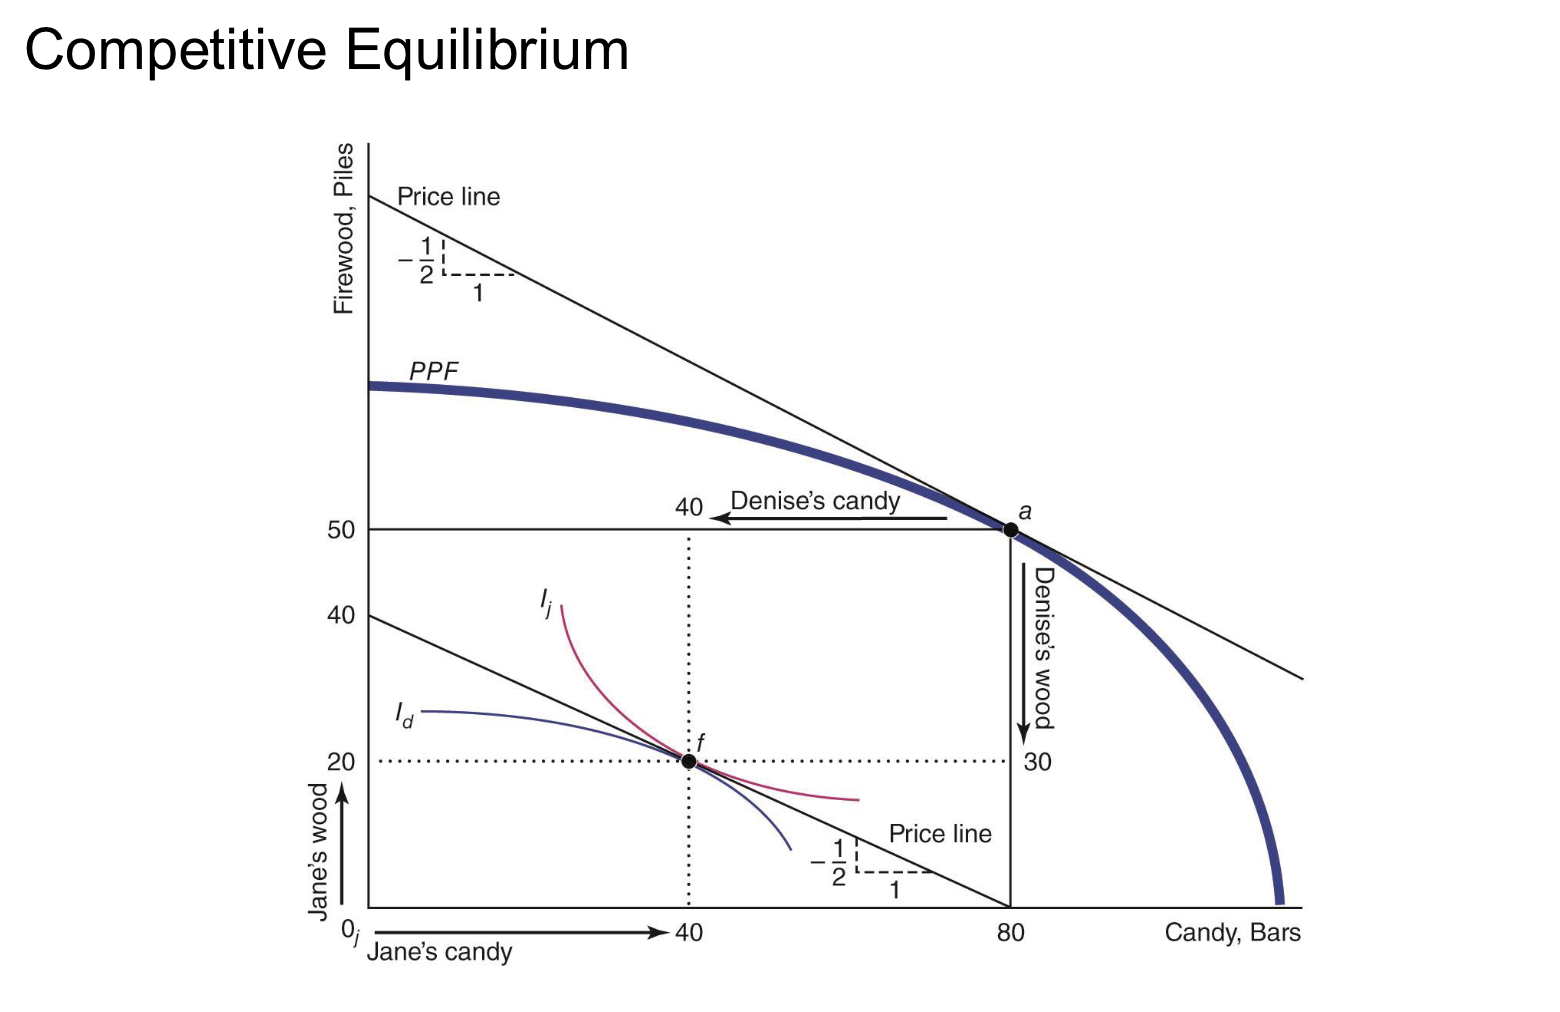
(point a determines size of edgeworth box)
Market participants will trade from the initial allocation point up to where the
market price line intersects the contract curve
What is the difference between the price line and contract curve?
the price line represents the budget constraint given prices.
Contract curve represents all Pareto-efficient allocations.