2- Origins of genetic variation
1/22
There's no tags or description
Looks like no tags are added yet.
Name | Mastery | Learn | Test | Matching | Spaced | Call with Kai |
|---|
No analytics yet
Send a link to your students to track their progress
23 Terms
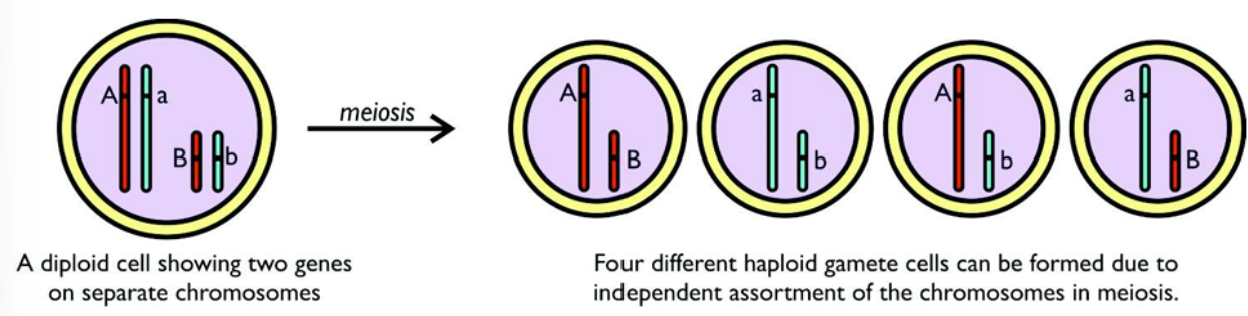
What is Mendel’s second law?
The principle of independent assortment.
It states that alleles of different genes are inherited independently; in other words the inheritance of one gene does not affect the inheritance of the other.
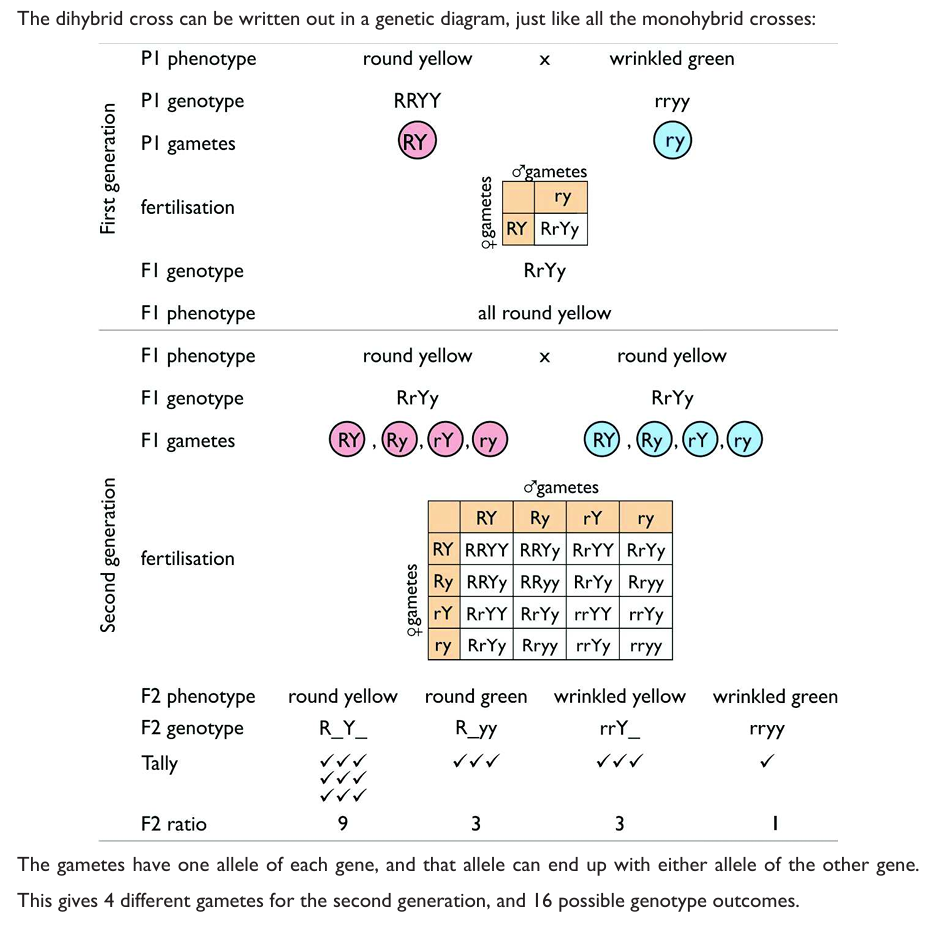
Give an example diagram of a dihybrid cross involving two genes.
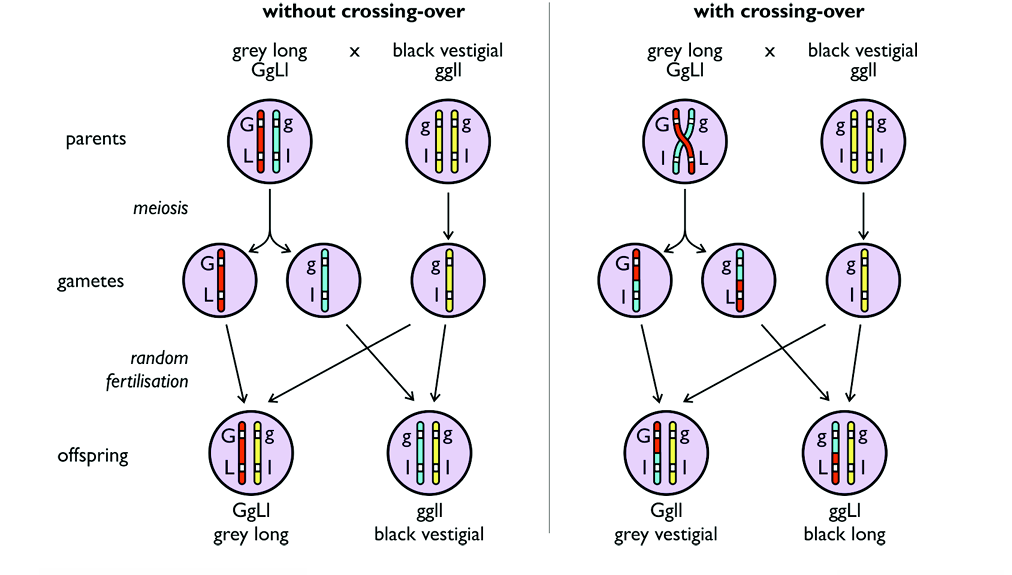
What is it called when two genes are on the same chromosome and are not independent and what does it cause during meiosis?
Linked genes.
The linked genes remain together during meiosis so they are inherited together. This is called autosomal linkage.
When and why can the linkage of linked genes sometimes be broken?
The linkage can be broken due to crossing-over during meiosis, so the alleles can mix up and this genetic recombination can cause a different phenotype and genotype to be able to occur in the offspring.
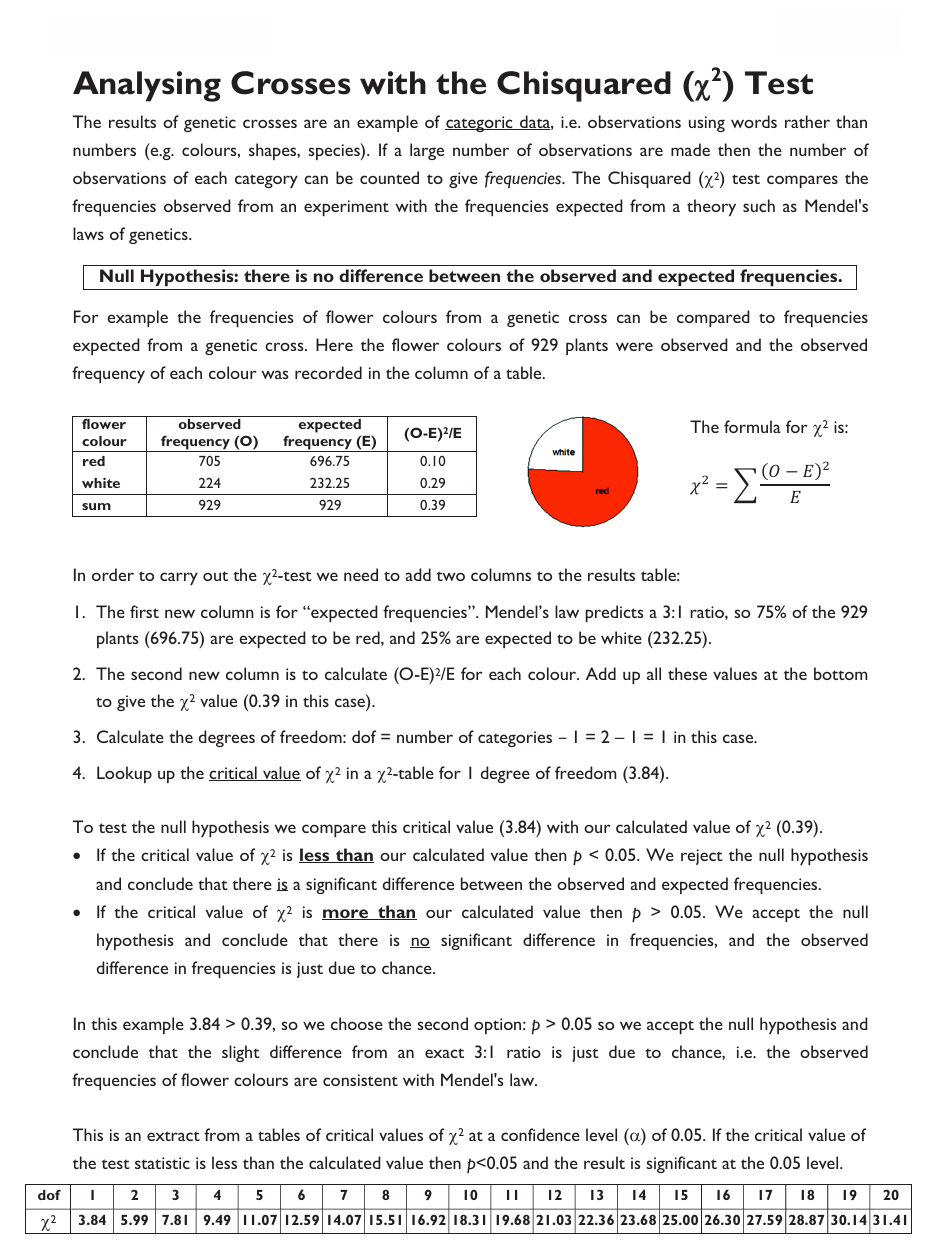
What statistical test can you use to analyse crosses?
Chisquared (x2) test
What are the steps of doing the chisquared test?
Add two columns to the results table, the first new column is for ‘expected frequencies’, the second column is to calculate (O-E)2 /E for each category e.g. colour.
Add up all of these values at the bottom to give the x2 value (0.39 in the picture)
Calculate the degrees of freedom: dof= number of categories- 1= 2-1= 1 in the case of the picture.
Lookup the critical value of x2 in a x2 table for 1 degree of freedom
To test the null hypothesis compare the critical value with the calculated value.
if the critical value of x2 is less than our calculated value then p < 0.05. And the null hypothesis is rejected so there is a significant difference between the observed and expected frequencies.
if the critical value of x2 is more than our calculated value then p > 0.05. And we accept the null hypothesis and conclude that there is no significant difference in frequencies, and the observed difference in frequencies is just due to chance.
Define the gene pool.
The sum of all the alleles of all the genes of all the individuals in a population.
What is the Hardy-Weinberg equation?
p2 + 2pq + q2 = 1
What does the Hardy-Weinberg equation predict?
The frequencies of dominant and recessive alleles in a gene pool remain constant over time.
What are the five key conditions a population must meet before it can be predicted that the frequencies of dominant and recessive alleles in a gene pool remain constant over time.
There are no mutations, so no new alleles are created.
There is no immigration, so no new alleles are introduced, and no emigration, so no alleles are lost.
Mating is random, so alleles are mixed randomly in sexual reproduction.
The population is large, so no alleles are eliminated by genetic drift.
There is no selection, so no alleles are favoured or eliminated.
These conditions mean that there is nothing to disturb the gene pool, which therefore remains in a stable genetic equilibrium. So the allele frequencies in the population will remain constant from generation to generation.
What are the three frequencies the Hardy-Weinberg equation can be used to calculate?
Allele frequency
Genotype frequency
Phenotype frequency
What are the formula used to calculate each frequency the Hardy-Weinberg equation can calculate?
Allele frequency recessive allele (a) = q
dominant allele (A) = p
Genotype frequency homozygous recessive (aa) = q2
homozygous dominant (AA) = p2
heterozygous (Aa) = 2pq
Phenotype frequency recessive phenotype = q2 dominant phenotype = p2 + 2pq
Define evolution.
A change in allele frequencies of a population’s gene pool over time.
If evolution occurs, one of five conditions of the Hardy-Weinberg principle is not true. What are the disturbing factors?
Mutations- the original source of new alleles and genetic variation.
Gene flow- the movement of alleles between populations.
Non-random mating- changes in allele frequency due to inbreeding.
Genetic drift- changes in allele frequency in a small population due to chance.
Selection- changes in allele frequency due to natural or sexual selection, producing adaptive changes in response to the environment.
What are the two common examples of genetic drift?
Genetic bottlenecks
The founder effect
When does a genetic bottleneck occur?
When a population is drastically reduced in size due to a natural catastrophe. The few survivors will only have a small range of alleles between them, with many of the original alleles being lost in the large numbers who died.
As the population grows again it will have a very different set of allele frequencies from the original parent population.
Give examples of a genetic bottleneck.
Cheetahs are a threatened species partly due to their very low genetic diversity. This is probably due to a genetic bottleneck at the end of the last glacial period ten thousand years ago.
An extreme case is the Golden Hamster, of which the vast majority are descended from a single litter found in the Syrian Desert around 1930.
Humans also have very low genetic diversity compared to other primate species. Analysis of mitochondrial and Y chromosome DNA from humans suggests that modern humans went through a genetic bottleneck 70 000 years ago when the world population fell to 15 000 due to the environmental changes following the eruption of the Toba super volcano in Indonesia.
When does the founder effect occur?
When a small number of individuals colonise a new habitat and start a new isolated population. Since the few individuals will only have a small range of alleles between them, the founder effect is an example of a genetic bottleneck (or colonisation bottleneck). These new populations will have low genetic diversity, reflecting the small range of alleles in the small founding population. In extreme cases a founding population can be as small as a single pregnant female animal or a single plant seed.
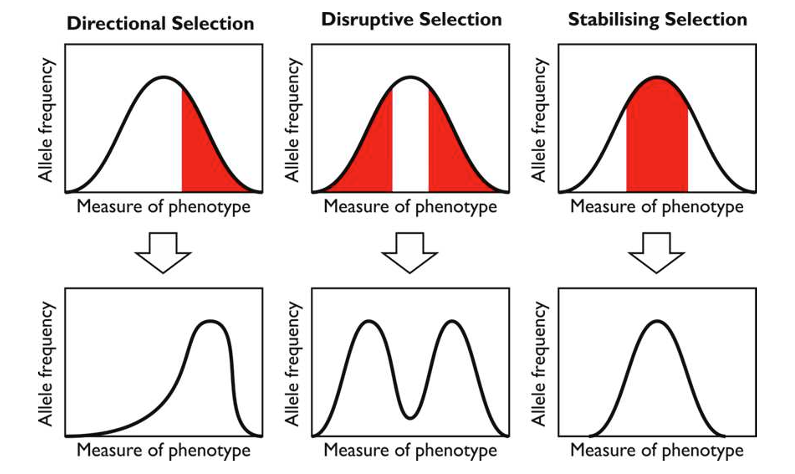
What are the three different kinds of natural selection?
Directional selection
Disruptive selection
Stabilising selection
When does directional selection occur and what is it?
It occurs when one extreme phonotype (e.g. tallest) is favoured over the other extreme (e.g. shortest).
This happens when the environment changes in a particular way, this can include biotic and abiotic factors, so organisms evolve in response to each other. e.g. if predators run faster there is selective pressure for prey to run faster, or if one tree species grows taller, there is selective pressure for other to grow tall.
Most environments do change (due to migration of new species, natural catastrophes, climate change, sea level change, continental drift etc) so directional selection is common.
When does disruptive (or diverging) selection occur and what is it?
It occurs when both extremes of phenotype are selected over intermediate types.
E.g. in a population of finches, birds with large and small beaks feed on large and small seeds respectively and both do well, but birds with intermediate beaks have no advantage, and are selected against.
When does stabilising (or normalising) selection occur and what is it?
This occurs when the intermediate phenotype is selected over extreme phenotypes, and tends to occur when the environment doesn’t change much.
E.g. birds’ eggs and human babies of intermediate birth weight are most likely to survive. Natural selection doesn’t have to cause a directional change, and if an environment doesn’t change there is no pressure for a well-adapted species to change. Fossils suggest that many species remain unchanged for long periods of geological time.
What can histograms showing the three kinds of natural selection look like?