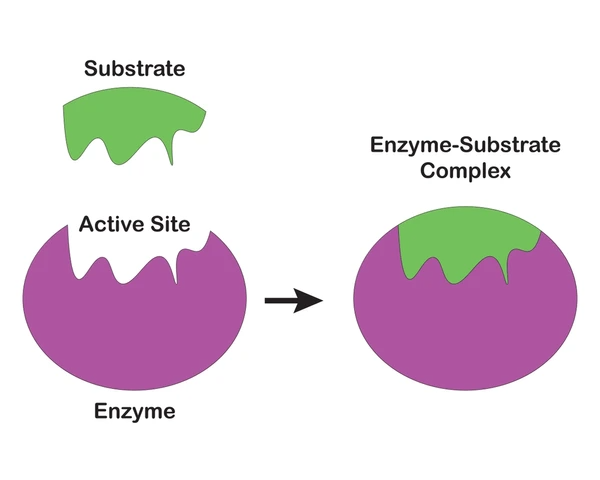
Enzyme-substrate interactions
1/39
There's no tags or description
Looks like no tags are added yet.
Name | Mastery | Learn | Test | Matching | Spaced | Call with Kai |
|---|
No analytics yet
Send a link to your students to track their progress
40 Terms
Name 6 factors that affect enzyme activity:
Peter Definitely Took Everyone’s Inari Sushi
pH
Denaturing reagents
Temperature
Enzyme concentration
Substrate concentration
Inhibitors
How does pH affect enzyme activity?
pH affects ionisation of side chains and active site
Extreme pH causes denaturation
What do denaturing reagents do?
Disrupt protein structure
Name some denaturing reagents:
Detergents
Urea
Guanidinium hydrochloride
How does temperature affect enzyme activity?
Increases kinetic energy and collision rate
High temperatures cause protein unfolding.
How does enzyme concentration affect enzyme activity?
More enzymes means more active sites, which means higher maximum rate.
How does substrate concentration affect enzyme activity?
The rate increases with substrate concentration until enzymes are saturated.
How do inhibitors affect enzyme activity?
Inhibitors reduce enzyme activity by blocking or altering the active site.
What 4 things do simple models assume?
Only one molecule of one substrate binds to the enzyme
Enzyme and substrate form a [ES] complex
Enzyme converts substrate to product and product release is fast
Products bind weakly to enzymes
What is v?
v = rate
What is [S]?
[S] = substrate concentration
What is Vmax?
Vmax = rate when all enzyme active sites are occupied
What is Km?
Km = [S] at which v = ½ Vmax.
The substrate concentration when half of all enzyme active sites are occupied.
What is the Michaelis-Menten curve?
It is a graph that shows how the rate of an enzyme-catalysed reaction changes as substrate concentration increases.
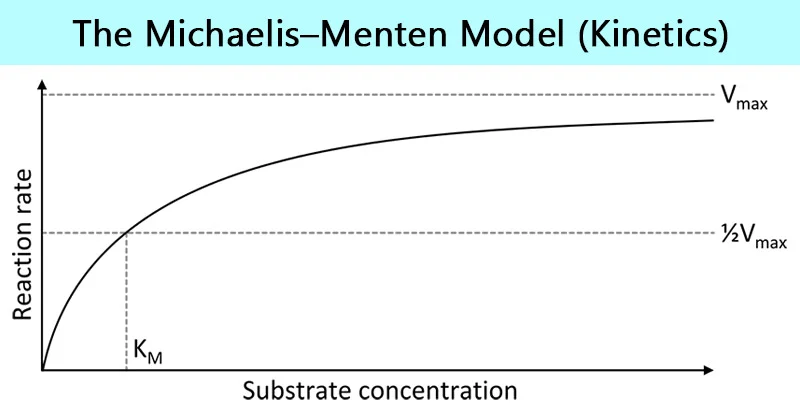
What are the axes on the Michaelis-Menten curve?
X-axis = Substrate concentration = [S]
Y-axis = Reaction rate = v
What does the Michaelis-Menten curve tell us?
At low [S], the rate of reaction increases rapidly as more [ES] complexes form
At high [S], the rate plateaus because all active sites are saturated
The maximum rate reached is called the Vmax
![<ul><li><p>At low [S], the rate of reaction increases rapidly as more [ES] complexes form</p></li><li><p>At high [S], the rate plateaus because all active sites are saturated</p></li><li><p>The maximum rate reached is called the Vmax</p></li></ul><p></p>](https://assets.knowt.com/user-attachments/bf8af5e1-0543-44b3-9ae8-642e2efc293f.png)
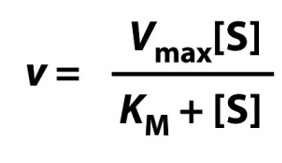
What’s the Michaelis-Menten equation?
Why do enzyme reactions saturate at high substrate concentrations?
Because all enzyme active sites become occupied, so adding more substrate cannot increase the rate further.
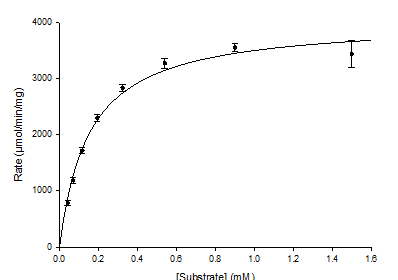
How can Km and Vmax be measured directly?
By plotting v against [S]
(Michaelis–Menten plot).
![<p>By plotting v against [S] </p><p>(Michaelis–Menten plot).</p>](https://knowt-user-attachments.s3.amazonaws.com/80280cd8-ff33-4ca9-8c6d-e43224faa89b.png)
What’s the downside of using the Michaelis-Menten plot?
It can be difficult to decide when Vmax is reached
What is the Lineweaver-Burk plot?
The Michealis-Menten curve is curved, which makes it hard to accurately determine the Vmax and Km
Therefore, the Michealis-Menten equation was rearranged into a reciprocal (inverse) form, giving a straight line graph
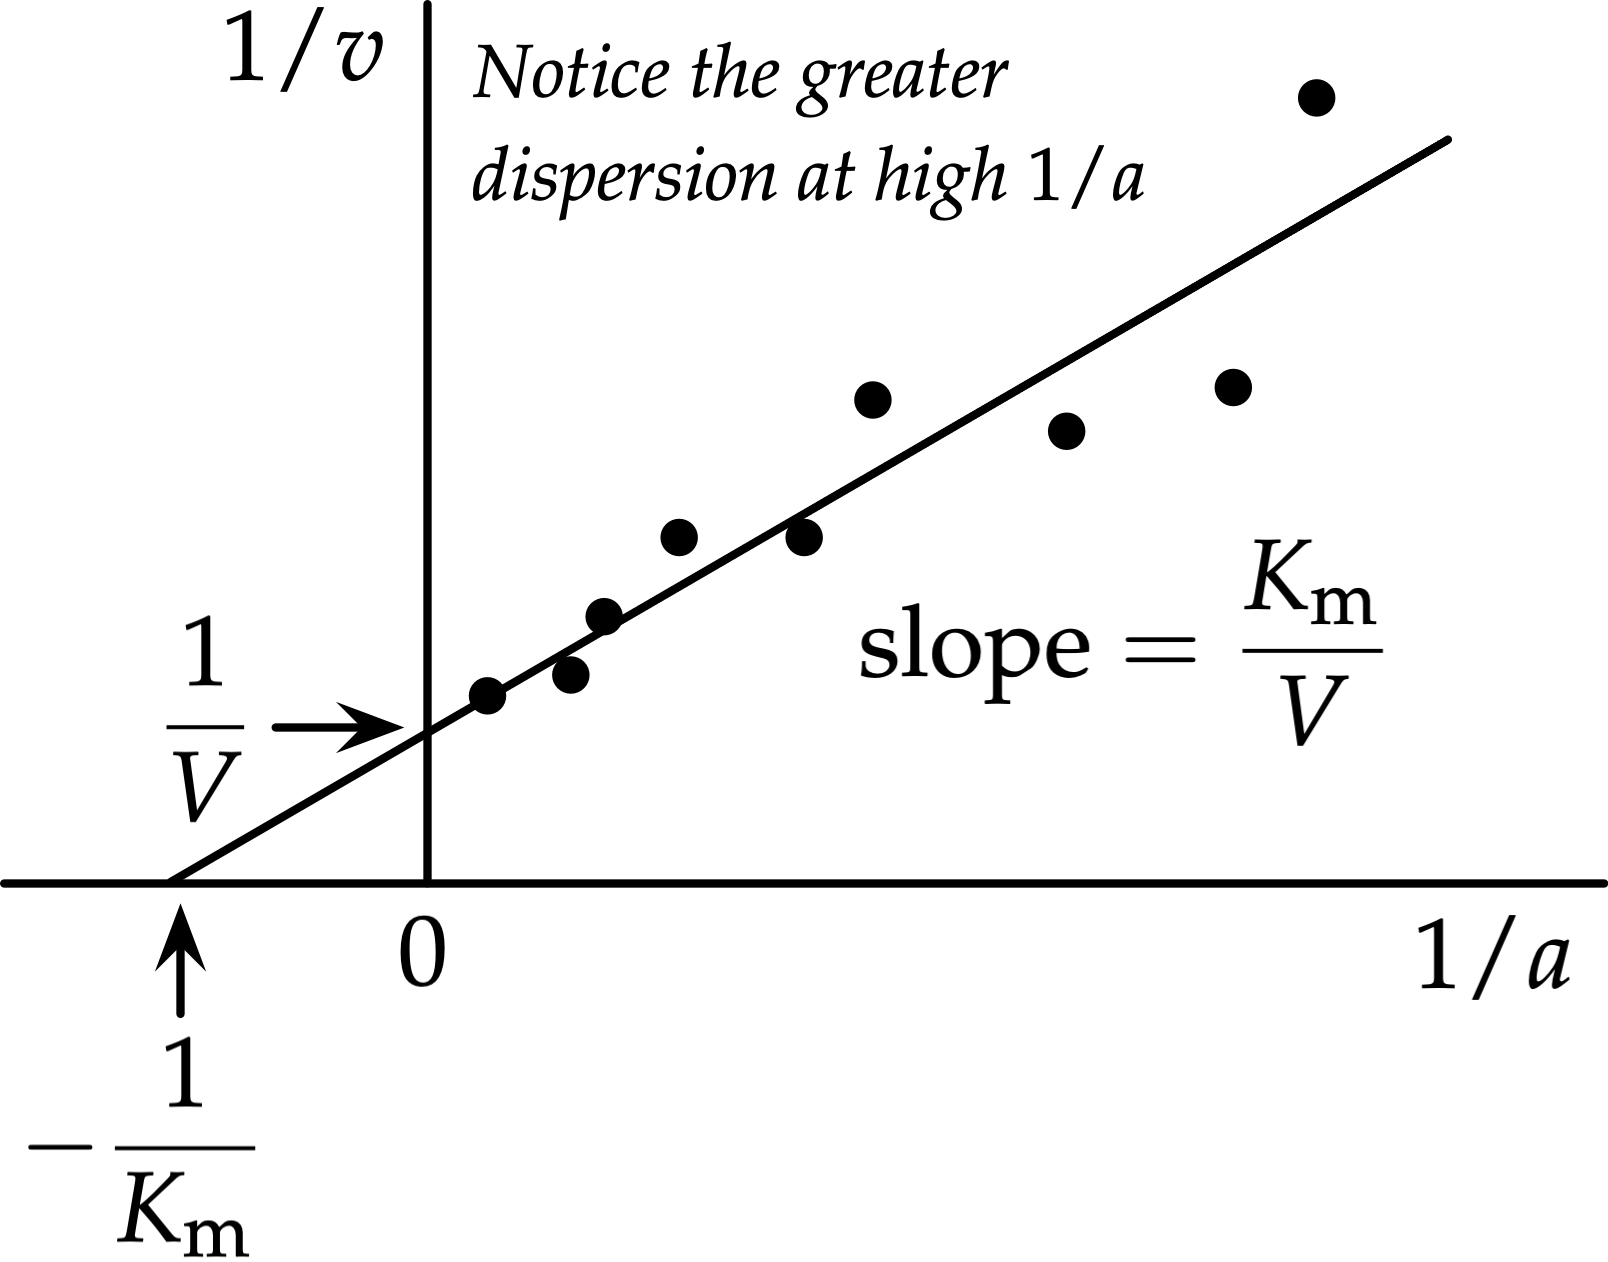
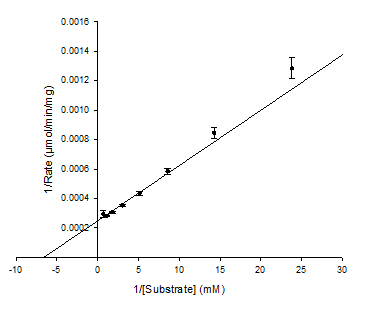
What are the axes of the Lineweaver-Burk plot?
X-axis = 1/[S]
Y-axis = 1/v
![<p>X-axis = 1/[S]</p><p>Y-axis = 1/<em>v</em></p>](https://assets.knowt.com/user-attachments/df6fe815-25b7-4c7d-a374-2fdc12739eb1.png)
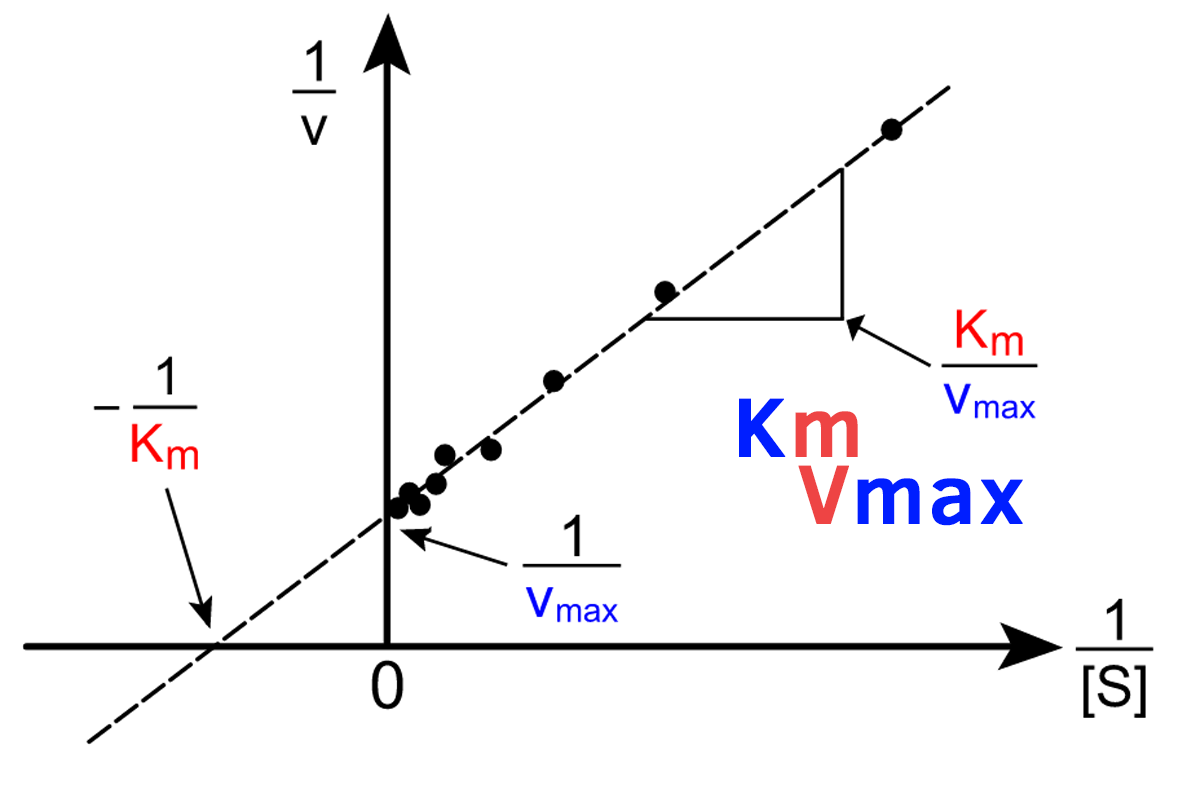
What does the y-intercept and x-intercept represent in the Lineweaver-Burk Plot?
Y-intercept = 1/Vmax
X-intercept = -1/Km
What’s the advantage of using the Lineweaver-Burk plot?
Higher precision
What are the disadvantages of using the Lineweaver-Burk plot?
Lower accuracy
Errors are not equal at all points (least squares regression is not appropriate).
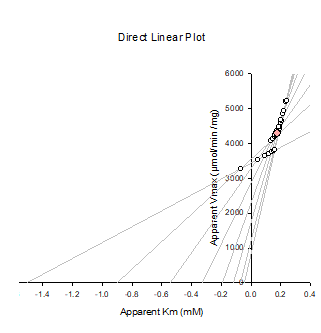
What is the Direct-Linear plot?
This plot uses the original Michaelis-Menten equation
Plots multiple straight lines from experimental data points
Finds where those lines intersect to estimate Vmax and Km
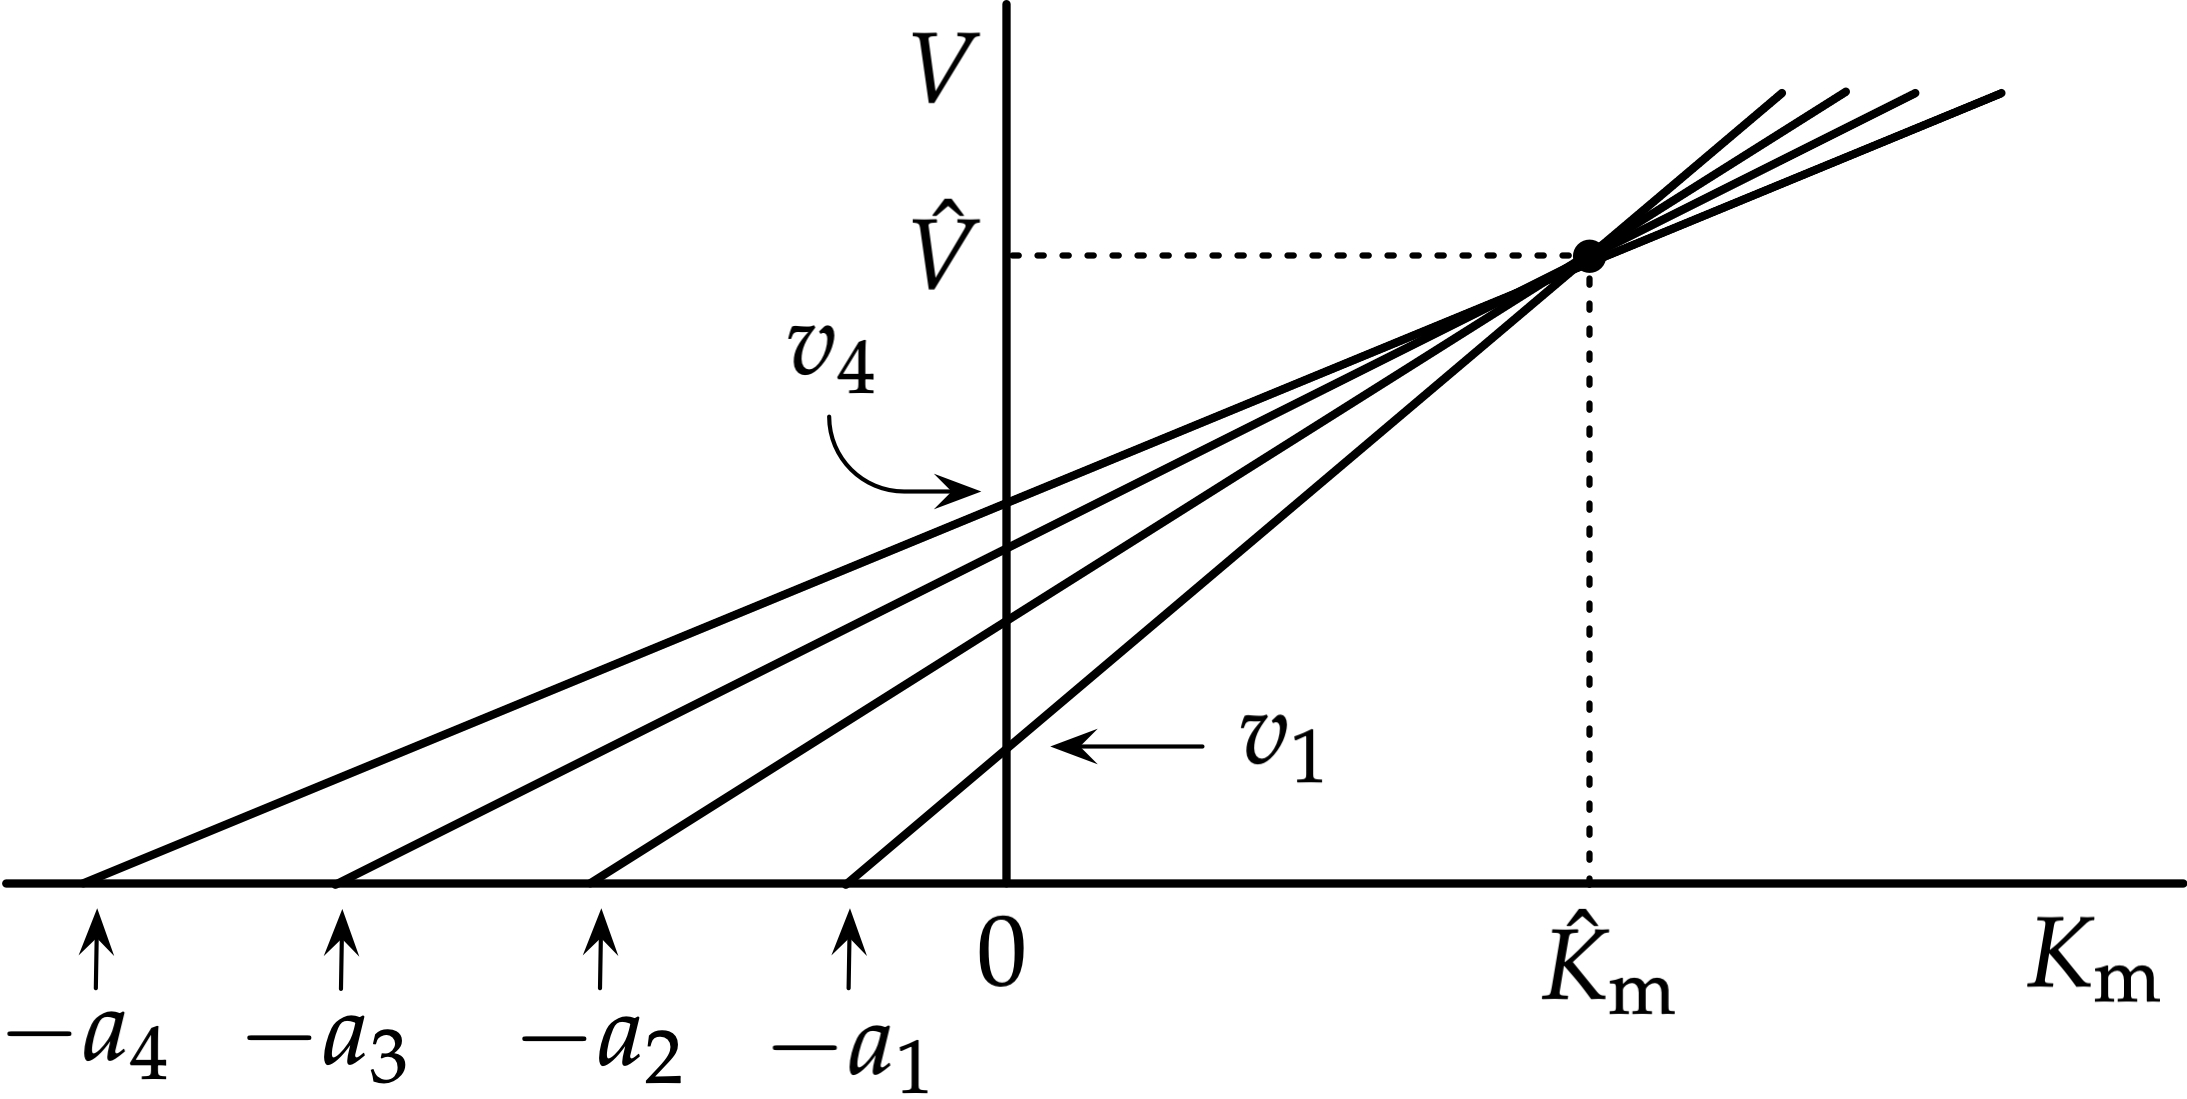
What are the axes in the Direct Linear Plot?
x axis = Km
y axis = Vmax
Each data point gives a straight line; all lines intersect near true Km and Vmax
Gives median value
What’s the advantages of the Direct Linear plot?
It makes no assumptions about the errors
It’s accurate
What is kcat?
The number of substrate molecules converted to product per enzyme per second when the enzyme is fully saturated with substrate (turnover number).
How do you calculate kcat?
kcat = Vmax ÷ Amount of enzyme.
What’s the unit for kcat?
s-1
What does kcat/Km represent?
A measure of enzyme efficiency at low substrate concentration, combining substrate binding (km) and catalytic rate (kcat), indicating how effectively an enzyme converts substrate to product.
What are 6 assumptions of the steady state model (Michealis-Menten)?
Substrate is in large excess over enzyme ([E] « [S])
[S] remains constant
Measured rate is initial rate (linear start of curve)
[ES] remains constant
The product binds weakly to enzyme
The backwards reaction is neglible
If Vmax = 0.5 what does that mean?
The maximum rate of the enzyme catalysed reaction is 0.5 units per unit time.
What does Km tell us?
It tells us how strongly an enzyme binds to its substrate.
What does a low Km mean?
A low Km means the enzyme binds tightly (it works well even at low substrate levels).
What does a high Km mean?
A high Km means the enzyme binds weakly (it needs more substrate to work efficiently).
What does Kcat show?
How fast the enzyme can convert substrate to product once the substrate is bound.
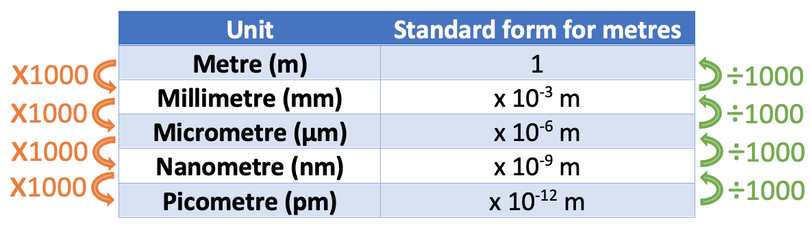
Unit conversions
Exam Question:
In an enzyme kinetic experiment, the value for 1/Vmax was 0.102 min/nmol and -1/Km was -3.45 mM-1 from a Lineweaver-Burk (double reciprocal) plot.
Each assay contained 0.14 mg of enzyme with a molecular weight (MW) of 47,146 Da.
Showing your workings, calculate values for Vmax, Km, kcat, kcat/Km, assuming one active site per monomer (hint: kcat = Vmax divided by amount of enzyme)
[10 marks].
Vmax
1/Vmax = 0.102 min/nmol
1/Vmax = 0.102 min nmol-1
Vmax = 9.8 nmol min-1
Km
-1/Km = -3.45 mM-1
1/Km = 3.45 mM-1
Km = 0.29 mM
Kcat
0.14 mg of enzyme with MW of 47,146 Da
47,146 Da = 47,146 gmol-1
0.14mg = 0.00014g
mol = 0.00014g / 47146 gmol-1
mol = 2.97 × 10⁻⁹
Kcat = Vmax / Amount of enzyme
9.8nmol min-1 = 9.8 × 10⁻⁹ mol min-1
Kcat = 9.8 × 10⁻⁹ mol min-1 / 2.97 × 10⁻⁹ mol
Kcat = 3.30 min-1
Kcat = 0.0550 s-1
Kcat/Km
0.0550 s-1 / 0.29mM = 0.190 mM-1 s-1
0.190 mM-1 s-1
Kcat/Km = 190 M-1 s-1