Year 12 WACE Geography Unit 3 Flashcards 2025
1/60
There's no tags or description
Looks like no tags are added yet.
Name | Mastery | Learn | Test | Matching | Spaced |
|---|
No study sessions yet.
61 Terms
Define the Concept of Environment:
Environment: The living (biotic elements – plants & animals) & non-living (abiotic elements – rocks & air) elements of the Earth’s surface & atmosphere including changes made by humans.
Broadly classified as the cultural (modified by humans) or natural environment & can exist on various scales (local, regional, global).
→ E.g., the local environment at Point Walter Reserve in Bicton or the regional environment of the Jarrah forests in Southwest WA.
Define the Concept of Natural & Anthropogenic Biomes:
Biome: A community of life forms adapted to a large natural area, biomes have two main categories: natural and anthropogenic.
Natural Biome: A biological community of living organisms adapted to a large natural area and has not been directly altered or changed by human activity.
Natural biomes include aquatic, deserts, forests, tundra and grasslands featuring distinctive vegetation, climate & soil characteristics.
→ E.g., plants within a tropical rainforest adapt to hot & wet conditions such as drip tip leaves, thin/smooth bark & climbing woody vines that capture sunlight.
Anthropogenic Biome: Biomes that result from sustained direct human interactions within ecosystems altering the form and function of the terrestrial biosphere.
→ E.g., anthropogenic biomes include urban, rural or villages, croplands & rangelands – Metropolitan Perth is an anthropogenic biome that is urban in nature due to the establishment & growth of urban settlements which has replaced natural vegetation.
Define the Concept of Land Cover Change
Land Cover Change: Changes that have taken place in natural environments due to a variety of natural (climate change or natural hazards) and/or human induced causes (deforestation urban expansion, agriculture & mining).
→ E.g., over the last 100 years 90% of native woodlands have been cleared in the Wheatbelt Region of WA for agriculture resulting in loss of habitats, biodiversity loss and land & soil degradation (salinity & erosion).
→ E.g., Urban encroachment into areas of native vegetation and/or farmland, over 900 hectares of native vegetation is converted into urban areas in Perth per year.
Define the Concept of Ecosystem Structure & Dynamics:
Ecosystem: A community made of biotic & abiotic elements that interact with each other through energy & nutrient cycles. While environment refers to the surroundings, ecosystem means the interaction between the environment & living organisms.
Ecosystem structure refers to biotic & abiotic elements with a hierarchy of organisms consisting of trophic levels including producers, consumers & detritus.
→ E.g., Coral reefs such as the Great Barrier Reef or the Ningaloo Reef (marine ecosystem).
Ecosystem Dynamics: The relationships between biotic & abiotic elements including the flow of energy between the elements (food chains & food webs). There is also an exchange of matter between biotic & abiotic elements (i.e., nutrient cycle).
→ E.g., Water is recycled as well as the exchange of carbon between sinks and sources.
Define the Concept of Biodiversity Loss:
Biodiversity Loss: the extinction of plant and/or animal species worldwide, & the local reduction or loss of species in a certain habitat.
→ E.g., In Southwest WA black the black cockatoo population has been decimated by land clearing for anthropogenic activities such as urban areas, mining & agriculture – over 50% of the population of 3 species have been lost over the last 50 years.
→ E.g., only 50% of Australia’s forests & bushland remain intact compared to pre-European arrival.
Causes of biodiversity loss may result from natural processes & anthropogenic activity
→ Natural causes: asteroid impacts, large volcanic eruptions, sea level changes and interglacial & glacial periods.
→ Anthropogenic causes: land cover change (e.g., deforestation), introduction of feral animals, overexploitation (e.g., fishing) & introduction of genetically modified species (e.g., crops in farming)
→ E.g., due to deforestation, Indonesia has the highest number of declining species in the world.
Define the Concept of Climate Change:
Climate Change: A long-term change in the statistical distribution of weather patterns in a place over periods of time ranging from decades to millions of years. It may be a change in the average condition or a change in the distribution of weather events in respect to an average. Climate change may be limited to a specific region or occur across the Earth.
→ i.e., the Global surface temperatures have risen 1.2°C since 1880, in Australia surface temperatures have increased by 1.5°C since 1910.
→ E.g., 2024 was the hottest year on record (since 1880)
→ Climate change has been caused by various natural processes & anthropogenic most recently human activities such as burning fossil fuels & deforestation have been identified as significant causes of climate change.
Define the Concept of Sustainability:
Sustainability: Meeting the needs of current and future generations through simultaneous, economic, environmental & social adaptations & improvements, achieved by the development & implementation of responsible, long-term planning & risk management.
→ E.g., Sustainable strategies mitigate effects of climate change by shifting from finite energy sources like coal to renewables like wind & solar, reducing greenhouse gas emissions.
→ E.g., The increase in investment in public transport infrastructure aims to decrease vehicle emissions & address traffic congestion.
Describe how Remote Sensing Images are used to Identify & Measure the Location, Type, Rate & Extent of Land Cover Change:
Remote Sensing: Science of obtaining information about objects or areas from a distance, from aircraft or satellites producing aerial, satellite & infrared images of oceans, land use, & vegetation to measure location, type, rate & extent of land cover change overtime.
→ Extent: The size & area of land cover change (LLC).
→ Rate: The speed at which changes have taken place over a period of time.
→ Type: The category of land cover change occurring such as deforestation.
→ Location: Can be examined at a range of scales, from local, regional to global.
→ E.g., The Landsat project collects data from a series of satellites creating a variety of remote sending imagery. Since launched in 1972 there has been a total of 9 satellites, the most recent (Landsat 9) takes over 700 scenes per day – the data obtained plays a critical role in monitoring, understanding & managing land cover change.
What do you Discuss when asked to:
Describe the Processes of Land Cover Change, including Deforestation, the Expansion & Intensification of Agriculture, the Growth of Urban Settlement & Mining:
There are four main processes of land cover change including:
Deforestation
Expansion & intensification of agriculture
Growth of urban settlement
Mining
Describe the Processes of Land Cover Change, including Deforestation:
Deforestation: The removal & conversion of forests to other land uses (e.g., agriculture, urban development, & mining) resulting in the permanent conversion for forest, where trees aren’t expected to grow.
→ E.g., agriculture accounts for 40% of deforestation on a global scale.
→ Highest amount of deforestation occurs along the equator in tropical rainforests.
→ Up to 90% of native woodlands have been cleared in the wheatbelt region of WA since the early 1900s.
→ Annual rate of deforestation is slowing: 12 million hectares were cleared between 2010-2015 down to 10 million hectares between 2015-2020.
Forms of Deforestation include:
→ Clear-felling
→ Selective Felling or thinning
→ Wildfires
→ Slash & burn
Describe the Processes of Land Cover Change, including Expansion & Intensification of Agriculture:
Expansion of Agriculture: The increasing amount of land available for agriculture in a place involving the large-scale deforestation of habitable land.
→ Nearly 50% of the worlds habitable land is used for agriculture to meet growing needs of the world’s population
→ It is estimated that 18% more land must be converted for agriculture by 2050
→Up to 75% of the world's farmland is used to feed livestock (e.g., hay production)
Intensification of Agriculture: An increase in the output for existing agricultural areas.
→ Farmers adjust the farming system to be more productive in terms of labour, application of chemicals, plant/seed type, technology & water use.
→ Occurs as land available for the expansion of agriculture is declining, due to land clearing policy changes or the loss of farmland due to the expansion of urban areas.
→ Over the last 30 years the world has managed to produce more food on less land & are currently keeping ahead of population growth.
E.g., cereal crop production doubled over the last 60 years, despite minimal change to the land used for cultivation.
Describe the Processes of Land Cover Change, including Growth of Urban Settlement:
Growth of Urban Settlement: Urban land cover ranges from 1-3% of the world’s land & contains 56% of world’s population, growth of urban population due to urbanisation results in the growth of urban settlements such as towns & cities across the world & significant land cover change.
→ There is a positive correlation between the level of urbanisation & the number & size of cities across the world.
→ Complete land cover transformation occurs as native vegetation is replaced with urban structures & infrastructure (i.e., paved surfaces, buildings & roads).
→ Rapid growth is commonly seen on the fringes of large urban areas (result of urban sprawl).
E.g., 900+ hectares of native vegetation (including farmland) is converted into urban areas in Perth per year.
→ Since 1992 urban areas have more than doubled in size.
→ It is projected that urban land cover could triple by 2030, with most of the expansion occurring in China & India.
Describe the Processes of Land Cover Change, including Mining
Mining: The deforestation & extraction &/or processing of raw materials/ore. Involving the construction of infrastructure (transport, power & water systems links) & the development of mining settlements.
→ Covers approximately 1% of the world’s terrestrial land & has significantly impacted upon the natural & cultural environment.
→ Australia’s economy relies heavily on the exports of minerals & energy (over $250b in export revenue per year), there are 350+ mines, extracting 19 different types of minerals, such as gold, uranium & coal.
→ Although mine sites are localised & small in scale, land cover change is still very significant to the functionality of the natural environment.
E.g., land can be permanently altered in terms of morphology as the soil profile is reduced by the large pits that are dug.
What do you Discuss when asked to: Outline the Impacts of World Population Growth & Growing Affluence on the Type, Rate & Extent of Land Cover Change:
Impacts of World Population Growth on the Type, Rate & Extent of Land Cover Change:
Growth of Urban Settlement:
Impacts of Growing Affluence on the Type, Rate & Extent of Land Cover Change:
Expansion & Intensification of Agriculture:
Advances in Technology Impacts on the Type, Rate & Extent of Land Cover Change:
Intensification of Agriculture:
Outline the Impacts of World Population Growth on the Type, Rate & Extent of Land Cover Change:
Growth of Urban Settlement:
→ World Population growth increases the rate & extent of land cover change on a global scale through the growth of urban settlements.
→The world population is 8billopn with a growth rate of 1%.
→ Urbanisation levels are also increasing resulting in the increase of urban populations.
→ Growth of urban settlements results in the loss of native vegetation through deforestation causing significant land cover change.
→ The extent of Urban settlements has doubled over the last 30 years.
→ On a coastal level 70% of native vegetation on the Swan Coastal Plain has been cleared since British settlement to accommodate a rapidly growing population which continues to rise rapidly.
→ Deforestation continues resulting in further land cover change.
Outline the Impacts of Growing Affluence on the Type, Rate & Extent of Land Cover Change:
Expansion & Intensification of Agriculture:
→ Growing affluence relates to the increase of wealth of a country, often measured by GDP per capita.
→ Growing Affluence contributes to the rate & extent of land cover change increasing.
→ There is a positive correlation between GDP per capita & the consumption & production of food.
e.g., Since 1960 world cereal production & GDP per capita have both increased by 3 times.
→ The correlation between affluence & expansion & intensification of agriculture leads to deforestation & the conversion of natural land cover into farmland.
→ Diets in more affluent countries have higher dairy & meat consumption consequently the demand for the expansion of land for pasture is occurring worldwide.
e.g., In China meat consumption has grown 7 times since 1990 & they consume 28% of the world’s meat.
→ To boost domestic supply of meat for some countries developing countries such as Brazil are meeting demand by converting large tracts of their forests into pasture.
→ In Brazil around 15% of the Amazon Rainforest has been replaced by cattle ranches since 1960.
Outline the Impacts of Advances in Technology on the Type, Rate & Extent of Land Cover Change:
Intensification of Agriculture:
→ Advances in technology over time has led to an increase in the rate & extent of Land Cover Change on a global scale.
→ The industrial revolution in the mid-18th century saw the introduction of technology allowing for large scale production & conversion of natural land cover into anthropogenic biomes, such as agriculture.
→ Sophisticated technology, such as combine harvesters & air seeders are readily used in farming today especially throughout the developed world.
→ Although large tracts of land are used for farming a noticeable trend in affluent MEDCs is the investment in sustainable technologies.
e.g., Farmers in Amsterdam have been able to increase crop yields by 10X over the last 20 years with the integration of technologies that cut water usage as well as reducing chemical & carbon emissions. Meaning no further land cover change i.e., land clearing, occurred minimising environmental degradation.
What do you Discuss when asked:
How two of the following Factors Account for difference in Land Cover Change between two Countries: Government Policy; Ideology; Land Ownership; Type of Economy; & Culture.
Compare Australia & Brazil’s Government Policy:
Compare Australia & Brazil’s Land Ownership:
How two of the following Factors Account for difference in Land Cover Change between two Countries: Government Policy & Land Ownership
Government Policy:
Due to differences in government policy, Australia has a slower rate & extent of deforestation compared to Brazil.
Australia:
→ In Australia land cover change is heavily governed by all levels of government across all states & territories.
→ Historical policies focused on large scale clearing of habitable land for the expansion of agriculture.
e.g., The Land Settlement Scheme for returned veterans opened the Wheatbelt Region of WA converting large tracts of native woodland into farmland
Over the last 100 years up to 90% of native woodland has been cleared.
However, overtime government policies on land cover change became increasingly strict, shifting focus to including more stringent policies on rehabilitation & preservation.
→ In Australia the primary cause of deforestation is grazing land for cattle for which 0.4 million hectares of native forest was lost between 2015-2020.
Brazil:
→ Historically the Brazilian government has viewed the environment as an obstacle for economic development rejecting policy around sustainable land cover change.
This has resulted in large scale clearing of tropical forests.
→ The Brazilian government encourages deforestation for mining, logging & farming as they believe the protection of the environment is incompatible with their economy.
i.e., Since 1970 approximately 20% of Brazil’s Amazon Rainforest has been cleared.
i.e., Brazil also clears native forests for grazing between 2015-2020 1.7 million hectares of native forest was cleared.
Land Ownership:
Due to land ownership differences, Australia has more land under native title and less land cover change than Brazil.
Australia:
→ Native Title Act passed in 1993 with 50% of Australia under Native Title today.
→ Land is classified as either exclusive or non-exclusive varying from full control & ownership to shared rights & interests respectively.
→ Consequently, land cover change is heavily regulated therefore any change for economic benefit such as granting mining or pastoral leases is only given with permission of its traditional owners.
Brazil:
→ Brazil has a smaller proportion of its land (13%) under traditional ownership.
→ Although this land is legally owned by indigenous people, the government can easily permit land cover change for mining as laws don’t protect with is under the ground.
i.e., the Area mined in Indigenous Lands in Brazil in 2021 was 625% greater than recorded in 2010.
What to Discuss when asked to:
Explain the Impact of Aboriginal & Torres Strait Islander Peoples’ Land Management Practices on Land Cover Over Time:
Fire Stick Farming (Cultural Burning):
Seasonal Calendars:
Explain the Impact of Aboriginal & Torres Strait Islander Peoples’ Land Management Practices on Land Cover Over Time: Fire Stick Farming (Cultural Burning):
→ For thousands of years especially prior to European settlement, First Nations people practiced firestick farming.
This involved cool (low intensity), slow moving, mosaic burning of native land cover.
→ This practice was used to clear undergrowth allowing people to move through the bush.
→ It was also a form of hazard reduction reducing wildfire risks by decreasing fuel loads.
→ These fires also encouraged seed germination (e.g., acacia & banksia) increasing grazing pastures for animals such as kangaroos.
e.g., Noongar people in Southwest WA burnt the forest in mosaic patterns during the season of Birak (December to January).
→ Overtime the impact of this practice lead to widespread changes to land cover, particularly in the conversion of dense forest areas into medium scrub & grasslands.
→ It also controlled weeds, decreased the amount of bare land & increased the diversity of the understorey.
→ Today it is referred to as cultural burning & is practices in a small number of forested areas across the country (Kimberly Region of WA).
Explain the Impact of Aboriginal & Torres Strait Islander Peoples’ Land Management Practices on Land Cover Over Time: Seasonal Calendars:
Seasonal Calendars:
→ First Nation people are strongly connected to country developing a complex system of land management including the use of seasonal calendars.
→ The use of a seasonal calendar is extremely important as it is a guide to what nature is doing at every stage of the year as opposed to a date.
→ Noongar people in Southwest WA use a seasonal calendar consisting of six seasons.
Enables a complex ecological understanding of the interaction of plants, animals, water, weather, fire & the stars.
Indicating which seasonal foods are ready for harvesting, when different animals are breeding & what land & sea management actions should take place.
Overtime this practice ensured the sustainable & respectful use of the land reducing long term imparts of land cover.
What do you Discuss when asked to: Explain Two Impacts of Land Cover Change;
Soil Erosion:
Urban Heat Islands:
Explain the Following Impacts of Land Cover Change; Soil Erosion:
Soil Erosion:
A type of soil degradation referring to the loss of fertile topsoil to agents such as wind & water. This reduces quality & quantity of soil changing the morphology of the land’s surface.
→ Soil erosion occurs on land cleared of native vegetation resulting in soil having little to no vegetation cover exposing it to the elements of wind & water.
→ The root systems & canopy cover of native vegetation binds the soil together (or shelters it) & reduces the impact of runoff when it rains or is windy.
→ Overtime gullies or rill can be created on sloped stripping the upper soil layer & carrying large amounts of topsoil downslope.
Sediment often ends up in streams or rivers increasing the turbidity of the water.
→ 2/3 of all farmlands shows evidence of soil erosion
→ The farming practice of tillage also increases the rate & extent of soil erosion as it breaks up the soil making it vulnerable to the action of wind & water.
→ Soil erosion results in the loss of soil quality/fertility, silting of rivers & reduces agricultural productivity (crop yields).
Consequently, farmers apply fertilisers to replace essential elements in an attempt to protect crop yields.
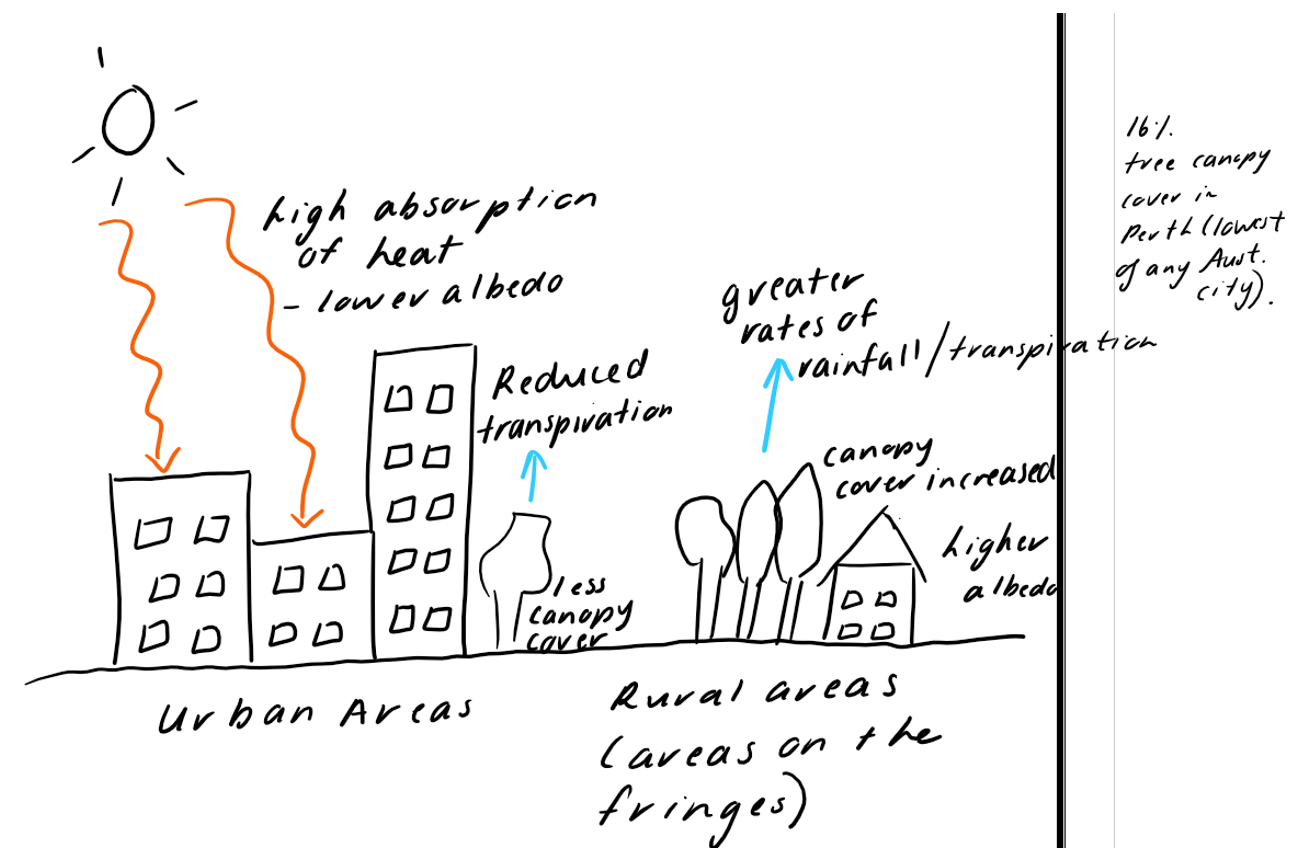
Explain the Following Impacts of Land Cover Change; Urban Heat Islands:
Urban Heat Islands:
Urban area such as a city significantly warmer than its surrounding rural areas due to human activity.
→ Created when natural land cover (vegetation) is replaced with urban structures such as paved surfaces, buildings with dark rooftops & roads.
→ These artificial surfaces are darker, non-reflective & water resistant.
→ Harder & darker surfaces have lower albedo & absorb more heat, in turn creating a positive feedback loop & raises surface temperature.
→ The removal of large trees contributes to rising temperatures as less canopy cover results in less shade and a reduction in transpiration (cooling effect created by trees).
→ The annual mean temperature of a city with 1 million people or more can be as high as 3°C warmer than its outer edges.
Dalkeith has high amounts of canopy cover at 30% suggesting it can be 5°C cooler than newer outer suburbs such as Baldivis (0-5% canopy over).
What do you Discuss when asked to:
Describe the Spatial Distribution of the World’s Rainfall & Temperature Patterns:
Rainfall:
Areas of Higher Rainfall:
→ Low Latitudes:
→ Mid Latitudes:
→ Coastal:
Areas of Lower Rainfall:
→ Areas of High Pressure:
→ Polar Regions:
→ Inland:
Temperature:
Areas of Higher Temperature:
→ Lower Latitudes:
→ Sub-Tropical:
→ Low Albedo:
Areas of Lower Temperature:
→ Higher Latitudes (Heat Deficit Zone):
→ High Albedo:
→ High Altitude (Alpine):
Describe the Spatial Distribution of the World’s Rainfall:
Rainfall:
→ spatial distribution of the world’s rainfall patterns in uneven
→ Earth’s average rainfall is approximately 1000mm/year.
Areas of Higher Rainfall:
Low Pressure Systems are associated with areas of High Rainfall (equatorial lows)
→ Low Latitudes:
Highest concentration of rainfall occurs at low latitudes near the equator as heat creates a large uplift of moist air forming equatorial lows.
Annual rainfall totals in the tropics can exceed 2,500millimetres
E.g., Singapore's annual rainfall in 2024 was 2,739.8 millimetres, 8.1% higher than the long-term average
→ Mid-Latitudes:
Temperature regions found between 23.5 to 55 degrees North & South of the equator.
Exhibiting moderate to high levels of rainfall created from the development of cold fronts within subpolar low-pressure systems.
E.g., Peth’s average annual rainfall is approximately 740 millimetres per year the majority of which falls in winter.
→ Coastal:
Coastal areas experience higher rainfall than inland areas, ocean water is evaporated & held as water vapour forming rainfall carried by trade winds across the land.
E.g., Perth is a coastal city that receives 740 millimetres per year.
Areas of Lower Rainfall:
→ Areas of High Pressure:
In regions of high pressure, cool air descends & eventually warms reducing condensation resulting in clear skies.
This is evident in deserts in subtropical regions around 23.5 to 45 degrees North & South of the equator.
E.g., the Sahara Desert in the Southern Hemisphere receives less than 250 millimetres of rainfall per year
→ Polar Regions:
Polar regions at high latitudes (beyond 60 degrees North & South of the equator) have low levels of rainfall due to a lack of evaporation & subsequent moisture in the air as the sun’s energy is dispersed over a large area
Air at the poles is therefore too cold to allow great amounts of moisture to form.
E.g., Antarctica is the driest continent with an average rainfall of 166millimetres annually.
→ Inland:
Inland areas receive low levels of rainfall as the air dries & moves further away from its oceanic moisture source.
E.g., Kalgoorlie is situated at a similar latitude to Perth but 600kilometres inland, receiving only 260millimetres of rainfall per year.
Describe the Spatial Distribution of the World’s Temperature Patterns:
Temperature:
→ The Spatial Distribution of the Worlds Temperature Patterns is uneven – varying due to the latitude on the Earth & the time of year.
→ The Average global surface temperature Is approximately 15°C.
Areas of Higher Temperature:
→ Lower Latitudes:
Areas that are closer to the equator are warmer than regions nearer the poles dur to receiving more direct insolation.
These areas have an average surface temperature of 25°C or higher
The hottest places on Earth are located in the subtropical climate zone of high pressure between latitudes of 25° to 40°, where there is virtually no cloud cover & insolation is high throughout the year.
E.g., Parts of the Great Sandy & Deserts in Australia can experience daytime temperatures of over 50°C
→ Sub-Tropical:
Most comfortable climates occur in the temperate mid-latitude zones found between latitudes 23.5° to 55° North & South of the equator.
In these regions maximum Summer temperatures rarely go above 40°C & Winters are usually Mild
E.g., Perth & Adelaide
→ Low Albedo:
Albedo is the reflectivity of a surface
Areas of Low Albedo absorb more insolation & therefore tend to have higher temperatures.
If albedo is low, more radiation is absorbed & a greater amount of surface heat is generated.
This explains why forests are hotter than Alpine regions
E.g., Forests have a low albedo of 15% such as the Amazon Rainforest which has a year-round average temperature of 25°C.
Areas of Lower Temperature:
→ Higher Latitudes (Heat Deficit Zone):
Areas of lower temperature include regions beyond so 37° North & South of the equator nearer the poles known as the heat deficit zone receiving less insolation.
The sun strikes at a lower angle of incidence whereby heat is more dispersed & concentrated over a larger area
E.g., Antarctica’s average annual temperature is -49°C
→ High Albedo:
Areas of high albedo reflect more insolation & therefore tends to have lower temperatures.
E.g., Snow/ice covered areas are light in colour & have a high albedo of 40-90% such as Antarctica,
→ High Altitude (Alpine):
Areas of higher altitude (Alpine Areas) also tend to have lower temperatures due to a process known as the environmental lapse rate, whereby the temperature decreases 6.5°C for every one kilometre increase in altitude
The atmosphere is densest & more able to retain energy at sea level, becoming thinner with increasing altitude.
The ability of the atmosphere to retain heat decreases with increasing altitude
Describe the Key Elements of the Hydrological Cycle:
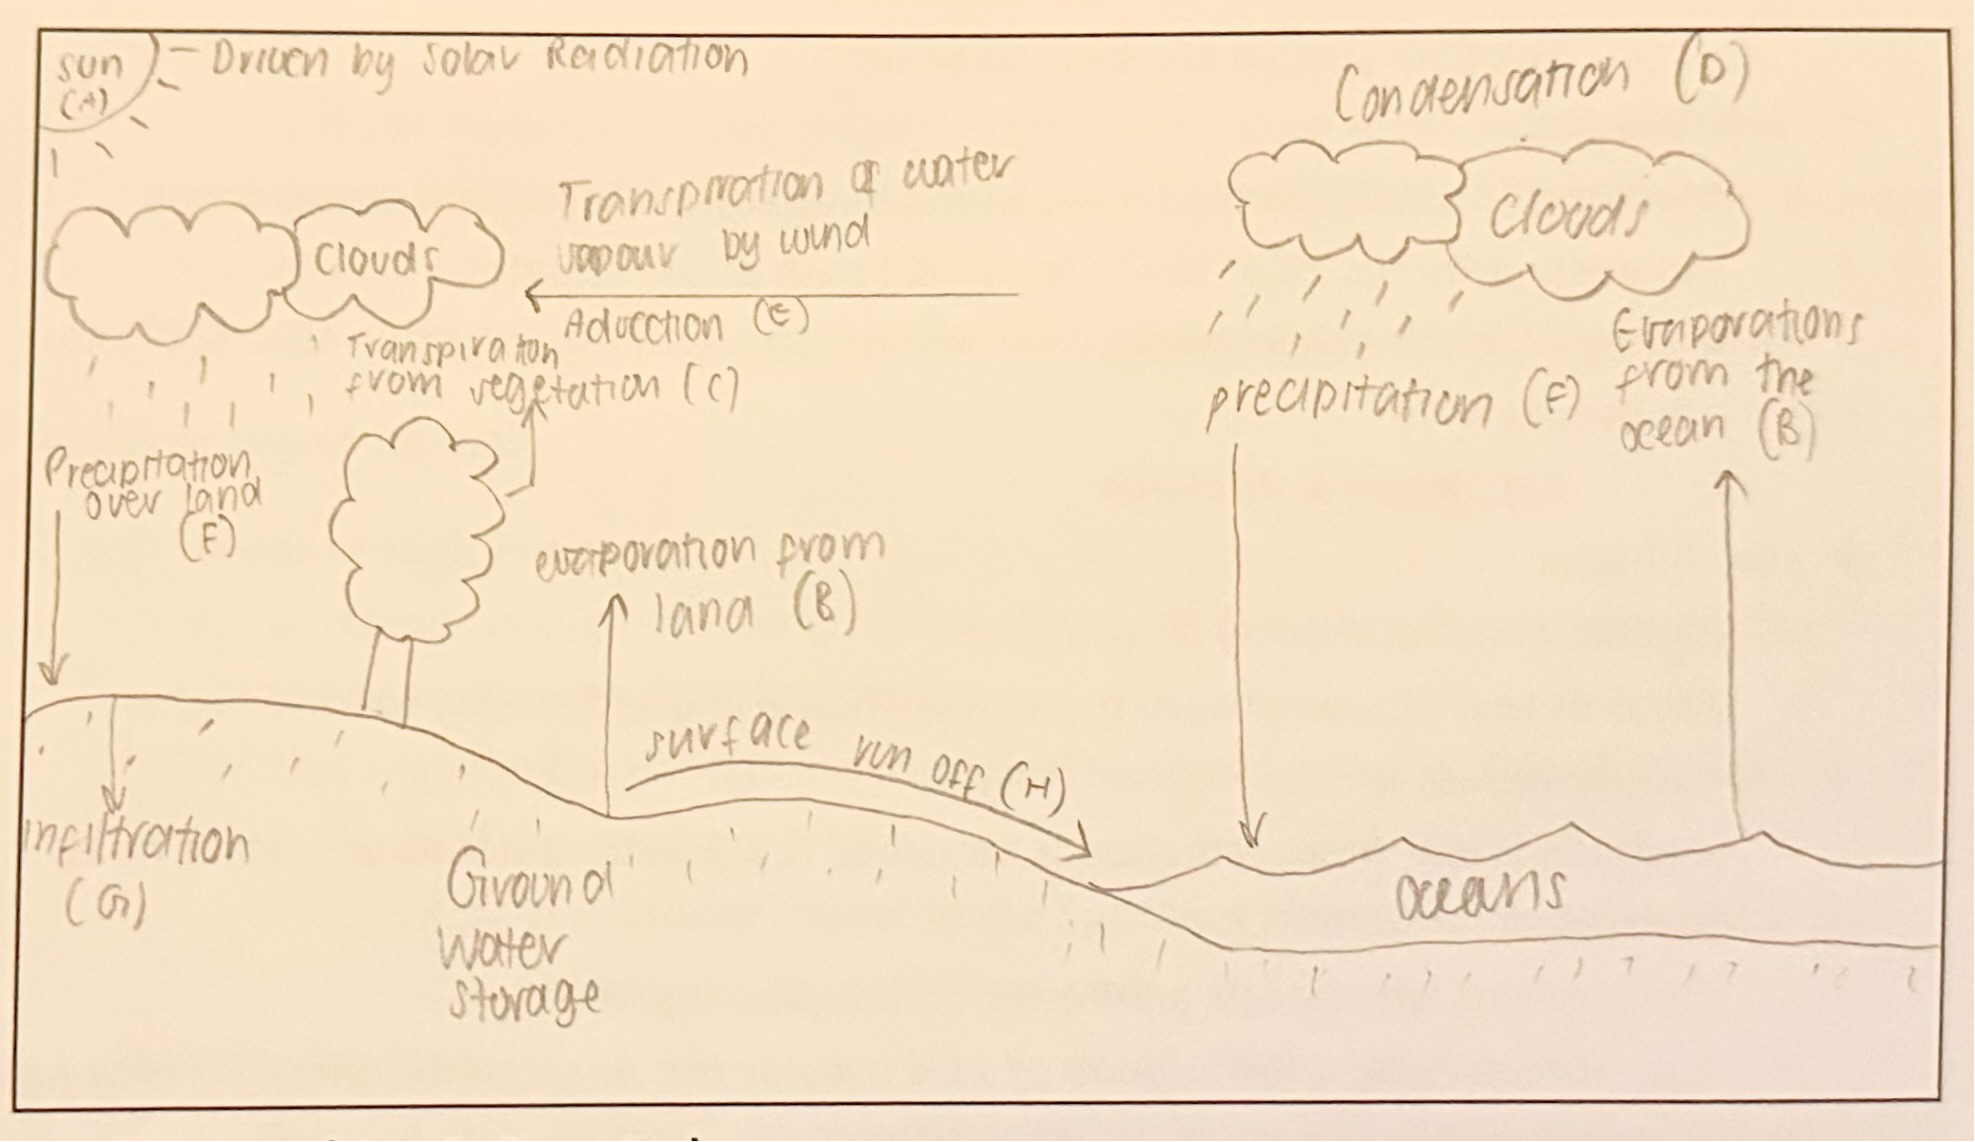
Hydrological Cycle: The continuous movement of water through Earth’s environment in the form of liquid water, water vapour, snow & ice.
Key Elements (How it Operates):
→ Closed system & a continuous cycle of water (liquid, gas & solid) throughout all of Earth’s spheres.
→ The driving force or energy input of the cycle is the sun.
è Globally approximately 97% of the Earth’s water is held in oceans, the remaining 3% is freshwater.
Of this freshwater, 2% is held in icecaps & glaciers & the remaining 1% is distributed in lakes, swamps, rivers & reservoirs.
Processes Involved in the Uptake of Water: P1 of Extended response
→ Solar energy powers the process of evaporation whereby water mainly in oceans, as well as rivers &lakes is converted from a liquid to a gas state (i.e., water vapour) & enters the → Plants also add to the uptake of water vapour into the atmosphere through the process of transpiration.
Solar input results in moisture loss from the stomata (pores) in the plant’s leaves.
→ E.g., Up to 50% of the rain that falls in a tropical rainforest is created by the combined processes of evaporation (evaporation of soil moisture & transpiration from plants).
Processes Involved in Water being held in the Atmosphere: P2 of Extended Response
→ As water vapour is taken into the atmosphere it cools & turns back into tiny droplets of liquid water through the process of condensation.
Where molecules can combine with particular matter such as in the atmosphere to form clouds.
→ Through the process of advection moisture can be transported through wind.
→ Eventually water droplets become too heavy & precipitation occurs in the form of rainfall, sleet, hail or snow.
→ After evaporating the resident time in the atmosphere for a water molecule is about 10 days before condensing & falling to the Earth as precipitation
→ In equatorial regions these processes can occur daily due to warm rising air, resulting gin cloud cover & thunderstorms
Processes Involved in Water on Land: P3 of Extended Response
→ When water falls back to Earth it can percolate through the soil profile through the process of infiltration.
→ It then collects in underground aquifers & works to recharge groundwater supplies.
→ If it doesn’t enter the soil, it can become surface runoff where the water flows across land to recharge rivers, streams, lakes & oceans.
Overtime surface & ground water will be evaporated to continue the cycle
Ways the Hydrological Cycle Influences Climate: Only Discuss when Explicitly asked
→ This cycle plays a very important role in influencing the Earth’s climate & its processes regulate key element of weather such as temperature & rainfall.
→ A balanced & undisturbed hydrological cycle creates long-term climatic patterns to which soils, vegetation & people have adapted.
→ Any disturbances such as those caused by anthropogenic activity can influence climate.
E.g., As forest cover is removed through deforestation there is a simultaneous decline in evaporation rates resulting in a decrease in rainfall & a dryer climate:
Since the 1970s the rainfall in the SW of WA has reduced by 20% - forest loss contributes to 50% of this decrease in this region.
→ As the planet warms & the sea temperatures increase it can cause warmer oceans to evaporate more water vapor increasing rainfall.
→ Places that lie along the equator such as Singapore can experience daily thunderstorms due to high rates of evaporation.
These daily storms can have a cooling effect & decrease temperature.
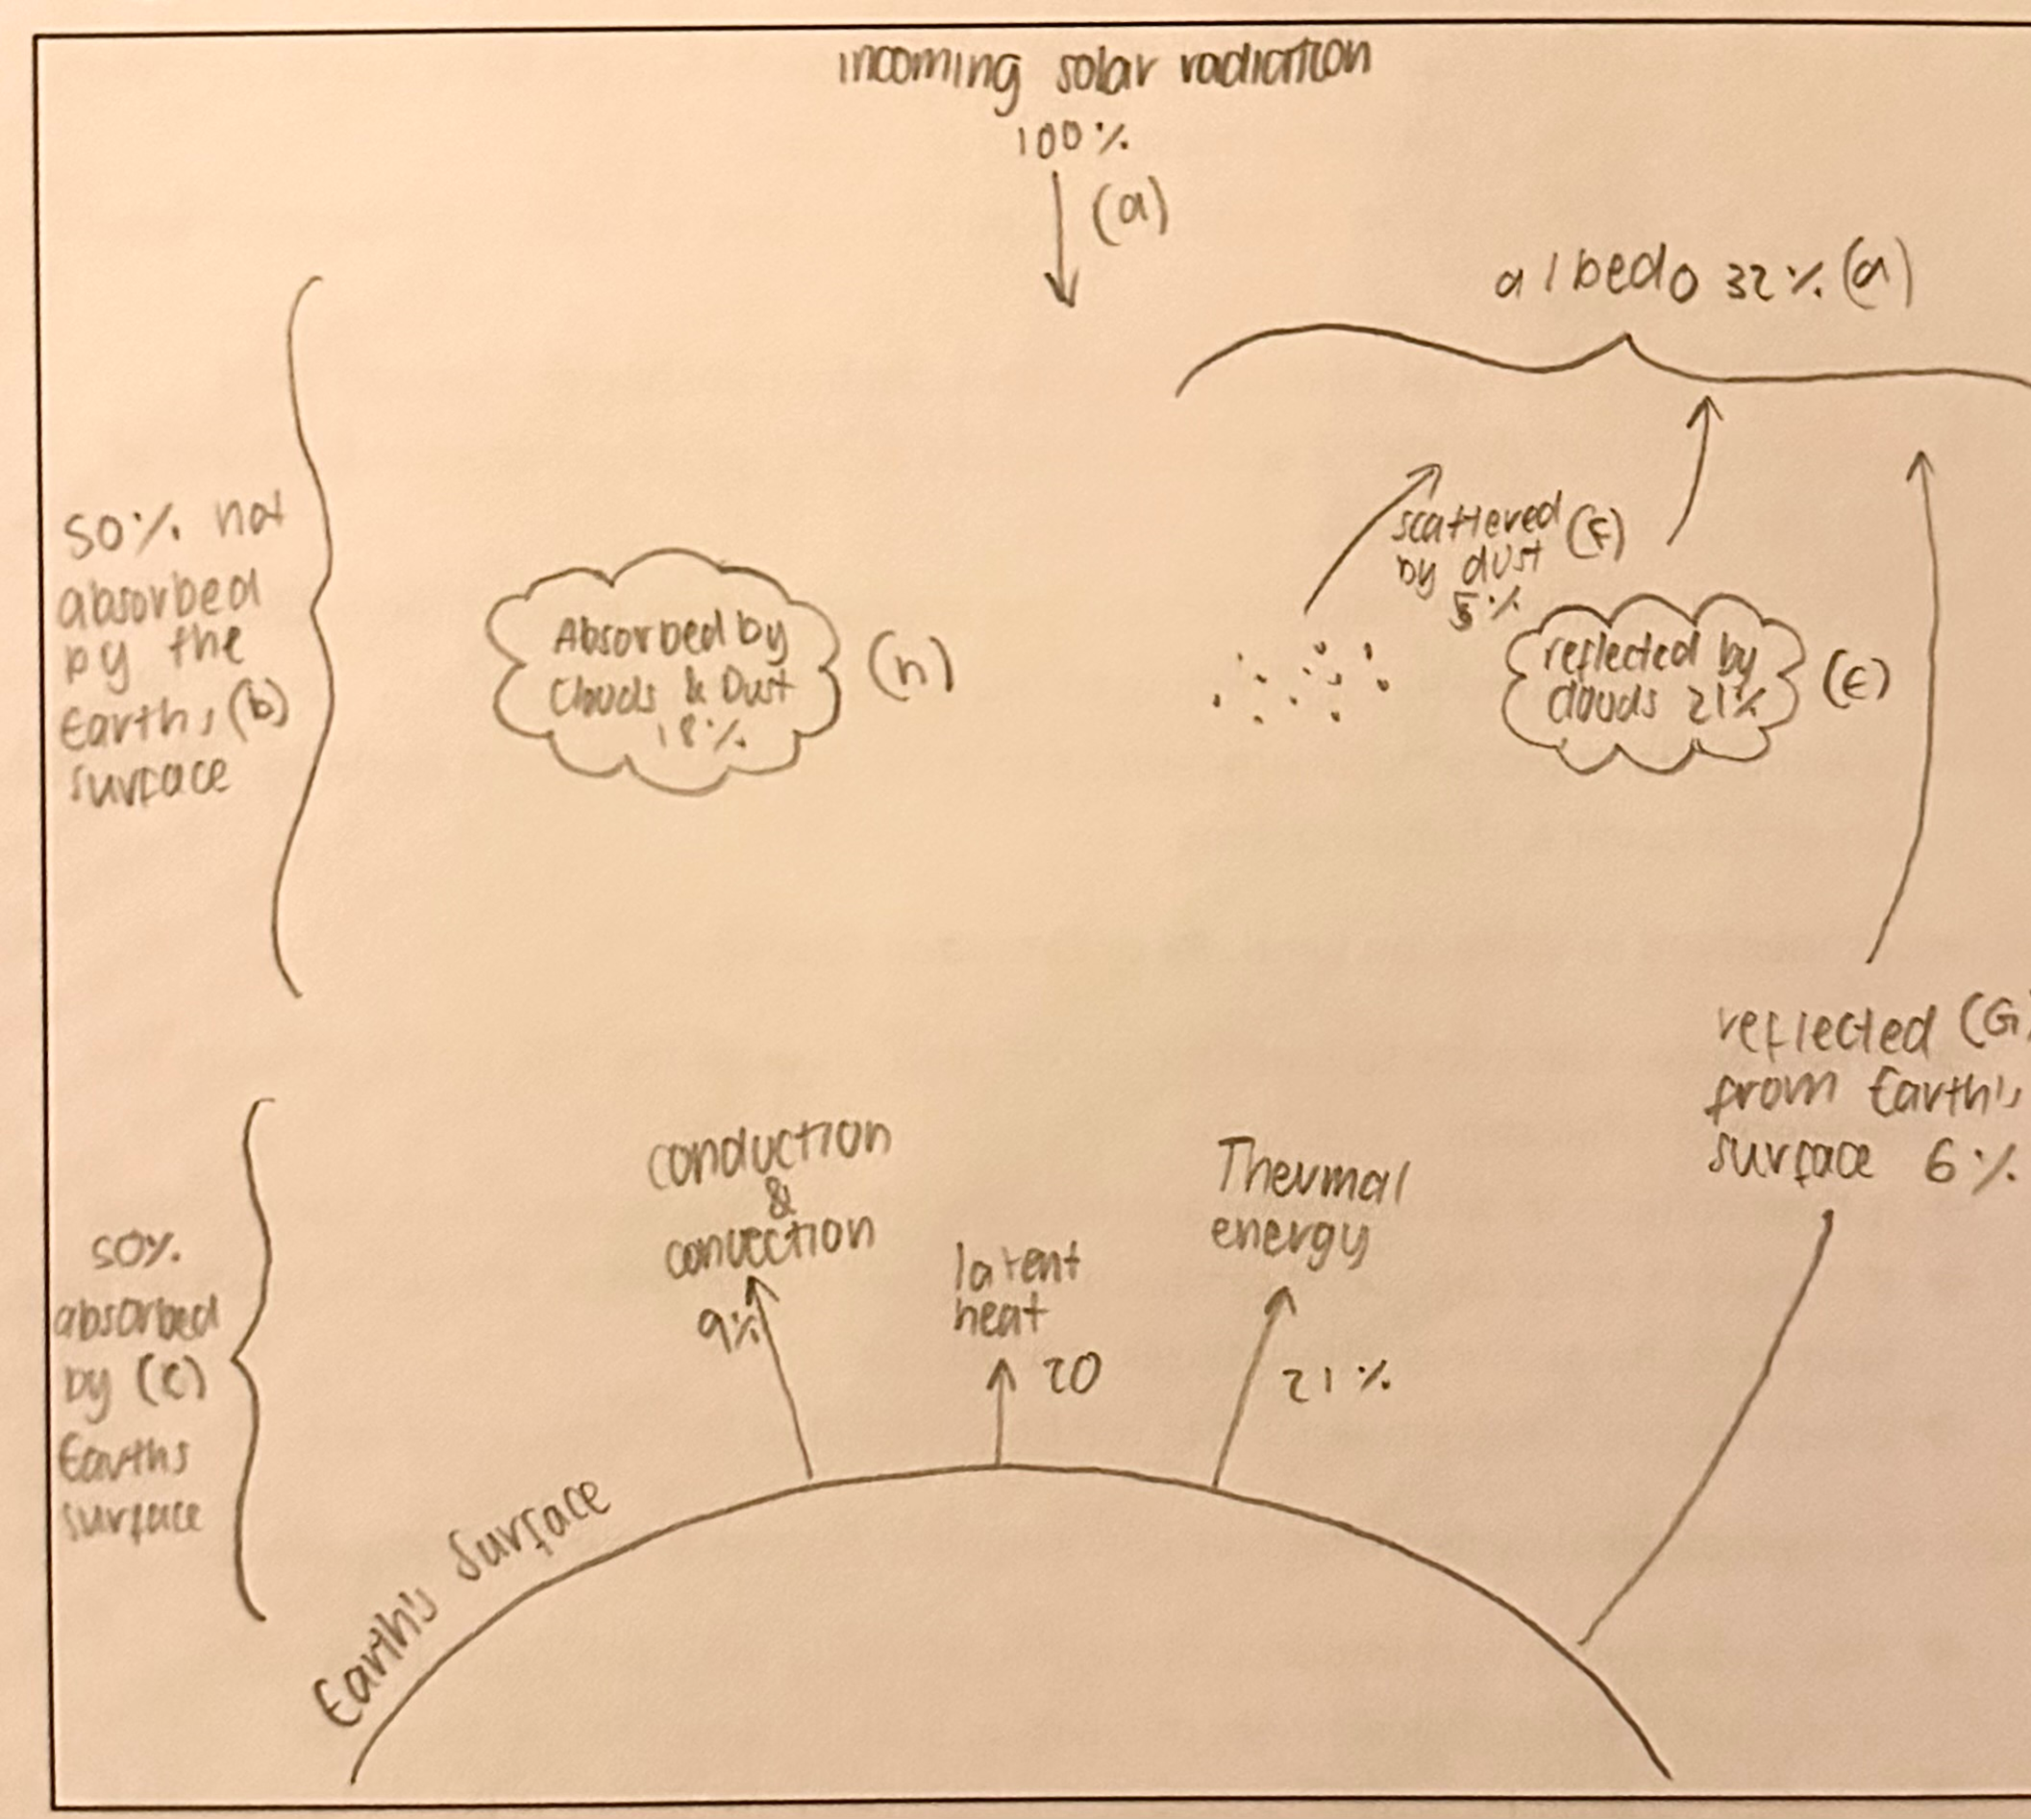
Describe the Key Elements of the Heat Budget (including Greenhouse Effect) as a Natural System:
Heat Budget: The balance between incoming solar radiation (insolation) & outgoing heat energy (radiation) on Earth
Description of Key Elements (how it operates): Extended Response Paragraph 1
→ Insolation imbalances exist between the equator & the poles due to the Earth’s tilt & curvature.
→ Short wave incoming solar radiation (insolation) immediately passes through the atmosphere to reach Earth
i.e., this passage from the sun takes approximately 8 minutes
→ Of the total 100% incoming solar radiation (a) 50% of that energy is not absorbed (b) by the Earth’s surface (filtered or reflected) & the remaining 50% (c) is absorbed & re-emitted by the Earth’s surface.
What Happens to the 50% of the incoming Solar Energy that is Not Absorbed: Extended Response Paragraph 2
→ As insolation enters the top of the atmosphere:
32% (D) is reflected back to space
21% (E) is reflected & scattered by clouds
5% (F) by dust & aerosols
6% (G) by the Earth’s surface that is lightly coloured (fresh snow & ice)
→ This reflection process is known as Albedo (the reflective ability of a surface).
→ This total amount of energy plays no role in the Earth’s climate.
→ The remaining 18% (H) of solar radiation/energy is absorbed by water vapour, dust & ozone.
What Happens to the 50% of the Incoming Solar Energy that is Absorbed: Extended Response Paragraph 3
→ The remaining 50% (C) passes through the atmosphere & is absorbed by the Earth’s surface, its then reradiated into the atmosphere as long wave radiation.
→ This long wave radiation returned to the atmosphere is slow moving & has less energy so cannot pass easily though the atmosphere.
→ As its slowly returned (it has less energy so cannot easily pass though the atmosphere) its responsible for heating the atmosphere.
9% of the heat energy is returned through conduction & convection currents
→ This heat energy is also called sensible heat (heat we can feel)
20% is carried upwards by water vapour through evaporation
→ The heat held & carried by the water molecules is called latent heat
The remaining 21% of heat energy is re-radiated as thermal infrared energy.
Incoming Solar Energy that is Absorbed – Natural Greenhouse Effect: Extended Response Paragraph 4:
→ Not all heat escapes the atmosphere.
→ The Troposphere contains greenhouse gases that act to restrict the loss of heat energy & absorb approximately 15% of the reradiated long wave radiation (heat).
→ GHGs include carbon dioxide (CO2), methane (CH4) & water vapour (H2O).
→ This is known as the natural greenhouse effect, where the absorbed energy warms the troposphere & the Earth’s surface.
→ This process keeps the planet warm enough to sustain life.
Without the greenhouse effect heat would not be retained/regulated & temperatures would be 30°C cooler & a grater diurnal range of temperature & freezing cold nights.
Ways the Heat Budget & Natural Greenhouse Influences Climate:
→ The climate on Earth is largely determined by the heat budget & greenhouse effect
→ The greenhouse effect is a major part of the heat budget & is a process where greenhouse gases trap long wave radiation in the lower atmosphere keeping the planet warm enough to sustain life
without it the planet would be 30degrees cooler.
→ Recently more outgoing long wave radiation is being absorbed by greenhouse gases, such as carbon dioxide enhancing the greenhouse effect.
This is causing temperatures to increase on a lobal scale, since 1880 surface temperatures have increased by 1.2%.
A warmer planet can lead to increased evaporation rates & more rainfall in some parts of the world, such as the equatorial/tropical locations.
→ Albedo: Reflective ability of a surface plays an important role in reflecting insolation.
→ Ice covered areas such as polar regions in the Arctic & Antarctica have high albedo levels contributing to lowering the temperatures as less heat is absorbed & re-radiated by the Earth’s surface.
→ Lower albedo areas (tropical rainforest regions) absorb more insolation & are warmer as a result.
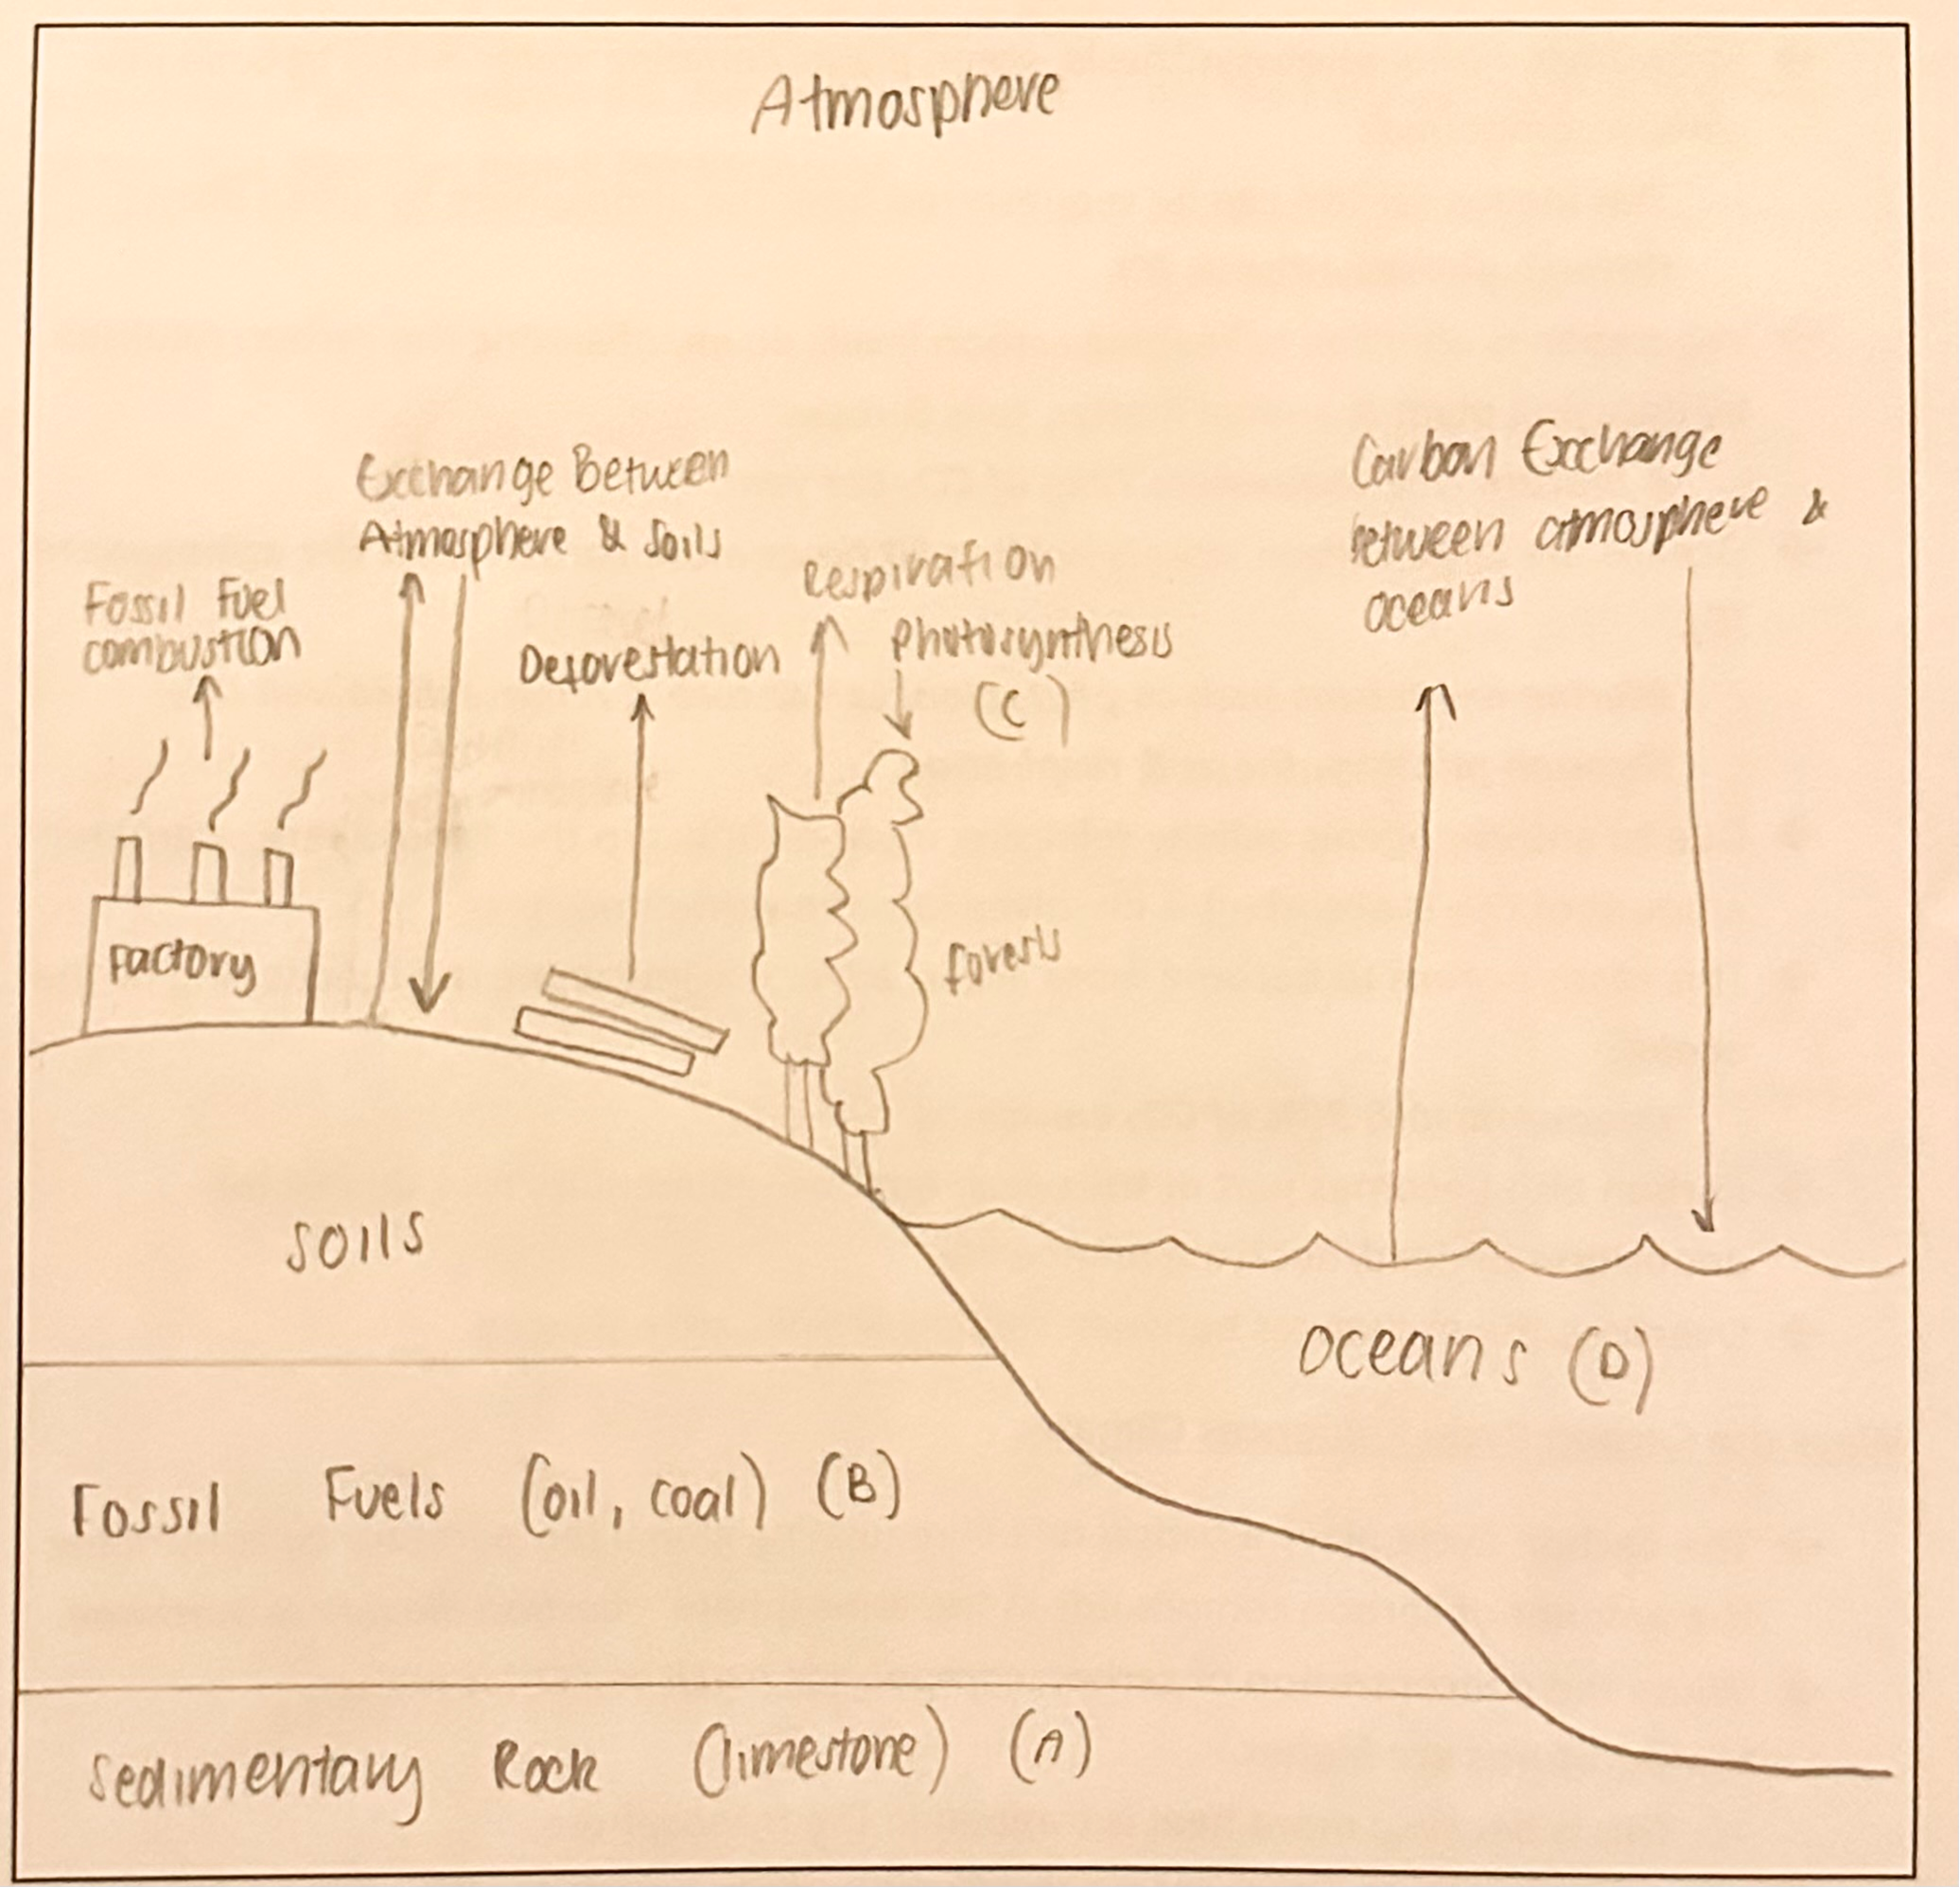
Describe the Key Elements of the Carbon Cycle:
The Carbon Cycle: A biochemical cycle whereby Carbon continues to be recycled by exchanges between sinks or reservoirs in the atmosphere, lithosphere, hydrosphere & biosphere, letters A-F on the following diagram denote key elements of the cycle.
Exchanges in the Lithosphere & Atmosphere: Extended Response Paragraph 1
→ The majority of carbon is stored in sedimentary rock such as limestone (A).
→ Fossil fuels such as coal & oil are also a significant source of carbon that may be released into the atmosphere through the process of mining (B).
→ Permafrost soils located in alpine or high latitude areas (E.g., 1/4 of the land in the Northern Hemisphere) can sequester carbon while its frozen, slowly releasing it in the form of gases such as methane, & carbon dioxide when thawed in warmer months.
→ Tectonic activity such as volcanic eruption scan also act to release carbon into the atmosphere, known as degassing, whereby dissolved carbon in magma is released.
Exchanges in the Biosphere, Hydrosphere & Atmosphere: Extended Response Paragraph 2
→ Animals in the biosphere take in oxygen from the atmosphere & produce/exhale CO2 as a waste product in the respiration process.
→ In contrast during photosynthesis, green plants combine water & CO2 to build new carbon compounds
This means carbon can be sequestered from the atmosphere by green plants through photosynthesis (C).
→ Vegetation is effective in keeping carbon levels down, offsetting the carbon released by decaying plant & animal matter, soils & rocks
A mature tree sequesters 22kg of CO2 per year.
→ Oceans are large carbon storers holding 50 times more carbon than the atmosphere (D).
Marine organisms such as phytoplankton absorb & release dissolved CO2 through photosynthesis & respiration.
→ Due to anthropogenic activity releasing more carbon into the atmosphere, a greater amount of CO2 is absorbed & dissolved into the world’s oceans.
This cases oceans to become more acidic, adversely impacting the functioning of the ocean.
Oceans absorb 30% of CO2 emissions
→ Carbon also becomes part of the ocean floor as sedimentary rock due to the deposition of dead/decaying marine life
→ Overtime the exchanges between sources & sinks are balanced
Ways the Carbon Cycle Influences Climate:
→ The Carbon Cycle plays a critical role in regulating global temperature by controlling the amount of carbon compounds in the atmosphere – carbon dioxide & methane.
→ When the concentration of carbon compounds (such as CO2) is higher, temperatures are higher.
This is because more heat is trapped in the troposphere.
→ In contrast when the concentration of carbon compounds (such as CO2) is lower, temperatures are lower.
This is because less heat is trapped in the troposphere.
→ Today, the world is experiencing a period of warming as carbon dioxide concentration is higher than its been in the last 3 million years,
There has been a 50% increase since the industrial revolution.
→ This can be attributed to various anthropogenic activities (deforestation, & the combustion of fossil fuels).
→ When carbon sinks are removed (such as vegetation), less carbon is sequestered in the biosphere.
→ As more carbon is emitted into the atmosphere the greenhouse effect is enhanced
Resulting in more heat retainment increasing global temperatures.
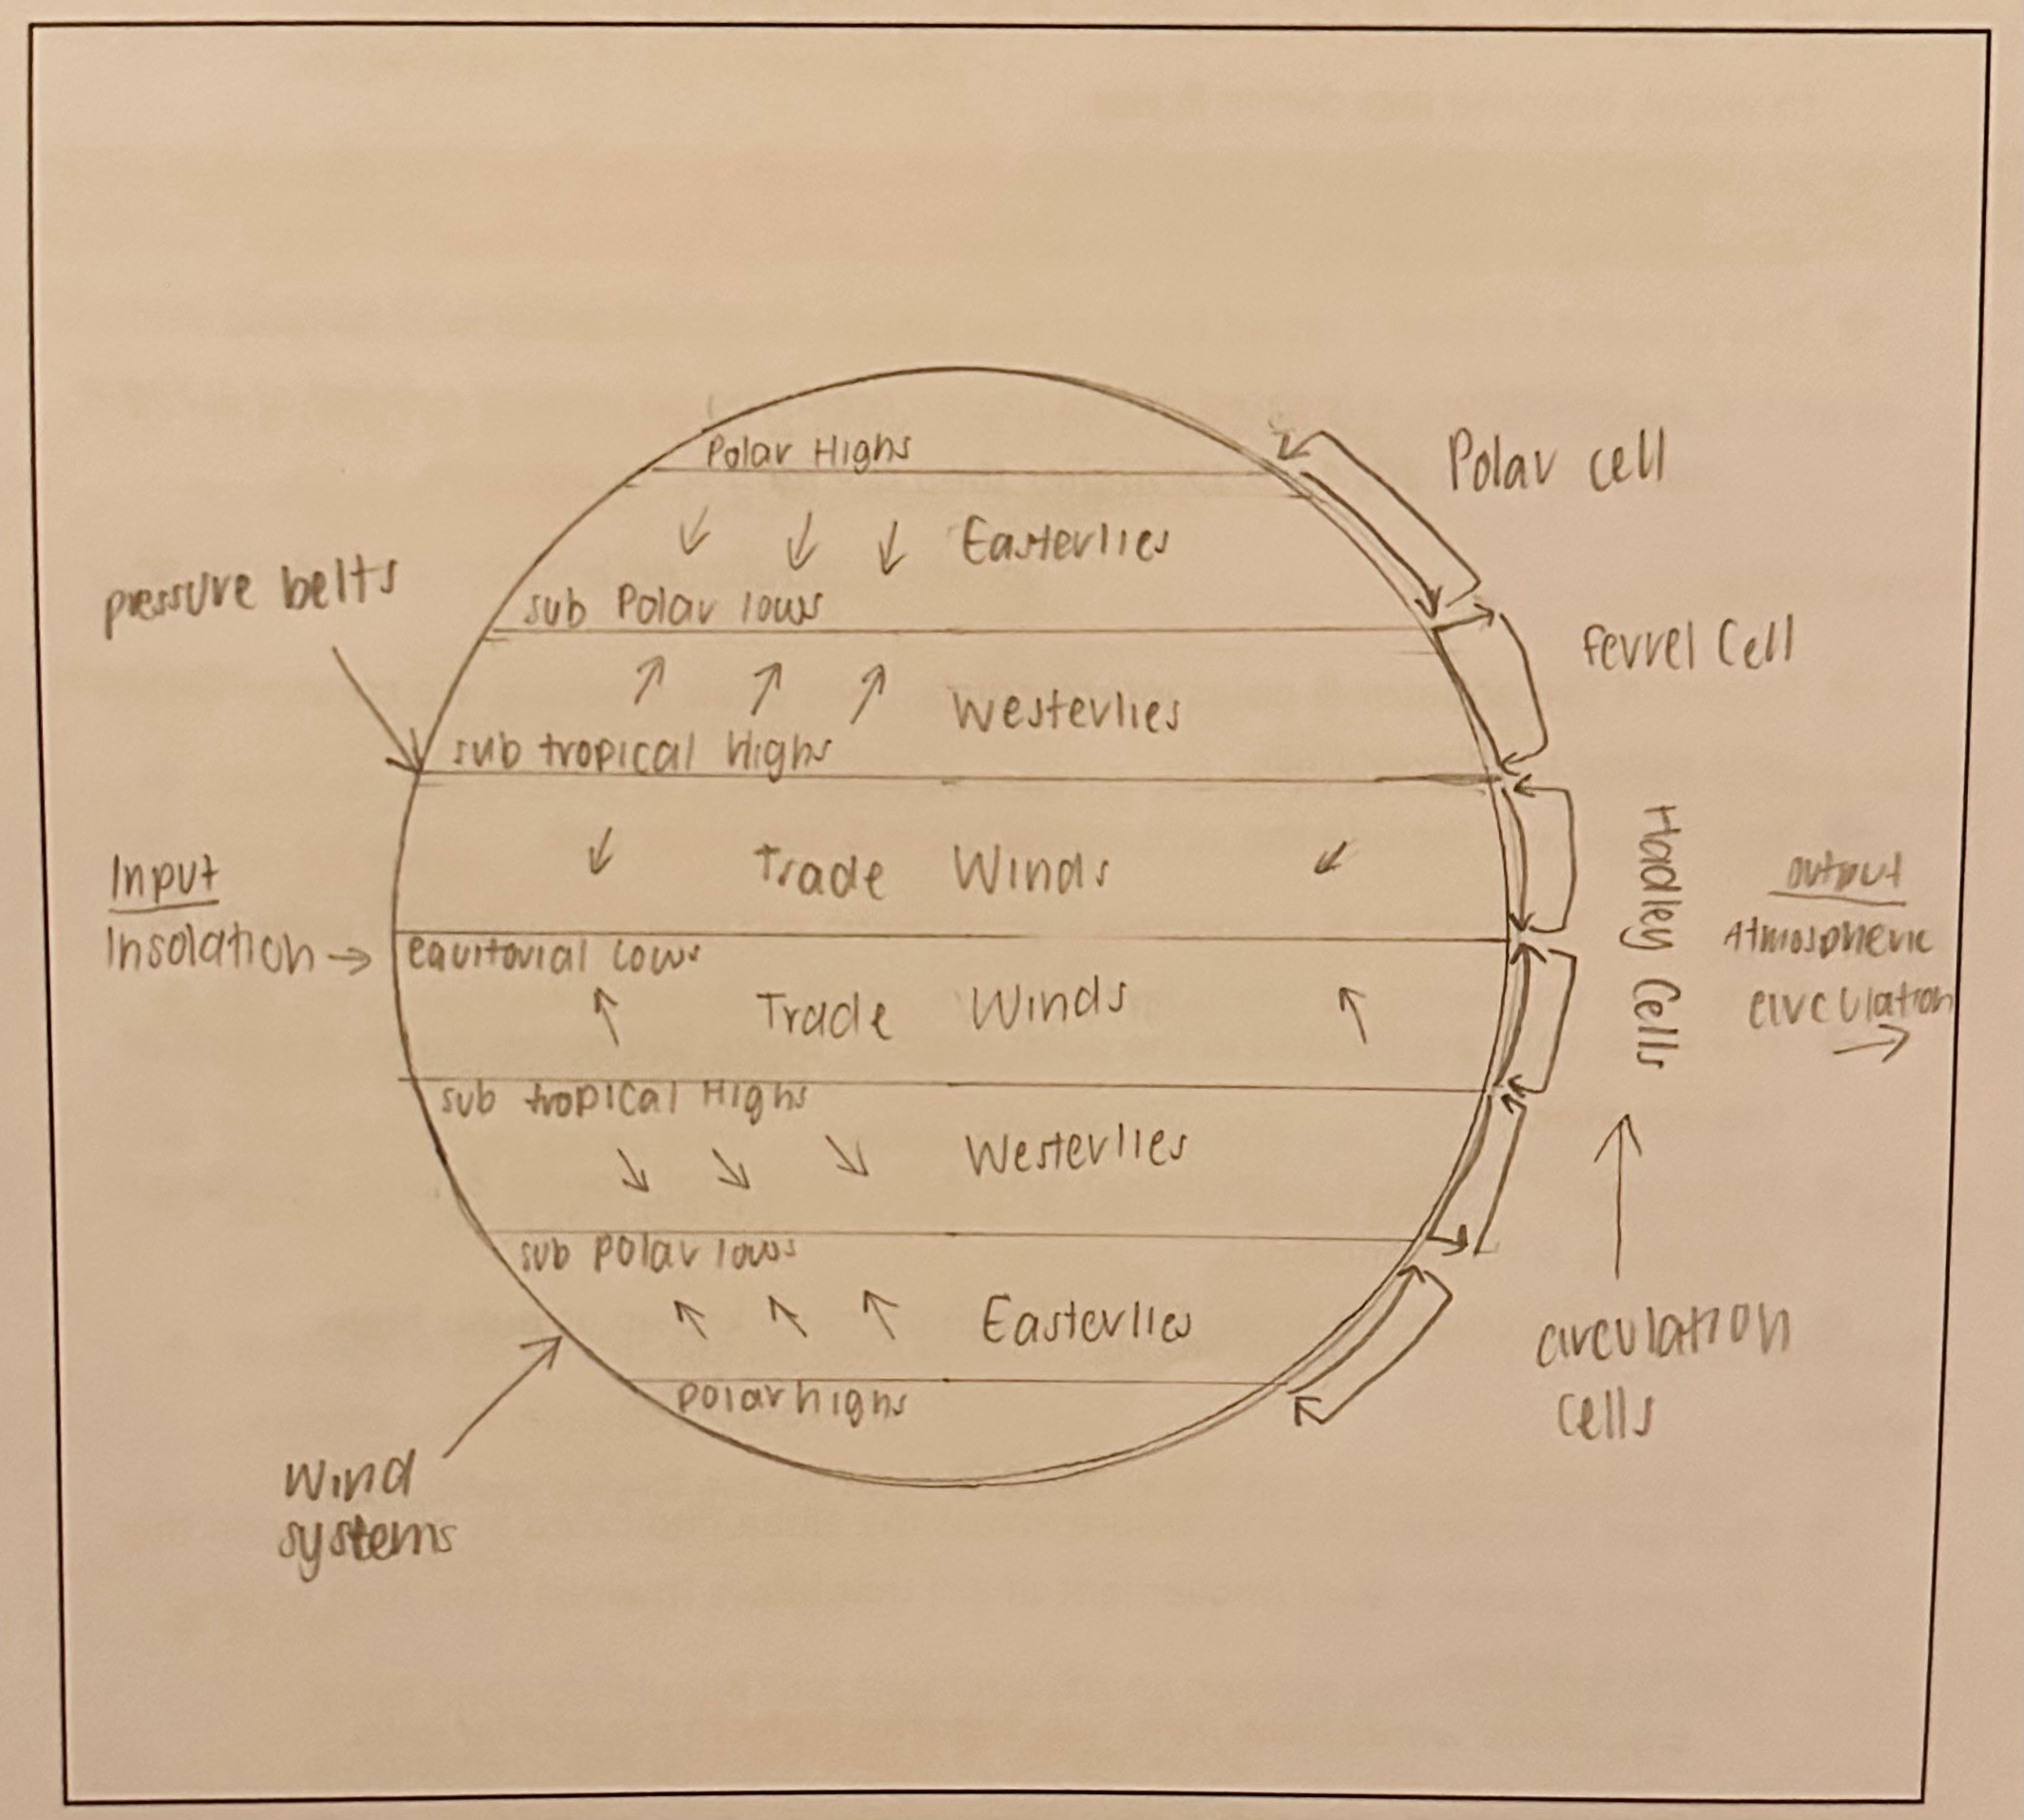
Describe the Key Elements of Atmospheric Circulation:
Definition of Atmospheric circulation: A system driven by insolation involving the large-scale movement of air & controls the distribution of heat across the Earths surface, it is a major system that regulates global temperatures.
Description of Key Elements (How it Operates): Extended Response Paragraph 1
→ Due to the tilt of the Earth’s axis & the curvature of the Earth, there is uneven heating over the Earth’s surface which is responsible for variations in air pressure & wind systems.
This is because more heat is generated at the equator than in the poles.
→ To redistribute & equalise this heat, three atmospheric circulation systems (cells) circling the Earth exist including:
Hadley cell
Ferrel cell
Polar cell
Hadley Cells:
→ The Hadley cells are the largest cells extending form the equator (indicated on the right of the diagram) to approximately 30degrees north & south of the equator.
→ It is referred to as the heat engine following the overhead sun (heat equator).
→ The region covered by the Hadley cell receives the most direct insolation causing air to warm, become less dense & rise.
→ As the air rises, it cools & condenses forming clouds resulting in cloudy, unstable & wet conditions (rainfall).
→ This process creates a broad band of low pressure known as equatorial lows.
E.g., Singapore is located in this region receiving an annual rainfall of 2,739.8 millimetres in 2024 – 8.1% higher than the long-term average.
Ferrel Cells:
→ Between the equator & poles intermediate belts of air pressure are created within cells called the Ferrel Cells.
→ The Ferrel cells include the subtropical highs & sub polar cells.
Polar Cells:
→ The Polar cells are located in the polar regions, being 60degrees north & south of the equator.
→ This region receives less insolation where the air is cool, denser & sinks resulting in dry stable & fine conditions.
→ This process creates a broad band of high pressure known as polar highs.
Wind:
→ Changes & variation in air pressure across the globe (indicated by an arrow on the diagram) produce wind (movement of air) that blows (travels) from high to low pressure systems.
- E.g., trade winds blow from Sub-Saharan highs to equatorial lows.
Ways Atmospheric Circulation Influences Climate:
→ Directly influences elements of weather such as rainfall & temperature due to the effects of air pressure.
→ Areas of the world under the influence of low-pressure cells (highlighted in blue on the diagram) receive the cooling effect of rainfall & experience unsettled conditions.
→ A low-pressure cell is caused by the uplift of warm air that is less dense & rises.
→ As it rises it condenses, forms clouds & once saturated, results in rainfall.
E.g., these cells form a large band across the equator, called the equatorial lows bringing thunderstorms & rain to these parts which have a cooling effect on temperature.
→ Areas of the world receiving high pressure cells experience sunny & drier conditions.
→ A high-pressure cell is caused by cool, more dense sinking air.
Resulting in fine & dray conditions.
→ These cells form two large bands across the globe in both hemispheres called the sub-tropical highs
E.g., Southern Australia receives these cells in Summer bringing higher temperatures & dry conditions.
Describe One Major Type of Evidence for Climate Change through Geological Time:
Climate Change through Geological Time:
→ The study of past climates is known as paleoclimatology, scientists gather data to establish & reconstruct past climatic conditions.
→ Proxy data is based on indirect evidence
Ice Cores:
→ Involves the drilling of a vertical hole into ice sheets to extract a cylindrical tube of ice (an ice core).
→ Coring typically occurs in the cryosphere – Antarctica & Greenland.
→ Ice cores contain distinctive layers in them containing accumulated dust, particulate matter & bubbles of trapped gas.
→ Snow fall traps gases such as carbon dioxide into the ice.
→ Ice cores can reveal the concentrations & types of gases present at the time the snow fell.
→ Through analysis this can be used to ascertain the composition of the atmosphere & recreate past climatic records.
A confident record dating back 800,000 years has been established for Antarctica.
→ Proof:
It has been concluded that there is a strong positive correlation between atmospheric gas concentrations & temperature.
This means during interglacial periods (warmer temperatures) greenhouse gas concentrations, such as carbon dioxide are higher in glacial periods (cooler temperatures), greenhouse gas concentration is lower.
More accurate data is gathered from shallower ice cores as annual layers of snow become harder to see deeper in the ice core.
In 2022 an ice sheet in Antarctica began drilling to collect the oldest ice core obtained at a depth of 2.8km dating back 1 million years.
Describe One Major Type of Evidence for Climate Change in Recent Human History:
Climate Change in Recent Human History:
Atmospheric Temperature Records:
→ Records & trends provide evidence for climate change in recent human history.
→ Since modern record keeping began in 1880, various instruments (fixed thermometers, satellites & radiosondes) have been used to gather direct data to measure & analyse the temperature patterns throughout the world.
→ The gathering of this data indicates a global warming trend
→ The global mean surface temperature has risen by approximately 1.2 degrees since 1880
→ 2024 was the hottest year to date.
→ It has also been observed that polar regions are warming approximately 4 times the global average.
What do you Discuss when asked to:
Explain Two Natural & Two Anthropogenic Causes & the Rate of Global Climate Change:
Natural Causes:
Volcanoes:
Variations in Solar Output:
Anthropogenic Causes:
Deforestation:
Raising of Ruminant Livestock:
Explain Two Natural Causes & the Rate of Global Climate Change:
Natural Causes:
Volcanoes:
→ Volcanic eruptions are a climatic forcing factor that can account for short term climate change.
→ They have an impact on climatic conditions dur to the amount of gases (e.g., sulphur dioxide, water vapour & carbon dioxide), ash & dust that are ejected upward into the atmosphere.
→ The cooling is mainly due to large quantities of dust, particles & gases that are ejected as high as 50km above the Earth’s surface into the upper atmosphere (stratosphere) by large scale eruptions.
→ In terms of dust & ash the lightest particles get into the stratosphere & can travel great distances.
This blocks insolation creating a cooling effect.
→ Erupting volcanoes emit sulphur dioxide which is more effective at cooling the climate.
→ Gases move into the atmosphere & combines with water forming sulphuric acid aerosols.
→ Aerosols make p a haze of tiny droplets & reflect insolation which stay in the atmosphere for up to three years & are moved around by global winds.
→ As less heat is absorbed it can result in the decrease in temperature.
→ If volcanic eruption is large enough the cooling influence of the eruption produces negative radiative forcing referred to as a volcanic winter.
E.g., the Mt Pinatubo (Philippines) eruption in 19991 caused a reduction in insolation by 10% & cooled the Earth by 0.5°C over one year.
Variations in Solar Output:
→ The Sun is the driving force of all life on Earth driving natural systems such as the hydrological cycle & atmospheric circulation.
→ The sun is approximately 4.6billion years old, as it ages solar output increases.
→ For every 1billion years its brightness increases by about 10%.
→ The sun plays a large role in determining the climate on Earth, consequently any changes to the amount of radiant energy emitted by the sun can influence climate.
→ One solar variation is the 11-year sunspot cycle.
→ Sunspots are magnetic storms occurring on the Sun’s surface producing solar flares & emitting radiation.
→ If strong enough, it can cause the magnetic field to break allowing cosmic rays (high energy radiation) to be ejected into the universe.
→ This extra radiation can be directed towards Earth & can coincide with periods of warming.
→ Consequently, there is a positive correlation between sunspots & warming.
→ A period of fewer sunspots is referred to as a minimum & can coincide with periods of cooling.
→ This is the trigger for the ‘Little Ice Age’ of 1650-1715 in which Europe, North America experience bitterly cold winters & very cool to mild summers.
E.g., Europe’s winter temperatures were approximately 1° C lower than that of greenhouse gas emissions. It is though to increase or decrease Earth’s global temperature by 0.1°C – 0.3°C.
Explain Two Anthropogenic Causes & the Rate of Global Climate Change:
Anthropogenic Causes:
What is meant by the enhanced greenhouse effect:
→ Occurs when the natural process of warming in the troposphere is heightened due to the increase in the concentration of GHGs.
→ Anthropogenic activities such as deforestation & the combustion of fossil fuels release these additional GHGs.
→ They trap & delay heat energy from escaping & causes temperatures to increase (global warming).
Deforestation:
→ The Removal & conversion of forest to other land uses, such as agriculture, urban development & mining.
→ It is prevalent in tropical forests.
E.g., since 1970 20% of Brazil’s Amazon rainforest has been cleared.
→ Forests are large carbon reservoirs & sequester carbon from the atmosphere, drawing it into the biosphere through the process of photosynthesis.
→ As they sequester/absorb carbon dioxide it is converted into carbon & stored in the fibres of the plant.
→ A mature tree can sequester 22kg of carbon per year, when trees are removed they are replaced by monocrops which are smaller, temporary carbon stores like palm oil plantations or pasture.
→ This process influences the process of carbon sequestration as their removal reduces the ability to store carbon.
→ In forested areas vegetation absorbs more heat than bare soil as the forested surface has a lower albedo (higher absorption of heat) resulting in higher levels of evaporation of soil moisture & plant transpiration.
E.g., approximately 50% of the rainfall in a tropical rainforest is attributed to evapotranspiration.
→ If forests are removed then the reflectivity or albedo of the surface increases by up to 14%.
→ This means less heat is absorbed & less moisture is being taken up in the atmosphere contribution to decreased rainfall on a local & regional level.
E.g., Rainfall across the Amazon Basin could be reduced by more than 20% by the year 2050 if current rates of deforestation continue.
→ Additionally, forests can also be cleared through burning (biomass burning) releasing carbon dioxide into the atmosphere further contributing to the increase in carbon dioxide emissions.
→ Consequently, enhancing the greenhouse effect leading to an increase in temperatures creating a positive feedback loop.
E.g., sine 1880, the surface temperatures of the world have risen by an average of 1.2°C.
→ Deforestation causes approximately 10% of worldwide greenhouse gas emissions.
Raising of Ruminant Livestock:
→ Ruminant livestock is a type of domesticated animal that has four stomachs that continually chews & regulates their food.
→ Methanogens (bacteria) in the stomach of these animals help digestion & produce methane as a by-product known as enteric fermentation.
→ This is the largest contributor to agricultural greenhouse gases. Creating:
30% of global methane emissions
10% carbon dioxide emissions (e.g., transportation & land clearing)
65% nitrous oxide (e.g., manure & the application of nitrogen fertilisers)
→ Countries with high populations such as Australia, New Zealand & India have high methane emissions.
Livestock causes 2/3 of national methane emissions
→ One cow can produce between 60-120kg of methane per year.
→ One sheep can produce 8kg of methane per year.
→ Methane is a concerning GHG as it has the capacity to absorb 30-80 times more heat energy than carbon dioxide.
→ It lasts for 19years in the atmosphere before being broken down & converted back to carbon dioxide by oxidation.
→ As more heat is retained it enhances the greenhouse effect creating a positive feedback loop leading to an increase in temperature.
Since 1910 Australia’s average temperature has increased by 1.5°C
→ The associated land clearing for farming & use of machines adds to carbon emissions reducing the ability to sequester carbon.
Rate of Global Climate Change:
Post industrial revolution the rate of climate change impacts is occurring faster than in the past, these changes are attributed to anthropogenic processes.
Increase in Global Temperature:
→ Earth’s temperature is maintained at an average of 15°C by the global heat budget which balances incoming solar radiation with outgoing infrared radiation & the natural greenhouse effect.
→ Any disruption to these natural systems results in corresponding change in average global temperature.
→ In increase in atmospheric concentrations of CO2 leads to a subsequent increase in Earth’s average global temperatures by 1.2°C since 1880.
Loss of Ice & Glaciers:
→ Glaciers are fallen snow that compress over hundreds of years to form large, thickened ice masses moving slowly under the weight of their own mass.
→ They are formed on land & most were formed during the last ice age.
→ The Thwaites Glacier in Antarctica was predicted in 2014 to undergo an irreversible collapse within 200 – 1,000 years until 2021 where it was predicted to detach as soon as 2026 & may cause up to 65cm sea level rise if it collapses.
→ The Greenland Ice Sheet has been melting 5 x faster than ever, since 2002 & could raise sea level up to 7.2metres if fully melted.
→ Antarctica & Greenland:
Both Antarctica & Greenland have been losing ice mass rapidly in the last two decades.
Combined, they are key contributors to sea level rise under climate change.
Sea levels rise:
→ Sea level refers to an increase in the level of the worlds oceans considered to be a result of anthropogenic activity.
→ Sea level rise is a result of two factors related to climate change, the expansion of sea water as temperature increases & the increased amount of water in oceans as artic sea ice declines & ice sheets & glaciers melt.
→ Seal level has risen 10.33 millimetres since 1993 & the current rate of sea level rise is 3.6millimetres per year
What do you Discuss when asked to describe the:
Explain the Interrelationship between Land Cover Change & Climate:
Changes in Surface Reflectivity:
Deforestation:
Urban Development:
The Cryosphere:
*Urban Heat Island Effect Diagram:*
Changes in Process of Carbon Sequestration:
Deforestation:
Soils:
Explain the Interrelationship between Land Cover Change & Climate: Surface Reflectivity
→ There is a strong correlation or interrelationship between land cover change & climate.
→ Over time process of land cover change (deforestation & urban development) lead to changes in surface reflectivity (albedo) & carbon sequestration (carbon storage).
→ Changes in climatic conditions also affect land cover, creating feedback loops influencing future climate changes.
Feedback looks can be created by processes such as changes in albedo that can either increase or decrease the effects of climate change (such as temperature increase.
Changes in Surface Reflectivity:
Deforestation: is one example of land cover change involving the removal & conversion of forests to other land uses, such as agriculture, urban development & mining, this can lead to changes in albedo (reflectivity of a surface)
→ Vegetation cover absorbs more heat than bare soil as forested surfaces have lower albedo (higher absorption).
This results in higher levels of evaporation of soil moisture & plant transpiration
E.g., approximately 50% of the rainfall in a tropical rainforest is attributed to evaporation
→ If forests are removed the reflectivity or albedo of the surface increases (i.e., higher albedo) by up to 14%.
This means less heat is absorbed & less moisture is taken up into the atmosphere contributing to climate change & a decrease in rainfall on a local & regional level.
→ E.g., rainfall across the Amazon Basin could be reduced by more than 20% by the year 2050 if current rates of deforestation continue.
Deforestation has caused 50% of the reduction in rainfall observed in SW WA.
Urban Development: Is another process of land cover change that interact with climate due to rapid population growth & direct human influence on terrestrial ecosystems, urban settlements have been established & expanded across the world.
→ Urban development causes changes in surface reflectivity (albedo)
E.g., the urban heat island effect is created when vegetation is replaced with urban structures with darker surfaces (i.e., paved surfaces, buildings & roads). These darker surfaces have a lower albedo absorbing more heat, in turn a positive feedback loop is created raising surface temperatures.
→ Removal of large trees also contribute to rising temperatures as less canopy cover results in less shade & a decline in rainfall as plant transpiration is reduced.
E.g., the annual mean temperature of a city with 1million people or more can be as high as 3°C warmer than its outer edges.
DIAGRAM: URBAN HEAT ISLAND EFFECT
The Cryosphere: Refers to regions of the world where water is frozen such as sea ice, glaciers & ice shelves in the Artic & Antarctica.
→ These Polar Regions have high albedo on account of their extremely reflective (insolation) white surfaces.
E.g., snow & ice have an albedo of up to 90%.
→ Due to rising global temperatures over the last century (since 1880 the global temperature has increased by 1.2°C), the extent of snow & ice land cover has decreased.
The average temperature in the Arctic has increased by 3.33°C in the past 40 years
→ Over the last 20 years, ice sheets in Greenland have melted at a rate 5 times higher than pre-mid-19th century.
→ As the albedo of the surface decreases, less of the sun’s rays are reflected into space & more solar energy is absorbed by the land & ocean.
DIAGRAM: ICE-ALBEDO FEEDBACK LOOP - Optional (in booklet)
This causes surface & sea temperatures to increase resulting in the further reduction in snow & ice land cover continuing to decrease albedo (ice-albedo feedback loop).
Describe the Interrelationship between Land Cover Change & Climate: Changes in the Process of Carbon Sequestration:
Deforestation: Leads to changes in carbon sequestration (process of storing carbon).
→ When the forest is cleared the plant material is left to decompose or is burnt (biomass burning).
This is exemplified through the slash & burn technique & biomass burning used in locations such as Brazil & Indonesia disrupting the natural carbon cycle.
→ These processes result in carbon dioxide (a greenhouse gas absorbing & retaining 2terrestrial radiation) being released into the lower atmosphere.
Soils:
→ Soils are affected by deforestation & agriculture influencing carbon sequestration.
→ Globally, soils contain approximately 1500 gigatonnes of organic carbon.
This means that when its originally distributed due to the process of deforestation
What do you Discuss when asked to:
Discuss the present & projected impacts of climate change in one natural & one anthropogenic environment (e.g., changes to: vegetation; ice sheets & glaciers; oceans; agriculture; urban settlements)
OBSERVED CLIMATE CHANGE IMPACTS:
Increase in Temperatures: (Both Surface & Sea Level):
Present Impacts:
Projected Impacts:
Sea Levels Rise:
Present Impacts:
Projected Impacts:
Changes to Precipitation Patterns (such as Rainfall):
Present Impacts:
Projected Impacts:
Increased Intensity of Natural Hazards:
Present Impacts:
Projected Impacts:
PRESENT & PROJECTED IMPACTS OF CLIMATE CHANGE IN A NATURAL BIOME (OCEANS):
Coral Bleaching within Oceans:
Present Impacts
Projected Impacts
Ocean acidification:
Present Impacts
Projected Impacts
PRESENT & PROJECTED IMPACTS OF CLIMATE CHANGE IN AN ANTHROPOGENIC BIOME (SETTLEMENTS)
Urban Settlements:
Present Impacts
Projected Impacts
Low Lying Island Settlements:
Present Impacts
Projected Impacts
Present & Projected Impacts of Climate Change on Land Cover in one Natural Biome
One Natural Biome – Oceans: Climate change impacts on land cover within the world’s oceans, in terms of coral bleaching, ocean acidification & loss of marine habitats.
→ Coral Bleaching within Oceans: Present Impacts
Rising sea temperatures are stressing coral reef ecosystems and altering associated land cover.
A 1°C–2°C rise in sea temperature causes corals to expel zooxanthellae, resulting in coral bleaching.
Prolonged or concurrent bleaching events lead to coral death and the loss of reef structure.
Up to 50% of the world’s coral reefs have been lost or severely damaged by bleaching.
In the last 20 years, 98% of the Great Barrier Reef (GBR) has experienced bleaching.
Loss of coral reefs results in a reduction of breeding grounds for thousands of marine fish and mammals.
- Mass bleaching events occurred in 1998, 2002, 2016, 2017, 2020, 2022, and 2024.
→ Coral Bleaching within Oceans: Projected Impacts
Bleaching events are projected to continue with high confidence due to ongoing climate change.
Up to 90% of coral reefs are considered threatened by future bleaching.
Ongoing coral loss will continue to disrupt marine ecosystems, reducing biodiversity and further degrading land cover in reef regions.
→ Ocean Acidification: Present Impacts
Oceans have absorbed about 30% of anthropogenic CO₂ emissions since the Industrial Revolution.
This has caused a 0.1 decrease in ocean pH (from 8.2 to 8.1), a 26% increase in hydrogen ions.
The decrease in pH and carbonate concentration is known as ocean acidification.
Carbonate is essential for marine organisms (corals, oysters, clams, pteropods) to form shells and skeletons.
A reduction in some plankton populations has been observed in the - Acidification also lowers the temperature threshold for coral bleaching, making coral less resilient.
This leads to disruption of ecological balance, habitat degradation, and reduced biodiversity in marine environments.
→ Ocean Acidification: Projected Impacts:
High confidence that ocean acidification will intensify globally, especially in areas like Australian coastal waters.
The rate of acidification will be proportional to increasing CO₂ emissions.
Ongoing acidification will further weaken coral structures, reduce marine biodiversity, and continue to alter ocean-based land cover systems.
Present & Projected Impacts of Climate Change on Land Cover in One Anthropogenic Biome:
→ Urban Settlements: Present Impacts:
Urban areas along the coast, especially low-lying settlements, are already experiencing sea level rise (~5mm/year over the last 5 years).
Rising seas are causing coastline retreat, damaging homes, buildings, communication, and transport infrastructure.
Cities like Perth and southern Australian coastal areas are increasingly - Examples include damage to Exmouth, Broome, and Kalbarri, where buildings are being retrofitted to withstand strong winds and heavy rain.
Urban land cover is shifting, as coastal cities start adapting to sea level rise by moving infrastructure inland or to elevated areas.
Hard and soft engineering solutions like rock walls, gabion cages, and revetments are being used to protect urban coasts (e.g., in Perth).
A significant reduction in rainfall is affecting many urban settlements:
Perth's average stream flow into dams has declined from 338gL (1911–1974) to 75gL (2001–2010).
This climate change–induced water scarcity has led to investment in desalination plants, which now provide up to 50% of Perth's water, especially in summer month.
→ Urban Settlements: Projected Impacts:
By 2100, sea levels could rise by up to 1 metre (under a high GHG scenario), threatening urban land cover globally.
Coastal movement could reach over 100 metres inland, particularly in places like southern Australia.
Around 150 million people currently live on land less than 1 metre above sea level, with 40% of the global population living within 100 km of the coast.
Cities like Bangkok, Thailand (elevation ~1.5m) are highly vulnerable — 50% of Thailand's population could be at risk of flooding by 2070.
It’s projected that up to 12,000 km of sandy Australian beaches will be at risk by 2100.
Urban design will need to evolve to include more elevated structures and planned relocation to mitigate long-term risk.
Desalination infrastructure will need to expand globally as rainfall continues to decline due to climate change.
→ Low-Lying Island Settlements: Present Impacts
Nations like Kiribati, Tuvalu, and the Maldives are already suffering severe consequences from sea level rise.
In Kiribati, two islands have been inundated, and freshwater wells are being contaminated with saltwater.
The Solomon Islands have lost five islands due to rising seas.
These changes are displacing people and altering land cover dramatically, with the risk of creating climate refugees.
The Kiribati government has already purchased 2200 hectares of land in Fiji for potential relocation.
→ Low Lying Island Settlements: Projected Impacts:
Continued sea level rise will increase the displacement of populations from low-lying island nations.
Entire nations may become uninhabitable, forcing mass relocations and significant changes to regional land cover.
The cultural, environmental, and socio-political impacts of displacement are expected to escalate, as more islands are lost or rendered unliveable
What to Discuss when asked to Discuss:
Discuss how Two Strategies aim to Mitigate either Global Climate Change or Loss of Biodiversity:
Define Mitigation
Strategy one: Sustainable housing design:
Overview
White Gum Valley - Sustainable Village:
→ Ways it reduces GHGS & CO2 Emissions
→ Ways it increases Carbon Sequestration
→ Final comment
Strategy two: Renewable Energy:
→ Global Shift to Renewable Energy
→ Australia's Renewable Energy Progress & Innovation
→ Wind Energy in Western Australia
→ Final Comment
Discuss how Sustainable Housing Design aims to Mitigate Global Climate Chang or Loss of Biodiversity:
Definition of Mitigation: The implementation of strategies to eliminate or minimise the severity of an adverse occurrence such as climate change, aiming to reduce the causes & impacts of climate change to reduce greenhouse gas emissions increasing the amount that can be sequestered.
Paragraph One: Sustainable Housing Design:
→ A sustainable home refers to a dwelling that required low to zero energy to buil & low energy to heat & cool.
→ Currently, residential building are responsible for 24% of overall electricity use & 12% of total carbon emissions in Australia.
Paragraph Two: White Gum Valley – Sustainable Village:
→ Located on the site of a decommissioned school, 3kms from Fremantle in White Gum Valley a 2.2hectare^2 residential development in Perth exists consisting of approximately 85 homes, accommodating for 200 residents, that mitigates against climate change.
→ It is WA’s 1st residential development and the 11th in the world to achieve international endorsement as a One Planet Community through One Planet Living, joining a network of exemplary projects in locations across the world
Paragraph 3: Ways it reduces GHGS & CO2 Emissions:
→ North-facing Apartments with Dual Entry/Exit Points for Airflow
Designed to maximize natural ventilation, allowing breezes to flow directly through the unit.
Reduces reliance on artificial cooling systems i.e., air conditioning, which consumes high amounts of electricity generated from fossil fuels.
By decreasing electricity demand, fewer greenhouse gas emissions are released into the atmosphere, mitigating the enhanced greenhouse effect.
→ Building has a 40kw photo voltaic system (solar panels) with a battery system storing 20kw of energy
Captures renewable solar energy to power residential units, reducing dependence on fossil-fuel-based electricity from the grid.
The battery storage system allows energy to be used efficiently, even when sunlight is unavailable, further minimizing reliance on non-renewable sources.
Surplus energy can be shared among residents or fed back into the grid, reducing the overall carbon footprint of the complex.
→ Maximum 1 Car Bay per Unit, 2 Apartments don’t have Allocated Car space
This encourages residents to use public transport & reduce dependency on personal motor vehicles.
Reducing car emissions directly contributes to lowering greenhouse gases such as CO₂, which trap heat in the Earth's atmosphere and contribute to global warming.
→ Permeable Paving is used in the complex’s car park increasing rainfall infiltration & cools climate.
As water infiltrates the ground, it absorbs heat from the surrounding surfaces, cooling the air & reducing the intensity of the urban heat island effect.
Cooler ground surfaces in turn, makes the surrounding environment naturally cooler, reducing the need for the apartment complex.
By decreasing energy consumption from air conditioning, greenhouse gas emissions are further minimized, mitigating climate change impacts.
Ways it increases Carbon Sequestration:
→ 30% of their canopy cover has been retrained, these trees transpire and provide shade (cooling effect).
Trees absorb & store carbon dioxide (CO₂) from the atmosphere.
Transpiration of plants cools the surrounding air, reducing the reliance on artificial cooling systems, which lowers carbon emissions from electricity use.
Presence of trees prevents soil degradation & improves the long-term carbon sequestration capacity in the surrounding area.
→ Green verges
Green verges along pathways and roadsides provide additional vegetative cover that absorbs CO₂ & releases oxygen.
Maintaining this grassed area ensures storage of carbon for longer periods, reducing atmospheric CO₂ levels.
→ Being a high-density apartment block it is able to maximise living space in the limited area it takes up (2.2hectares^2), this allows for more of the surrounding area to be inhabited by plants and greenery.
By concentrating 85 homes within a 2.2-hectare area, the development preserves more land for trees, gardens, and natural ecosystems that act as carbon sinks.
More plant-covered land means increased carbon sequestration, resulting in greater CO₂ absorption & long-term carbon storage.
This planning approach reduces urban sprawl, which minimizes deforestation and land clearing, further aiding carbon sequestration efforts.
Final Comment:
Reducing GHG emissions works to mitigate the impacts of the enhanced greenhouse effect, with less heat being trapped in the lower atmosphere helping to reduce temperature.
Discuss how Renewable Energy aims to Mitigate Global Climate Chang or Loss of Biodiversity:
Strategy Two: Renewable Energy:
Paragraph 1: The Global Shift to Renewable Energy
→ Renewable energy is derived from natural sources that are replenished at a faster rate than they are consumed i.e., solar & wind. They are considered environmentally friendly because they produce little to no greenhouse gas emissions i.e., carbon dioxide compared to fossil fuels.
→ The energy sector contributes to 75% of all GGE’s, demonstrating how critical it is for countries to shift to cleaner energy sources to mitigate against climate change.
Currently renewable energy makes up 1/4 of electricity generation & its uptake is growing as we see a majority of countries committing to renewable energy targets.
Paragraph 2: Australia's Renewable Energy Progress & Innovation
→ In Australia as of 2025, 35% of its energy generation is renewable, & in 2022 it passed its first ever climate bill legislating carbon emission reduction targets committing to reducing greenhouse gas emissions & reach net zero by 2050.
→ As renewable energy grows, cost of production declines, in most markets, wind & solar is the cheapest source of new energy generation.
In Australia 3.5million Australian households use photovoltaic technology like solar panels which can be attributed to the 60% reduction in their cost since 2010.
→ Advancements in renewable energy storage is also occurring such as the use of lithium-ion batteries.
These advancements further propel the renewable sector forward, already seeing a 60% reduction in batteries since 2014.
Although, solar battery packs (power packs) are reducing in cost they are still very expensive for typical households to purchase ($8000-$12,000).
Paragraph 3: Wind Energy in Western Australia
→ The WA government plans to cut emissions by 80% below 2020 levels by 2039.
→ Wind power accounts for the majority of renewable energy sources in the state.
→ Wind Power involves generating electricity from the power of wind through the use of turbines.
→ It is cheapest source of large-scale renewable energy, uses little land and consumes no water (beneficial in a drying climate).
→ The Collgar wind farm near Merridin is the largest wind farm in the Southern Hemisphere and produces 222MW of electricity.
→ It powers 160,000 homes & displaces 577,000 tonnes of carbon dioxide per pear (equivalent of taking 210,000 cars of the road or planting 9 million trees).
Final Comment:
Reducing GHG emissions works to mitigate the impacts of the enhanced greenhouse effect, with less heat being trapped in the lower atmosphere helping to reduce temperature
What do you Discuss when asked to:
Discuss Three ways Human Activity has Adapted or may be required to Adapt, to either Global Climate Change or loss of Biodiversity:
Define Adaptation:
Strategy One: Desalination Plants in Urban Areas:
→ Paragraph 1: Overview
→ Paragraph 2: Strengths
→ Paragraph 3: Concluding Statement
Strategy Two: Drought Tolerant Plant Species in Agriculture:
→ Paragraph 1: Overview
→ Paragraph 2: Tedra
→ Paragraph 3: Adapting Agriculture to Climate Change in the Wheatbelt
Strategy Three: Hard & Soft Engineering Structures to Fortify Shorelines/Foreshore Areas:
→ Paragraph 1: Overview
→ Paragraph 2: Gabion Cage Installation at Point Walter Reserve to Combat Foreshore Erosion
→ Paragraph 3: Human-Modified Beaches as Coastal Defence and Visitor Management at Point Walter
→ Paragraph 4: Weakness:
Discuss how Human Activity (Strategy One: Desalination Plants in Urban Areas) has Adapted or may be required to Adapt to either Global Climate Change or Biodiversity Loss
Adaptation is when humans make alterations or adjustment in response to changed environmental conditions to build resilience & reduce the impacts of climate change.
Strategy One: Desalination Plants in Urban Areas:
Paragraph 1: Overview
→ Climate change threatens the sustainability of water supplies for many large urban areas around the world.
→ Consequently, many governments are funding construction of desalination plants to cope with changing rainfall patterns & a drying climate.
→ There are approximately 16,000 desalination plants across 177 countries, such as Australia, providing potable water for over 300million people.
→ Desalination involves a process called reverse osmosis which removes salt & impurities form the sea.
→ Once water is filtered & suitable for drinking, all sea water concentrate (i.e., brine) is returned to the sea.
→ Desalination is a very important water source for residents & businesses within the Perth Metropolitan Area.
→ Perth has two operating desalination plants supplying up to 50% of Perth’s water.
These plants include the Perth Seawater Desalination Plant in Kwinana supplying 20% & the Southern Seawater Desalination Plant in Binningup supplying 30% of Perth’s water needs.
A third desalination plant is under construction in the Northern Corridor in Alkimos to be opened in 2028, expected to produce 50billion litres of potable water per year
Paragraph 2: Strengths:
→ Desalination is a very important water source for Perth as they are not impacted by seasonal variations or natural hazards meaning they can supply a reliable & consistent amount of water for residents.
→ The South-West of WA (including Perth) continues to experience a drying climate.
E.g., Perth has experienced a 30% reduction in rainfall since the 1970s
→ Rising temperatures have also led to increased evaporation of surface water (i.e., dams).
→ Reduction in rainfall reduced water that flows into Perth’s above ground sources.
Consequently, streamflow into Perth’s dams has reduced significantly by 80% over the last 50 years.
→ Perth’s wet season is starting later & the area receives more sunny winter days.
→ The rainfall is becoming less reliable & catchment areas are not receiving consistent runoff.
→ Desalination plants don’t lead to any further draining of current dams/aquifers & they operate regardless of rainfall.
→ They also save the government from having to build additional infrastructure such as storage facilities & pipelines in an attempt to find alternative sources.
Paragraph 3: Concluding Statement:
→ Desalination plants are effective as they don’t rely on rainfall.
→ A responsible government must endeavour to implement sustainable water saving measures such as education & mandatory restrictions before becoming reliant on desalination plants
Discuss how Human Activity (Strategy Two: Drought Tolerant Plant Species in Agriculture) has Adapted or may be required to Adapt to either Global Climate Change or Biodiversity Loss
Adaptation is when humans make alterations or adjustment in response to changed environmental conditions to build resilience & reduce the impacts of climate change.
Genetic modification is when individual genes with specific desirable traits are transferred from one organism to another.
Paragraph 1:
→ Currently 12% of the world’s cropland is under GM crops.
→ Species such as wheat were genetically modified in 2018 to be more resilient to severe weather as well as disease.
→ In Australia, the Department of Agriculture & the CRIRO develop/introduce drought tolerant plant varieties & make farmers aware of how much water their crops use.
→ The CSIRO has developed a wheat variety called Drysdale producing yield 5% greater than other wheat varieties under dry conditions.
→ They have also discovered the biological mechanisms that plants use to conserve water.
Paragraph 2:
→ New perennial legumes called Tedra can withstand drought conditions making it suitable to the Wheatbelt of Western Australia (WA).
→ Results from various trials of the plant are demonstrating excellent signs in being able to reduce water loss by maximising water uptake through its root system & folding its leaf to reduce transpiration loss.
→ It is suitable for areas receiving at least 300mm of rainfall per year containing high levels of protein, providing nutritional value to sheep.
Paragraph 3:
→ Drought tolerant plant species are important adaptive measures that cope with changing climatic conditions such as increasing temperatures & decreasing rainfall.
→ The Wheatbelt Region in WA has experienced a reduction of in rainfall by 20% since the 1970s.
→ Winter & Autumn temperatures have gradually increased by approximately 1°C over the last 40 years.
→ Seasonal rainfall is becoming more variable exemplified by the reducing winter rainfall.
→ The stall in Australia’s wheat yields since the 1990’s can be attributed to an increase in temperature & reduced rainfall.
→ These species are necessary for the long-term sustainability of farmland, especially in marginal/vulnerable areas (e.g., eastern margin of the wheatbelt in WA).
Discuss how Human Activity (Strategy Three: Hard & Soft Engineering Structures to Fortify Shorelines/Foreshore Areas) has Adapted or may be required to Adapt to either Global Climate Change or Biodiversity Loss
Adaptation is when humans make alterations or adjustment in response to changed environmental conditions to build resilience & reduce the impacts of climate change.
Paragraph 1:
→ Coastal & Estuarine areas are at risk of inundation due to rising sea levels & the increased intensity & frequency of extreme weather hazards such ass cyclones & storm surges.
→ Constructing hard & soft engineering structures is one adaptation that can be used to fortify foreshore areas.
→ Currently the sea level is increasing by 3mm/year & it is projected to rise by 1 metre by 2100 in a high greenhouse gas scenario.
Paragraph 2:
→ One example of a location in Perth, Western Australia where new infrastructure is being constructed is Point Walter Reserve.
→ Over the last 10 years the city of Melville has been working closely with the Natural Area Management Services (NAMS0 to fortify the Swan River foreshore.
→ On the Western side of the reserve, two sections of gabion cages have been constructed.
→ Gabion cages are 1metre high wired cages filled with limestone rocks.
→ Two sections, 22 metres in length have been built approximately 10metres from the waters edge.
→ They are hard structures that work to prevent wave scouring in times of large storms & prevent dunes from being eroded by wind & wave.
Paragraph 3:
→ While on fieldwork it was observed that 5 human-modified beaches have been constructed East of the gabion cages.
→ These protect dunes from potential rising sea level & direct visitor traffic flow.
→ Each beach consists of a vertical limestone wall, geotextile revetments & limestone revetments.
Paragraph 4: Weakness:
→ Although these structures are effective solutions in adapting to rising sea levels & reducing the erosive forces of storm surges, they do come at a cost.
→ These structures are expensive to install & need regular maintenance & replacement.
E.g., gabion cages last 10-15 years
→ Additionally, these structures change the morphology or composition of the foreshore permanently.
This is because they influence & change the natural processes of transportation & deposition of sand along the shoreline.
What do you Discuss when asked:
Explain Two Strategies designed to Address the Impacts of Land Cover Change on Local &/or Regional Environments:
Strategy 1: Point Walter Reserve Rehabilitation Program (Fieldwork/Excursion):
Paragraph 1: Overview
Paragraph 2: Impact 1 – Soil Erosion & Degradation:
Paragraph 3: Impact 2 – Loss of Habitat & Biodiversity:
Strategy 2: Gondwana Link:
Paragraph 1: Overview
Paragraph 2: Ecological Restoration & Conservation:
Explain how the Point Walter Reserve Rehabilitation Program is Designed to Address the Impacts of Land Cover Change on Local &/or Regional Environments:
Strategy 1: Point Walter Reserve Rehabilitation Program (Fieldwork/Excursion):
Paragraph 1: Overview
→ Point Walter Reserve Rehabilitation Program is a land cover management Strategy implemented to restore & rehabilitate an area of ecological significance along the Swin-Cannin River Park in Perth.
→ Responding to combat natural & anthropogenic activities whereby the foreshore had become severely degraded.
→ In 2012 the City of Melville contracted the Natural Area Management and Services to implement large-scale restoration works completed in January 2014.
These two organisations continue to work & engage with one another.
Paragraph 2: Impact 1 – Soil Erosion & Degradation:
→ Limestone rock revetments are a system of interlocked rocks/small boundaries laid upon a bank to absorb erosive forces & stabilise the adjacent foreshore.
→ Gabion Cages are structures formed by a series of wire frame cages filled with rock that are wired together to provide shore scour protection.
→ Both structures were installed to separate the foreshore form the grassland area.
→ Both work to stabilise the foreshore & absorb wave & wind impact, mitigating against future erosion.
→ They also mitigate against future impacts of rising sea & estuary levels.
E.g., sea level near Fremantle is rising at a rate of 3mm/year
→ However, these structures have permanently modified the shape & aesthetics of the shoreline.
Paragraph 3: Impact 2 – Loss of Habitat & Biodiversity:
→ NAMS propagated 50,000 native tube stock for planting in 2012 – 2013:
The majority of plants were sedges & rushes which were salt hardened ensuring survival along the foreshore.
Larger trees were also planted & fenced off to the public along the eastern side of the project.
Replanting native vegetation improves bank stability, reduces erosion & creates future habitats for native fauna.
It is a cost-effective option planted mainly in areas non-vulnerable to human traffic ensuring longevity.
→ Increasing the extent of habitats & increasing the number & variety of species increases biodiversity, ecological balance & resilience of the area to future change:
Protects breeding & nesting ground of the vulnerable Australian Fairy Tern bird.
Additionally strategic fencing can better protect native biodiversity.
As sighted while on fieldwork the Department of Biodiversity, Conservation & Attractions fenced off the end of the sand spit at the Point Walter Foreshore.
The vegetated end of the spit is a meeting place for the beach nesting Fairy Tern bird.
Threatened from predation of cats & dogs, rising sea levels & human impact of trampling on eggs & habitat.
There are less than 3000 breeding pairs left in WA.
This site is used by 70 breeding pairs to raise their chicks, by protecting this the DBCA is fostering better conditions for biodiversity to flourish.
Explain how the Gondwana Link is Designed to Address the Impacts of Land Cover Change on Local &/or Regional Environments:
Paragraph 1:
→ The Gondwana link is a land cover management restoration program addressing land cover change on a local & regional environment in WA.
→ Beginning in 2002 this conservation program aims to restore & maintain ecosystem function & biodiversity levels across the bushland in the Southwest of WA.
→ It aimed to create a continuous 1,000km band of habitat & vegetation systems across the Southwest extending from the Karri Forest to the Dry Mallee Woodlands.
→ This part of SW WA is a biodiversity hotspot – a location where there are exceptional concentrations of endemic species undergoing excessive habitat loss.
E.g., This part of SW WA contains over 7,000 plant species – 80% of which are endemic
→ The greatest threat to biodiversity is deforestation to accommodate the expansion of anthropogenic biomes such as farms, mines & urban settlement.
→ Since European settlement up to 2/3 of this area has been cleared for agriculture.
→ 90% of the wheatbelt region has also been cleared over the last 100years
→ Consequently, the landscape has become fragmented & the number of plants & animals is declining every year.
Paragraph 2:
→ The Gondwana Link involves partnerships with private landholders, local indigenous communities, Greening Australia, Bush Heritage & some farmers to restore areas on farms suffering from degradation as a result of past land clearing.
→ This involves fencing off areas & replanting native plant species.
→ Conservation Action Plans of over 1million hectares has also been developed to survey & monitor the success rates of replanting.
E.g., Greening Australia purchased 3 properties in the Central Zone, restoring 2,500 hectares of native vegetation & protected 9,600 hectares of remnant habitat.
What to Discuss when asked to:
Evaluate the Two Strategies Designed to Address the Impacts of Land Cover Change, Using the Concept of Sustainability:
Point Walter Reserve: Sustainability Evaluation
Sustainability Definition
Social: Paragraph 1 & 2: Benefits & Costs:
Economic: Paragraph 3 & 4: Benefits & Costs:
Environmental: Paragraph 5 & 6: Benefits & Costs
Gondwana Link: Sustainability Evaluation
Sustainability Definition:
Social: Paragraph 1 & 2: Benefits & Costs
Economic: Paragraph 3 & 4: Benefits & Costs
Environmental: Paragraph 5 & 6: Benefits & Costs
How is Point Walter Reserve Designed to Address the Impacts of Land Cover Change, Using the Concept of Sustainability:
Sustainability: Meeting the needs of current and future generations through simultaneous, economic, environmental & social adaptations & improvements, achieved by the development & implementation of responsible, long-term planning & risk management.
Social:
Benefits:
→ Community Engagement: Involving local residents & organisations builds a shared sense of ownership & environmental responsibility, leading to more sustained community stewardship.
→ Enhanced Liveability: Visible improvements to the foreshore increase the area’s recreational & aesthetic value, enhancing quality of life for both locals & visitors.
→ Well-being and Inclusion: The rehabilitation encourages continued public use of natural spaces, fostering physical & mental well-being, social interaction, & appreciation for the natural environment.
→ Cultural Preservation: By protecting biodiversity & natural features, the program helps safeguard cultural and environmental heritage for future generations.
Costs:
→ Potential Restrictions: Fencing off areas (e.g. nesting sites) temporarily limit access to some recreational spaces.
Economic:
Benefits:
→ Cost-Effectiveness: The program prioritises low-cost, long-term strategies such as native vegetation planting, which are affordable and effective in the long run.
→ Low Maintenance: Native species require minimal upkeep compared to exotic plants, significantly reducing future water use and landscaping costs.
→ Prevention of Major Repairs: Proactively addressing erosion and degradation prevents the need for expensive rehabilitation projects in the future.
→ Walters River Café: Benefits from the increase in visitors which supports the tourism sector.
Costs:
→ Initial Investment: Structural interventions and revegetation efforts may have upfront costs, particularly for materials like limestone rock or gabion cages.
→ Ongoing Monitoring: While lower maintenance, the success of native planting and erosion control still requires regular monitoring and minor upkeep.
Environmental:
Benefits:
→ Ecological Health: The program improves the long-term resilience and health of the foreshore environment, helping ecosystems recover from degradation.
→ Erosion Control: Structural interventions such as limestone revetments and gabion cages effectively stabilise the shoreline against wave action and recreational overuse.
→ Climate Adaptation: These measures mitigate the impact of sea level rise (noted at 3mm/year near Fremantle), supporting climate resilience.
→ Biodiversity Restoration: Replanting native vegetation enhances habitat quality and supports native species, including the vulnerable Australian Fairy Tern.
→ Species Protection: Fencing off nesting grounds reduces human and pet interference, directly aiding in the survival of threatened fauna.
Costs:
→ These structures change the morphology or composition of the foreshore permanently, because they influence & change the natural processes of transportation & deposition of sand along the shoreline.
How is the Gondwana Link Designed to Address the Impacts of Land Cover Change, Using the Concept of Sustainability:
Sustainability: Meeting the needs of current and future generations through simultaneous, economic, environmental & social adaptations & improvements, achieved by the development & implementation of responsible, long-term planning & risk management.
Social:
Benefits:
→ Community Engagement: The project fosters collaboration with private landholders → Cultural Reconnection: Reconnecting country addresses & mitigates against the loss of ecosystem services in terms of cultural services.
→ First Nation Leadership: A Noongar Ranger program was established in 2015 engaging indigenous people to heal & restore the land.
→ Cultural Projects: E.g., in Stirling Ranges National Park, a 300-metre goanna formed from native plantings symbolically restores Indigenous narratives and brings cultural life back to the landscape.
Costs:
→ No major social costs have been identified, though long-term success relies on continued collaboration, recognition of Indigenous rights, & equitable benefit-sharing.
Economic:
Benefits:
→ Diverse Funding Sources: Initial support came from government programs like Caring for Country, Landcare, and the National Heritage Trust.
→ Strong Private Investment: Of the $35 million+ raised since 2002, 70% has come from private donations, highlighting strong community support.
→ Commercial Partnerships: Funding is increasingly supported by corporate investment in carbon sequestration initiatives.
→ Job Creation & Skill Development: The project has additionally generated jobs & volunteer work opportunities building skill in land cover management.
Costs:
→ High Upfront Investment: The scale & ambition of the Gondwana Link requires significant financial input, which may be a barrier to replication or expansion without sustained funding.
Environmental:
Benefits:
→ Large-Scale Habitat Restoration: The Gondwana Link covers a diverse range of biomes, from forests to semi-arid woodlands, aiming to reconnect and restore landscapes.
→ Successful Revegetation: Over 1,500 hectares have been revegetated by human intervention and 850 hectares have regenerated naturally in the Fitzgerald and Stirling regions.
→ Biodiversity Recovery: The strategy has helped mitigate biodiversity loss, with species such as honey & pygmy possums recolonising restored areas within a few years of planting.
→ Wildlife Corridors: The link provides essential pathways for mobile species, reducing the risk of localised extinctions in fragmented habitats.
→ Protection of Endangered Species: It plays a crucial role in the survival of Black Cockatoos, particularly the Baudin’s Cockatoo, which has lost 90% of its population in the past 50 years. Reforested corridors allow for feeding, breeding, and nesting.
→ Central Zone Conservation: 16,000 hectares have been secured and 13,500 hectares restored through native biodiversity plantings, improving resilience to fire, pests, diseases, and climate change.
→ Reforestation: addresses the impact of ecosystem services (direct & indirect contributions of ecosystems to human well-being).
E.g., pollination is a regulating service impacted by land clearing, alleviated through reforestation, i.e., the jarrah tree flowers every 2 years & can take 25-30 from seed to blossom for a mature jarrah tree to produce honey.
Increased vegetation across the Gondwana Link positively influences key processes in the water cycle addressing climate change impacts.
Land clearing has been the primary factor contributing to the areas 20% decrease in rainfall since the 1970s.
Plants slow down surface runoff on slopes allowing for greater recharging underground water sources through greater infiltration rates.
Climate Moderation: Increased tree cover contributes to cooling through canopy shading and transpiration, potentially increasing local rainfall.
Costs:
→ Bushfire Risk: As natural vegetation cover increases so does bushfire risk, due to higher fuel loads.
→ Dieback Spread: The expansion of natural habitats also raises the risk of dieback disease spreading across vulnerable ecosystems.