aphug unit 1 type of maps
1/5
There's no tags or description
Looks like no tags are added yet.
Name | Mastery | Learn | Test | Matching | Spaced | Call with Kai |
|---|
No analytics yet
Send a link to your students to track their progress
6 Terms
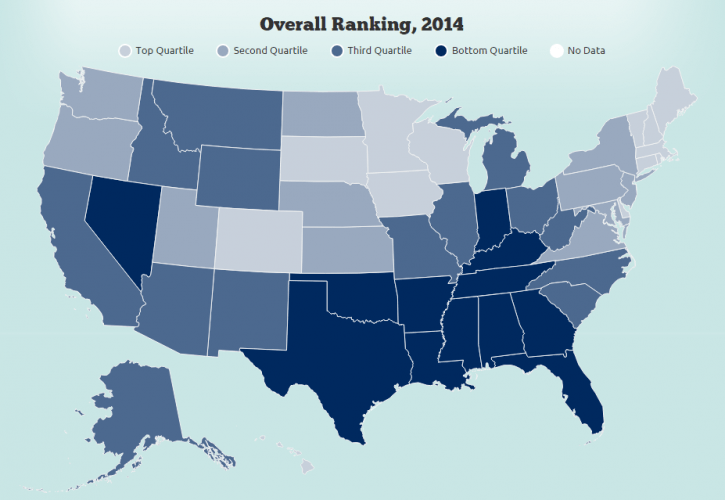
choropleth
uses various colors or patterns to show the location and distribution of spatial data
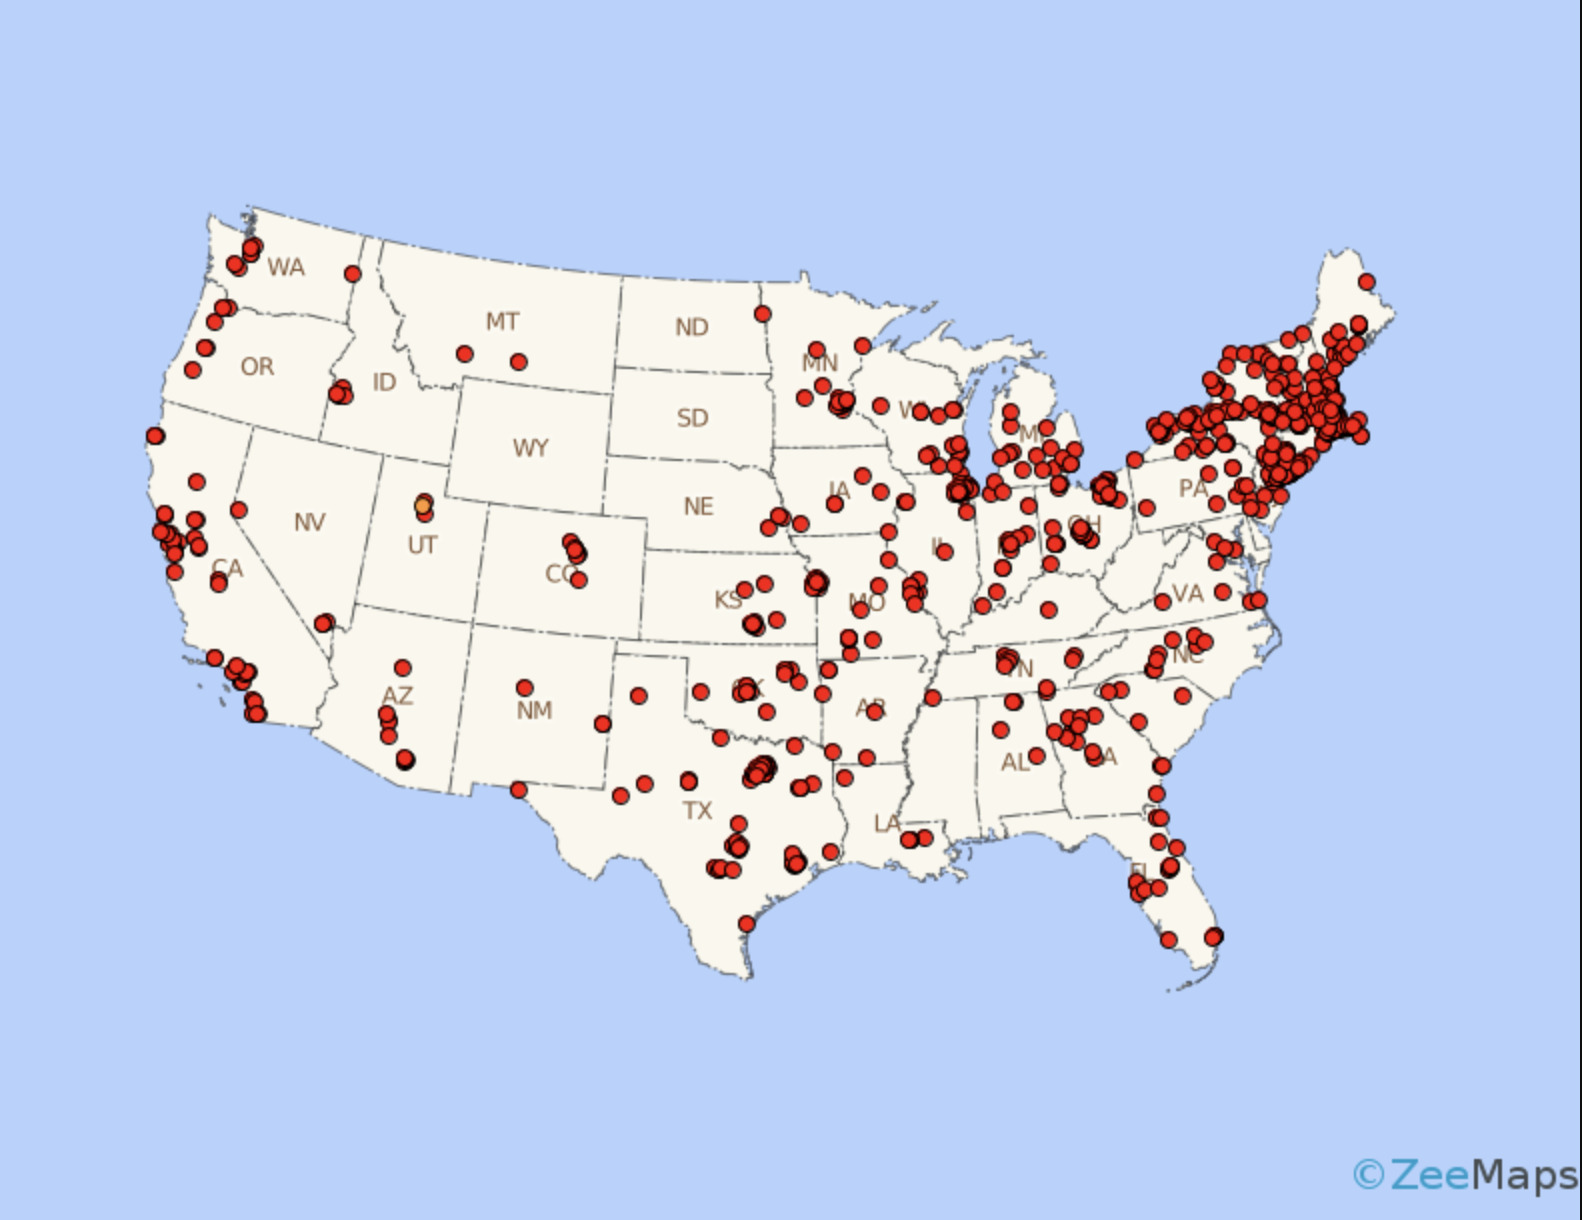
dot density
each t represents a specific quantity of a spatial characteristics
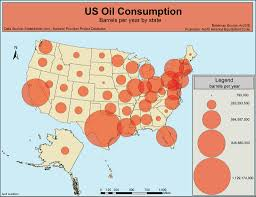
graduated/proportional symbol
use symbols of different sizes to indicate different amount of a variable (quantity)
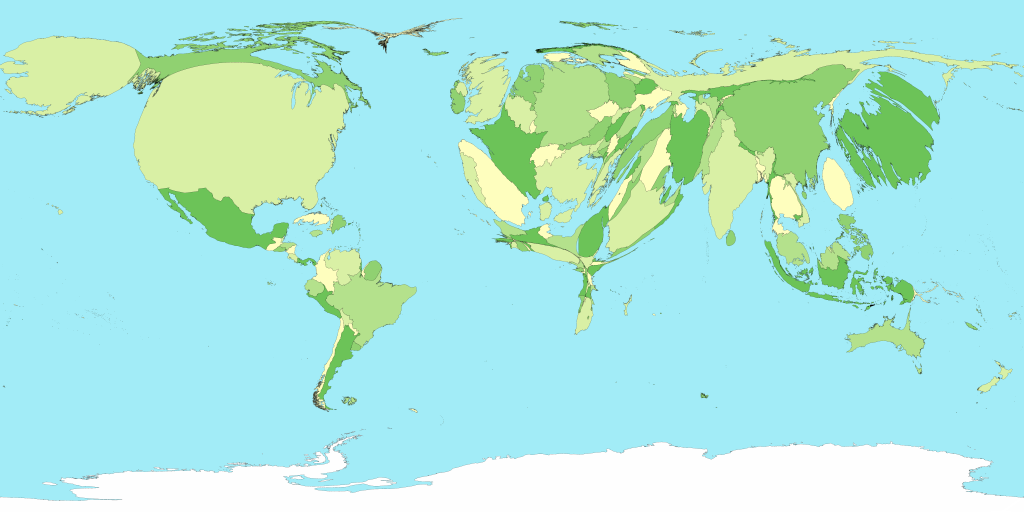
cartogram
the sizes of countries are shown according to a specific variable, area is distorted to show a variable
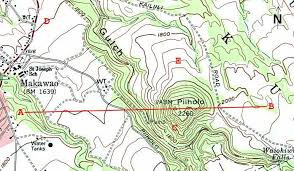
isoline
uses lines (isolines) to connect points of equal value, visually representing continuous data like elevation, temperature, pressure, or travel time across a geographic area to show patterns and gradients
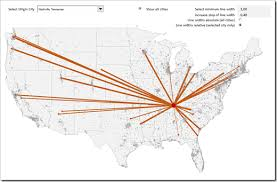
flow
that illustrates movement, sequence, or connection between points