Wind Turbines Exam
1/40
There's no tags or description
Looks like no tags are added yet.
Name | Mastery | Learn | Test | Matching | Spaced | Call with Kai |
|---|
No study sessions yet.
41 Terms
Most consider the Brush mill as the first wind turbine to generate electricity. However, half a year earlier professor James Blyth had already been successful in making a turbine for that purpose. Given their close succession in time, what will these two turbines have in common?
A.Their development was triggered by the expansion of the public electrical grid to rural areas
B. They are both vertical axis wind turbines
C. Their electricity was meant to power local devices, in particular lighting
D. The main purpose of the generated electricity was to get hydrogen from electrolysis
C
Explicación:
The first wind turbines for electricity were developed to power domestic electrical devices, especially lighting. Grid expansion occurred much later, hydrogen production appeared later in the work of Poul la Cour, and the Brush mill was not a vertical axis turbine.
When did electrification of rural areas in the US start and what technological development was its direct consequence?
A. At the end of the 19th century, respectively the production of hydrogen with wind energy
B. Around 1940, respectively the use of grid connected generators
C. Around 1970, respectively large-scale wind turbines
D. Around 1940, respectively 3-bladed turbines
Around 1940, respectively the use of grid connected generators
The Gedser wind turbine, which was developed by Johannes Juul around 1956, is a model for the ‘Danish wind turbine’. Which statement about this wind turbine is true?
A. It was the start of the era in which wind turbines have a rated power of more than 1 MW
B. It had a DC generator, particularly suitable to charge batteries for isolated use in rural areas
C. It had 3 blades and stall control
D. It was the first grid connected wind turbine
C
Explicación:
The turbine was grid-connected but not the first of its kind, as the Smith–Putnam turbine had already been grid-connected in 1941.
Who and what made upscaling of wind turbines a success?
A. Large organisations, such as Boeing and Nasa, who sought for solutions to battle the oil crisis
B. Pioneers who learned from earlier experience and gradually increased turbine size
C. Universities, who pointed out the weaknesses of small scale turbines
D. Smith-Putnam, by making the first pitch-controlled wind turbine of more than 1 MW rated power
Pioneers who learned from experience and gradually increased turbine size
In the 1980’s, big organisations such as Boeing and NASA tried to make wind turbines in the range 2 - 4 MW. Why were these attempts not successful?
A. There was insufficient knowledge to make the big step in scale
B. The concept that became successful later was not yet in development
C. The public grid didn’t have sufficient strength to support these big turbines
D. These turbines were too big to achieve mass production at the time
A
Explicación:
Although much knowledge was gained, it was not sufficient to support such rapid upscaling. Gradual increases in size were necessary to allow knowledge to develop alongside the technology.
Around 1900, Poul la Cour led several structured experimental developments. What characterised these developments?
A. Introduction of pitch-controlled turbines
B. Focus on grid connection in rural areas
C. Emphasis on reliability and series manufacturing
D. Use of storage and hydrogen production to balance supply and demand
Use of storage and hydrogen production to balance supply and demand
Why do very large wind turbines use pre-bending of the blades?
A. To reduce stress when blades bend back to a straight shape
B. To increase blade stiffness and natural frequency
C. To increase the clearance between blade tip and tower
D. To reduce centrifugal stiffening effects
To increase the clearance between blade tip and tower
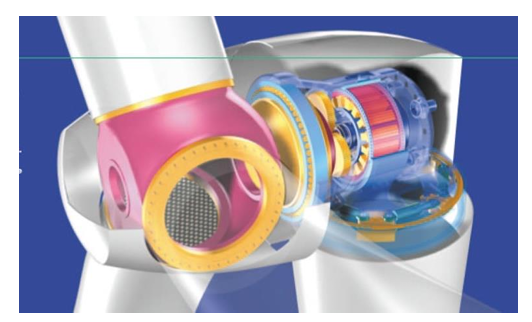
The figure shows a drive train with one gear stage and a medium-sized generator. What type of drive train is this?
A. Traditional drive train with gearbox
B. Drive train with power-splitting gearbox
C. Direct drive
D. Compact drive train (hybrid or Multibrid)
D
Explicación:
A compact drive train has a single gear stage and a medium-sized generator. Traditional gearboxes have multiple stages, direct drives have no gearbox and a large generator, and power-splitting systems use more than one generator.
What is the formal name for the complete machinery and housing on top of the tower?
A. Wind turbine
B. Wind mill
C. Rotor-nacelle assembly
D. Nacelle
C. Rotor-nacelle assembly
An article claims that since about 2010 most wind turbine blades have been made and installed in two sections. What can be concluded?
A. The claim is correct
B. Blades are always bonded as one piece
C. Turbines did not increase in size around 2005
D. Only a minority of turbines use two-section blades
D
Explicación:
Two-section blades are considered an uncommon configuration, and most turbines still use single-piece blades.
Why is cast iron used for part of the wind turbine hub instead of a welded structure?
A. It enables better aerodynamic shaping
B. It allows mass optimisation of the hub
C. It increases supplier flexibility
D. The part does not carry blade loads
B
Explicación:
The cast iron part is load-carrying, and cast iron allows better optimisation of mass. Welded structures actually have more supplier competition.
Which principle is not used to magnetise the rotor of a wind turbine generator?
A. Ionisation
B. Permanent magnets
C. Electrical excitation
D. Induction
A. Ionisation
What is the main advantage driving the development of superconducting generators for wind turbines?
A. More compact and lighter construction
B. Higher efficiency under all conditions
C. Superconductors are environmentally friendly
D. Reduced use of rare earth metals
A
Explicación:
Lower electrical losses reduce heat generation, which reduces cooling requirements. This allows smaller and lighter generators. System efficiency is not necessarily higher due to cooling energy consumption.
Consider a wind turbine with a gearbox that consists of only one stage, which is a planetary gear. The drawing below shows this gear. The rotor that is attached to the gearbox will rotate clockwise. To which part of the gearbox will the rotor be attached and what is the direction of rotation of the generator?
A. Rotor attached to sun, generator clockwise
B. Rotor attached to sun, generator counter-clockwise
C. Rotor attached to planet carrier, generator clockwise
D. Rotor attached to planet carrier, generator counter-clockwise
C
Explicación:
The rotor is connected to the slower planet carrier to increase rotational speed. Due to gear interaction, the sun gear and thus the generator rotate clockwise at a higher speed.
What is an advantage of a completely welded main frame compared to a cast-iron frame?
A. More compact load-carrying structure
B. Lower mass
C. More suppliers and competition
D. Unique separation of load and auxiliary frames
C
Explicación:
Compactness and lower mass are advantages of cast-iron frames. Separation of load and auxiliary frames is possible in both designs.
Where are mechanical brakes found in a modern wind turbine?
A. Drive train only
B. Drive train and yaw system
C. Drive train and pitch system
D. Drive train, yaw system and pitch system
D. Drive train, yaw system and pitch system
Are the following statements true or false?
a. Modern wind turbines use the blades as a brake to slow down the rotor.
b. Pre-bending of large blades, to avoid hitting the tower, is achieved by making the blades in a curved mould.
A. Both true
B. Both false
C. a true, b false
D. a false, b true
A. Both true
What does the term “edgewise” mean?
A. Out-of-plane direction
B. Outboard blade section
C. Synonym for flapwise
D. Direction parallel to the chord line
D. Direction parallel to the chord line
In north-west Europe we have predominantly south-westerly wind, due to global patterns in wind. Based on these patterns, what can be expected for the wind at similar latitudes on the southern hemisphere (e.g. southern Australia)?
A. The wind direction will be predominantly south-westerly
B. The wind direction will be predominantly south-easterly
C. The wind direction will be predominantly north-westerly
D. The wind direction will be predominantly north-easterly
C
Explicación:
Global circulation causes air to flow toward the poles. On the southern hemisphere this corresponds to wind coming from the north. Due to the Coriolis force, poleward flow bends eastward, meaning wind comes from the west, resulting in predominantly north-westerly wind.
The surface roughness length z₀ at sea is approximately:
A. 0.2 m
B. 0.02 m
C. 0.03 m
D. Another value
D
Explicación:
At sea the typical roughness length is z₀ ≈ 0.0002 m, which is much lower than any of the given numerical values.
Enunciado:
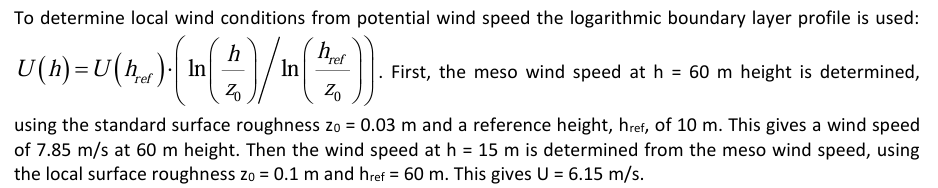
At a certain location the potential wind speed is 6 m/s. Wind speed is measured at 15 m height. The surrounding terrain has z₀ = 0.1 m. What is the average wind speed measured after one year?
A. 5.88 m/s
B. 6.15 m/s
C. 6.36 m/s
D. 6.53 m/s
B
Explicación:
First the meso wind speed at 60 m is determined using the standard roughness z₀ = 0.03 m, giving 7.85 m/s. Then the local roughness z₀ = 0.1 m is used to translate this to 15 m height, resulting in 6.15 m/s.
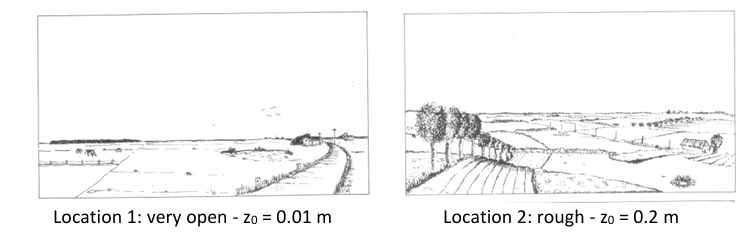
Two locations 5 km apart have different surface roughness. Location 1 is a meadow, location 2 has trees and houses. Which statement about potential and actual wind speed at 20 m height is true?
A. Both potential and actual wind speeds are higher at location 1
B. Potential wind speed is higher at location 1, actual wind speed is the same
C. Potential wind speed is the same, actual wind speed is lower at location 1
D. Potential wind speed is the same, actual wind speed is higher at location 1
D
Explicación:
The meso wind speed and thus the potential wind speed are nearly the same over several kilometres. Actual wind speed at 20 m is higher over smoother terrain because wind speed decreases less rapidly with height.
You know the potential wind speed for a site where a turbine with hub height 105 m will be installed. What is the recommended procedure to estimate wind speed at hub height?
A. Power law → logarithmic law with local roughness
B. Logarithmic law with standard roughness → power law
C. Logarithmic law with standard roughness → logarithmic law with local roughness
D. Logarithmic law with local roughness → logarithmic law with standard roughness
B
Explicación:
The logarithmic profile is used up to the meso height (≈60 m) using standard roughness. Above that height the power law is recommended.
You’ve found measurements of wind speeds on the Internet. The website provides a lot of information about how data is collected and processed, although it isn’t specific in the details. You found the following information, but it may not all be relevant:
- The annual average potential wind speed is 6.5 m/s
- The raw data is measured at 20 m height
- The roughness of the terrain in the surroundings of the met-mast can be classified with z0 = 0.1 m
- The power law coefficient can be approximated with α = 0.14
What is the annual average wind speed at 60 m, if you use the recommended practices of this course?
A. 7.6 m/s
B. 7.8 m/s
C. 8.5 m/s
D. 9.0 m/s
C
Explicación:
Potential wind speed is defined at 10 m with standard roughness. The logarithmic profile is used up to 60 m, leading directly to U(60) = 8.5 m/s.
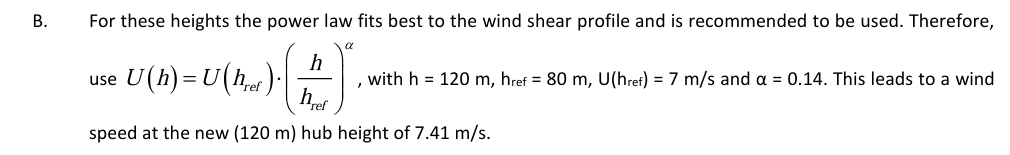
You are going to repower a site with 20-year-old turbines. Repowering means that the old turbines are being removed and replaced by newer turbines. The old turbines had a hub height of 80 m. The new turbines will be larger and will get a hub height of 120 m. You’ve been given the original documentation of the old wind farm and found the following information:
• Annual average wind speed at hub height: Uavg = 7 m/s.
• Local surface roughness: z0 = 0.2 m.
• Standard surface roughness: z0 = 0.03 m.
• Exponent of power law: α = 0.14.
What is a good estimate of the annual average wind speed at the hub height of the new turbines, according to the suggested approach from this course?
Assume that the wind climate has not changed in the meantime. You have to decide for yourself which information from the original documentation is needed to get to the answer.
A. 7.36 m/s
B. 7.41 m/s
C. 7.45 m/s
D. 7.47 m/s
For these heights the power law is recommended. Applying it yields U(120 m) = 7.41 m/s.
Two sites have identical potential wind speed. Site 1 has z₀ = 0.01 m, site 2 has z₀ = 0.2 m. What can be said about the wind speed at 60 m height?
A. Higher at site 1
B. Higher at site 2
C. Same at both sites
D. Cannot be determined
C
Explicación:
Potential wind speed is based on wind speed at higher altitude translated to 10 m using standard roughness. If potential wind speed is equal, wind speed at 60 m is equal regardless of local roughness.
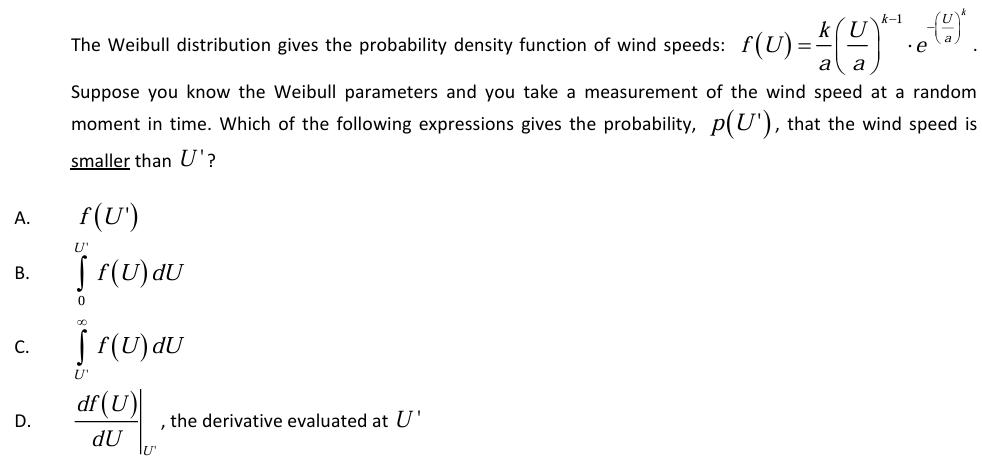
B. The integration of the probability density function between 0 and 'U gives the probability that the wind speed falls in the ‘bin’ between 0 and 'U . This is the same as being smaller than 'U .
You are analysing a site with a wind speed distribution that has a Weibull shape factor of 2.2 and a scale factor of 9 m/s. Which percentage of time is the wind speed at this site between 7.2 m/s and 7.8 m/s?
A. 4%
B. 6%
C. 8%
D. 10%
B
Explicación:
Using the cumulative distribution: F(7.8) − F(7.2) ≈ 0.06.
Alternatively, f(7.5) ≈ 0.1 and ΔU = 0.6 m/s, giving 0.06.
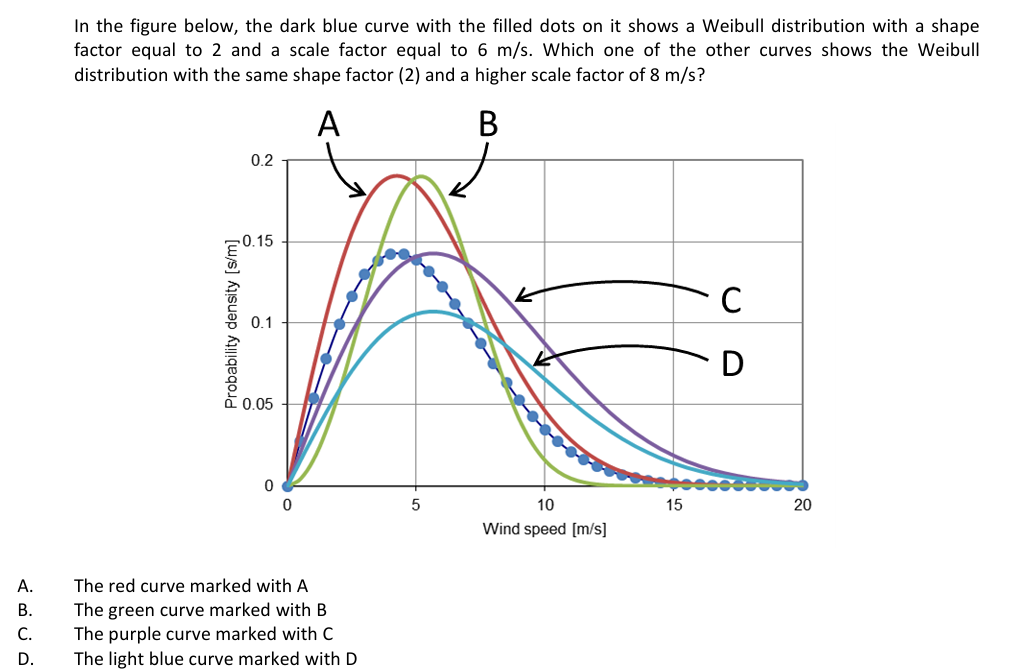
D. When the shape factor remains the same and only the scale factor changes, the Weibull curve is stretched to the right, giving higher probability to higher wind speeds. Since the total probability, the area below the curve, should remain equal to 1, the curve has to go down (shrink along the y-axis). Curve A increases the probability of all wind speeds equally, thus not affecting the scale factor, but resulting in an area below the curve larger than 1. Curve B changes the shape of the curve (and in this case the scale factor is actually the same as the original Weibull curve). Curve C keeps the same shape, but also in this case the area below the curve increases.
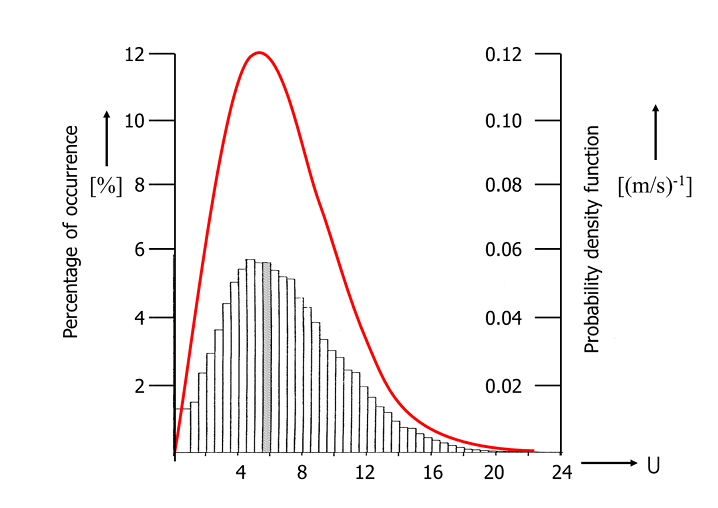
Someone measured 10-minute average wind speeds during an entire year and made a histogram of the data (the bars in the graph below, using the left-hand side axis). Then (s)he fitted the data to get the Weibull parameters of the probability density function for these measurements (the curve in the graph below, using the right-hand side axis). Which of the next statements gives a fair observation?
A. The Weibull curve properly represents the data
B. Shape factor should be halved
C. Scale factor should be halved
D. Probability density should be divided by two
A. The wind speed data is collected in bins of 0.5 m/s width. If the bin width is doubled in size to 1 m/s width, the percentage of occurrence of the bins becomes about twice as large. E.g. the grey bar give the percentage of occurrence of wind speeds between 5.5 and 5 m/s, which is about 5.8%. To get the percentage of occurrence between 5 and 6 m/s, we have to add the occurrences between 5 and 5.5 m/s, which is also about 5.8%. So, the percentage of occurrence of wind speeds between 5 and 6 is about 11.6 percent, or a fraction of 0.116 of all occurrences. This corresponds with the Weibull curve. Since the unit of the Weibull curve is (m/s)-1, we expect this correspondence for a bin width of 1 m/s, as also stated on the slides of topic 2.3 ‘Wind speed variation in time’.
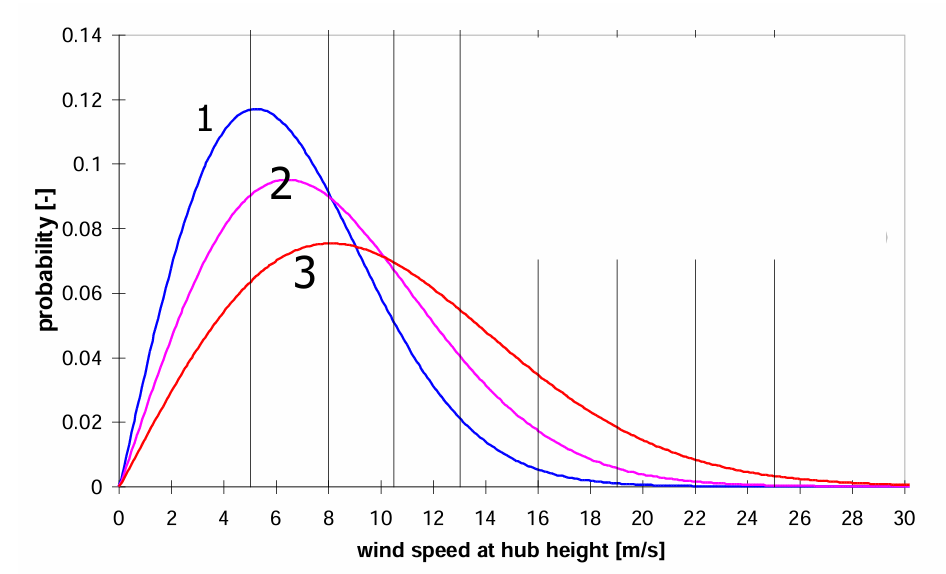
Below you see three wind speed probability curves. Is there a curve that may represent an average wind speed of 8 m/s?
A. Yes, curve 1
B. Yes, curve 2
C. Yes, curve 3
D. No
B. See examples of Weibull curves in topic 2.3 ‘Wind speed variation in time’. The peak of the (Weibull) probability density function is typically at a lower wind speed than the average wind speed.
You have to prepare a time series of the wind speed, to be used in a simulation of the behaviour of a wind turbine. The time series has to be representative of the conditions that the turbine will experience most often in a year.
The first step to take is to determine the 10-minute average wind speed for the simulation. These are two options to do that:
1. From the (Weibull) probability density function, determine the 10-minute average wind speed at which this function reaches its maximum.
2. From the cumulative (Weibull) probability function, determine the 10-minute average wind speed at which the probability equals an occurrence of once per year.
The second step is to create the wind speed variation around this 10-minute average wind speed. These are two options to do that:
i. For the 10-minute average wind speed found in the previous step, make a realisation of a time series from a spectrum with the turbulence intensity that typically occurs at that wind speed.
ii. Take the 10-minute average wind speed found in the previous step and add the prescribed deterministic gust with a reduced height.
Which of the next combinations gives the proper approach?
A. Option 1 followed by option i
B. Option 1 followed by option ii
C. Option 2 followed by option i
D. Option 2 followed by option ii
A. See topic 2.3.4 ‘Recreating short-term time series of wind’ for the principles applied. Option 1 is used, because the peak of the Weibull curve means the highest probability density for wind speeds around that peak. Therefore, these 10-minute average wind speeds occur most often in a year. Within those 10 minutes, having normal turbulence, as represented by the spectrum (option ‘i'), is more common than having a specific gust. As mentioned in topic 2.3.4, the deterministic gust is used to represent extreme wind conditions.
The variability of wind speed in time is divided into short term and long term variability. Consider the following common means to describe wind conditions:
1. Weibull distribution
2. Turbulence spectrum
3. Wind rose
4. Load case definition
Which of these descriptions contain information about the long-term wind variability?
A. 1 and 2
B. 1, 2 and 3
C. 1, 3 and 4
D. 3 and 4
C. The Weibull distribution describes how often 10-minute average wind speeds occur over a longer time period. The wind rose does the same for the occurrence of wind direction. Load cases describe both the long-term conditions (e.g. 10-minute average wind speed) and the short-term variability (e.g. turbulence intensity or gust), based on a reasonable probability of occurrence of the combination. Therefore, this also contains information about long-term conditions. The turbulence spectrum only describes the variability within a (short) 10-minute period.
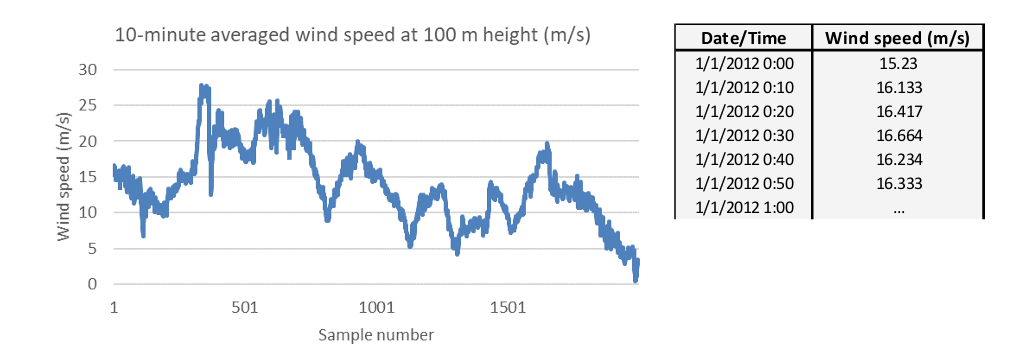
The graph below shows a time series of 10-minute-averaged wind speeds. This means that each data point is the average of the wind speed in 10 minutes. To further clarify this, the table on the right-hand side shows the data for the first hour of the dataset. This dataset cannot be used to obtain:
A. Turbulence intensity
B. Annual average wind speed
C. Probability density function
D. Cumulative distribution function
A. The turbulence intensity is defined as the standard deviation of the wind speed within a 10-minute period. This is a measure of the short-term wind speed variability, while the graph shows the long-term variability.
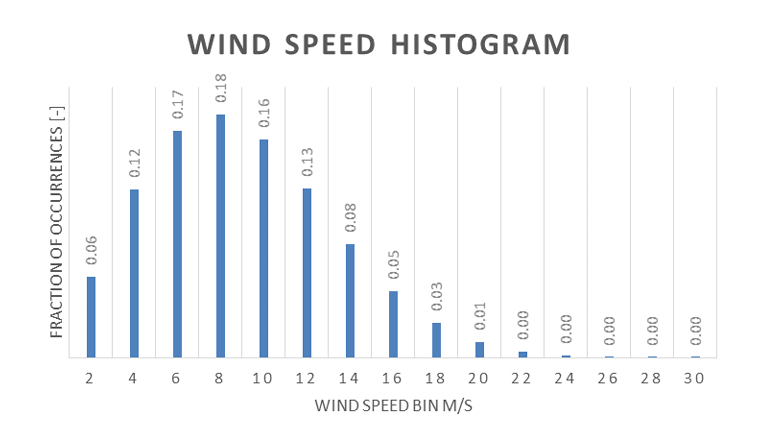
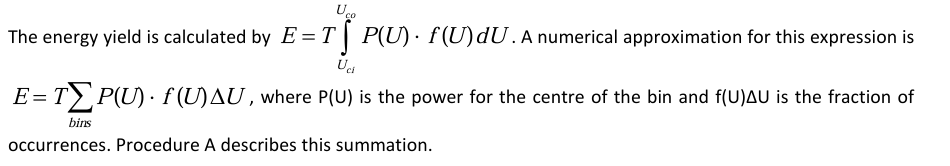
You have a histogram of wind speed occurrences for bin sizes of 2 m/s, such as the example shown below. The ‘Fraction of occurrences’ is the number of times that the 10-minute mean wind speed falls in the bin, divided by the total number of 10-minute periods during the measurements. How do you estimate the annual energy yield from this?
A. Take the power for each centre of the bin from the power curve – multiply this with the fraction of occurrences – add the results of all bins – multiply this result with the number of hours in a year
B. Take the power for each centre of the bin from the power curve – multiply this with the fraction of occurrences times 2 – add the results of all bins – multiply this result with the number of hours in a year
C. Determine the average wind speed from the histogram – determine the power for this average wind speed from the power curve – multiply this power with the number of hours in a year
D. Determine the average wind speed from the histogram – determine the capacity factor by dividing the average wind speed by the rated wind speed – multiply this capacity factor with the rated power and with the number of hours in a year
A. The fraction of occurrences is not f(U) and therefore the result per bin should not be multiplied by ΔU = 2 m/s. The effect of the bin size is already included in the fraction of occurrences: if the bin size would double, the current fraction of occurrences of two bins would need to be added, thus becoming about twice as large.
A turbine with a rated power of 2.3 MW has produced 0.58 GWh of electricity in January. What was the capacity factor for that month?
A. 0.17
B. 0.25
C. 0.34
D. 0.41
C. The number of hours in January is 31*24 = 744. At full capacity, the turbine would have produced 744*2.3 = 1711 MWh = 1.7 GWh. The capacity factor is the actual production divided by the production at full capacity, so cf = 0.58/1.7 = 0.34.
Two wind turbines are installed in wind climates that have the same Weibull distribution at the respective hub heights of the two turbines. Turbine 1 has a rated power of 3.5 MW and a rotor diameter of 97 m. Turbine 2 has a rated power of 2.5 MW. After a year of operation the capacity factor of both turbines is determined. The capacity factor of turbine 2 appears to be higher than that of turbine 1.
Which of the following statements reflects most precisely what this tells you about the rotor diameter of turbines 2? Assume that both turbines have the same efficiency at all wind conditions.
A. Larger than 69 m
B. Larger than 82 m
C. Larger than 87 m
D. Larger than 97 m
B. The turbines would have exactly the same capacity factor when they have the same rated wind speed. In that case the power curve of the 2.5 MW turbine is the same as the power curve of the 3.5 MW turbine, but scaled by 2.5/3.5 along the y-axis. This is the case when the rotor areas scale with the rated power, so Arotor,2 = 2.5/3.5 Arotor,1. So, when turbine 2 has a diameter of sqrt(2.5/3.5)*97 = 82 m, both turbines would have the same rated wind speed and thus the same capacity factor. Since the capacity factor of turbine 2 is higher, it has to have a lower rated wind speed than turbine 1, and thus a higher rotor diameter than 82 m.
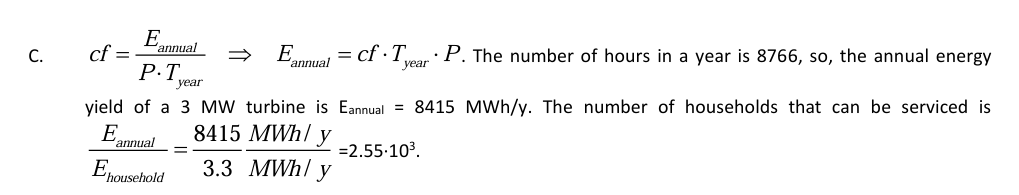
The average annual electricity consumption of a Dutch household is approximately 3.3 MWh/y. If we install turbines at good locations onshore, along the coast line, we can achieve capacity factors of about 0.32. How many households can be serviced with a 3 MW turbine?
A. 2.55
B. 7.97
C. 2.55·10³
D. 7.97·10³
C
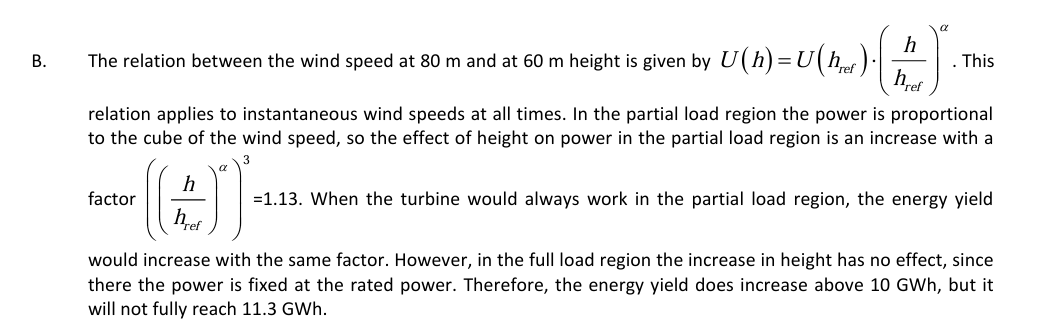
A wind turbine at a location in Delft has an annual energy yield of 10 GWh. The coefficient of the power law is approximately 0.143 for locations on land. What would be the best estimate for the annual energy yield when the turbine is put on a different tower, to increase hub height from 60 m to 80 m?
A. Less than 10 GWh
B. Between 10 and 11.3 GWh
C. Approximately 11.3 GWh
D. More than 11.3 GWh
B
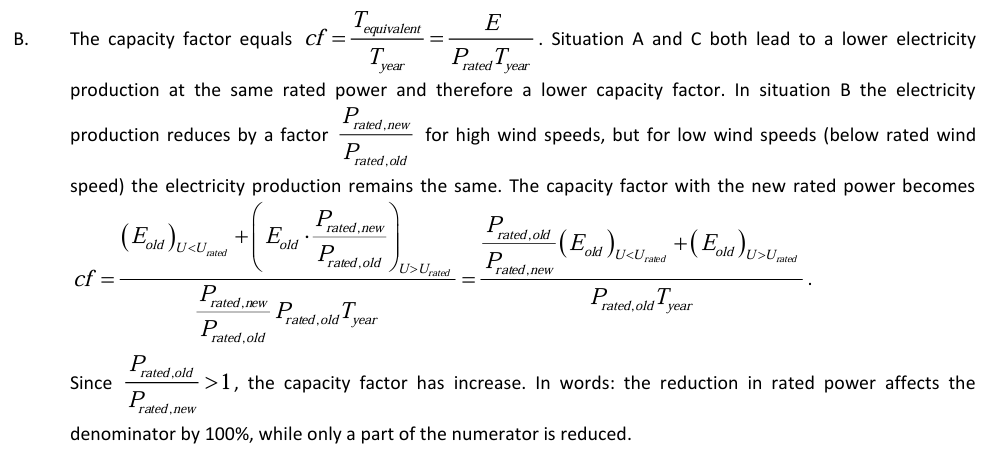
For a turbine installed at a location near Delft the capacity factor has been determined to be 0.29. The capacity factor would have been bigger when
A. Same rated power, smaller rotor
B. Same rotor, smaller rated power
C. Lower average wind speed
D. None of the above
B
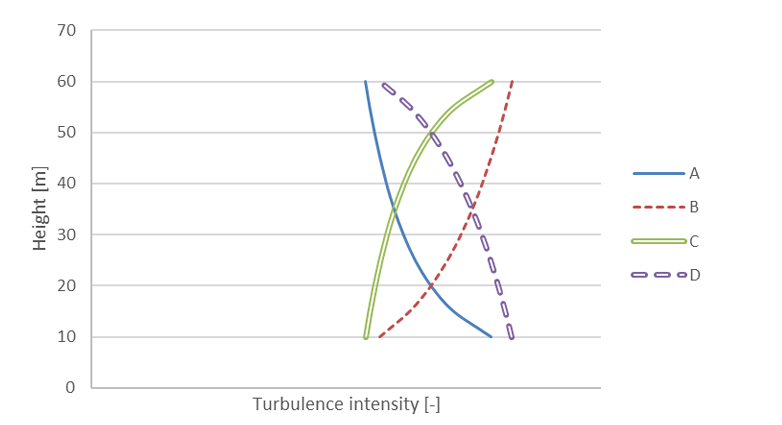
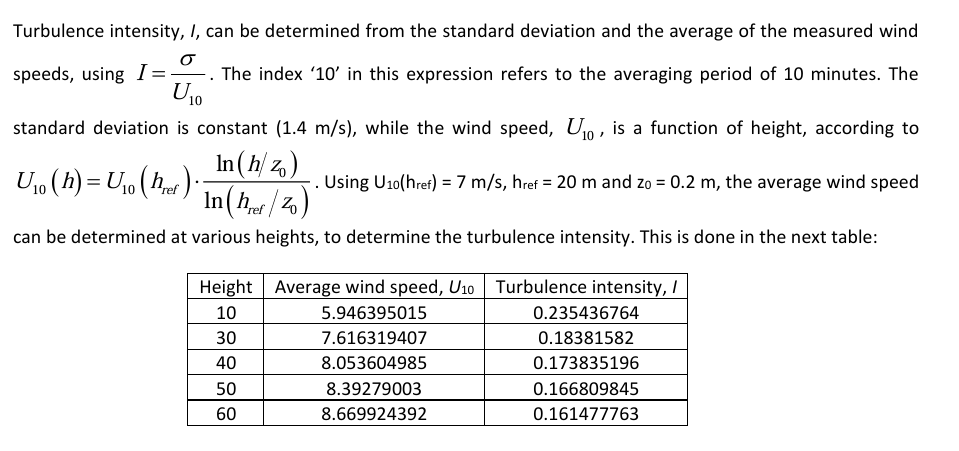
For a site in rough landscape (z0 = 0.2 m) you’ve determined that the turbulence expressed as standard deviation of the wind speed is independent of height. After measuring the wind speed for 10 minutes, you find that the average wind speed at 20 m height was 7 m/s, and the standard deviation of the wind speed variations was equal to 1.4 m/s. Which of the following graphs shows the turbulence intensity as a function of height for this site? Note: there are no values on the x-axis on purpose.
A. Decreasing with height
B. Constant with height
C. Increasing with height
D. Random
A. These numbers can be used to make a sketch that corresponds with the solid blue curve. Calculating just 3 points is enough to establish the shape of the curve. This result can also be argued qualitatively. From I = 10 , it is immediately clear that for a constant σ the turbulence intensity should be larger at lower heights (which have a lower average wind speed). At greater heights the change in average wind speed with height levels off, so also the change in turbulence intensity with height should level off. This behaviour is seen in the solid blue curve.