Tutorial Questions 2, significance tests
1/5
There's no tags or description
Looks like no tags are added yet.
Name | Mastery | Learn | Test | Matching | Spaced |
|---|
No study sessions yet.
6 Terms
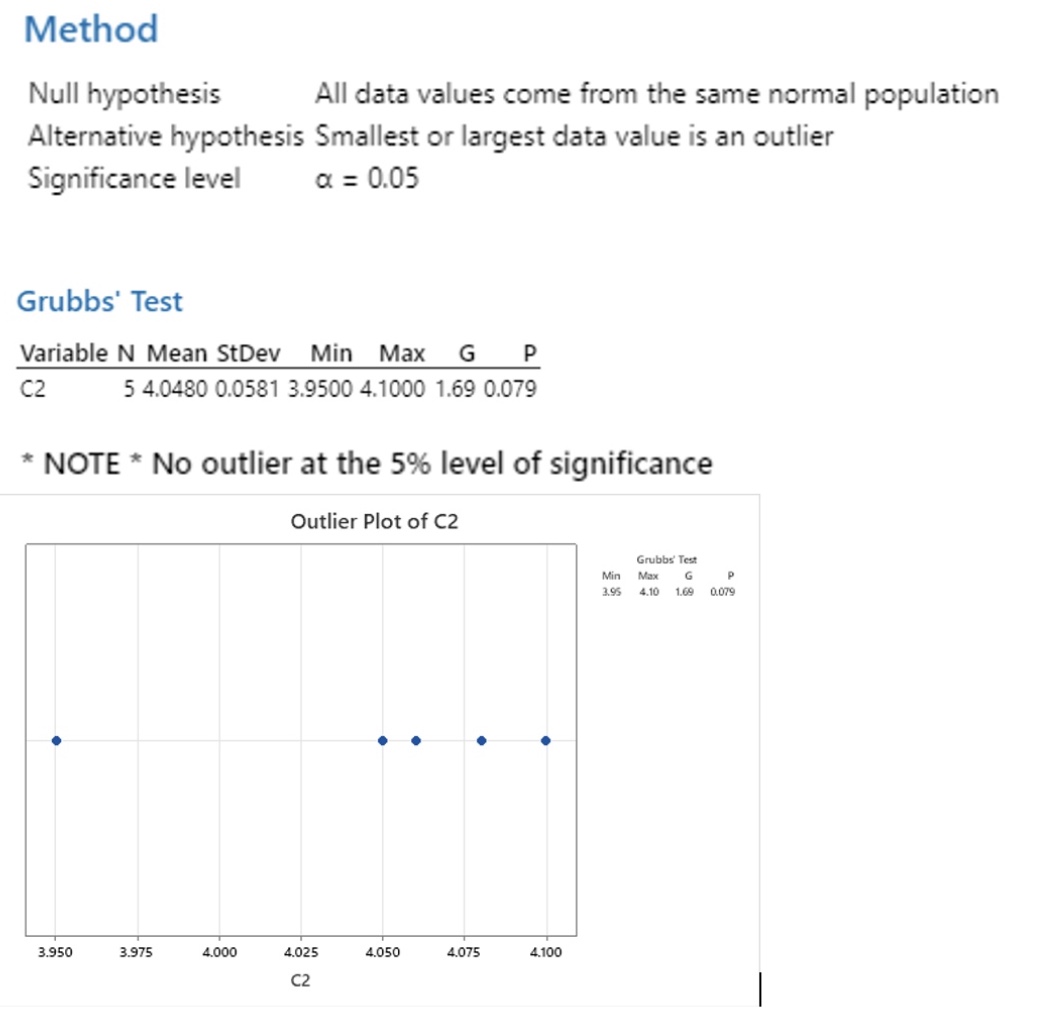
1. The concentration of glucose in a series of samples was determined and the following results obtained:
Glucose concentration, mM: 4.05, 4.08, 3.95, 4.10, 4.06
Is the sample which recorded a value of 3.95 mM an outlier according to (a) Q test (b) Grubbs’ test?
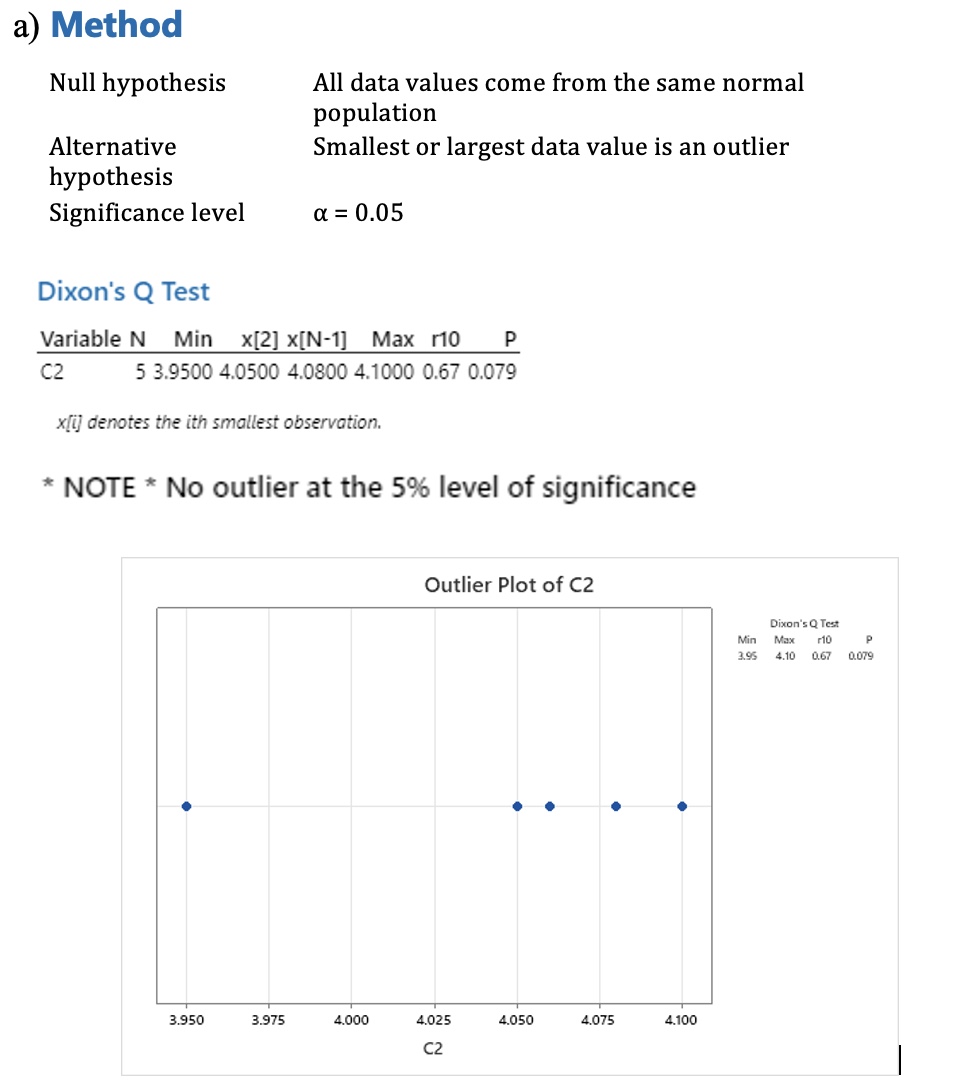
Q test (b) Grubbs’ test?
no outlier, however if it was carried out at 10% there would be.
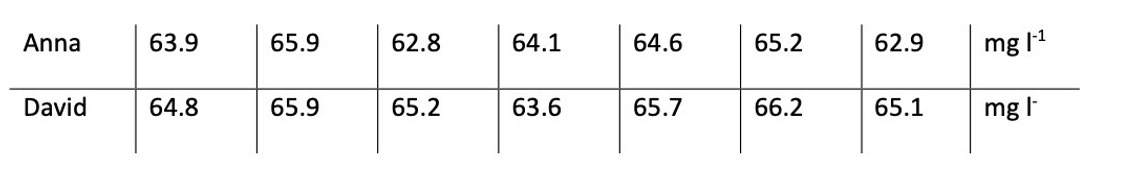
1. An analytical lab requires all new analysts to carry out a trial using a standard operating procedure to analyse a quality control solution of known concentration. Two recruits Anna and David were asked to analyse batches of test samples that also contained a quality control solution with a known concentration. The results recorded were:
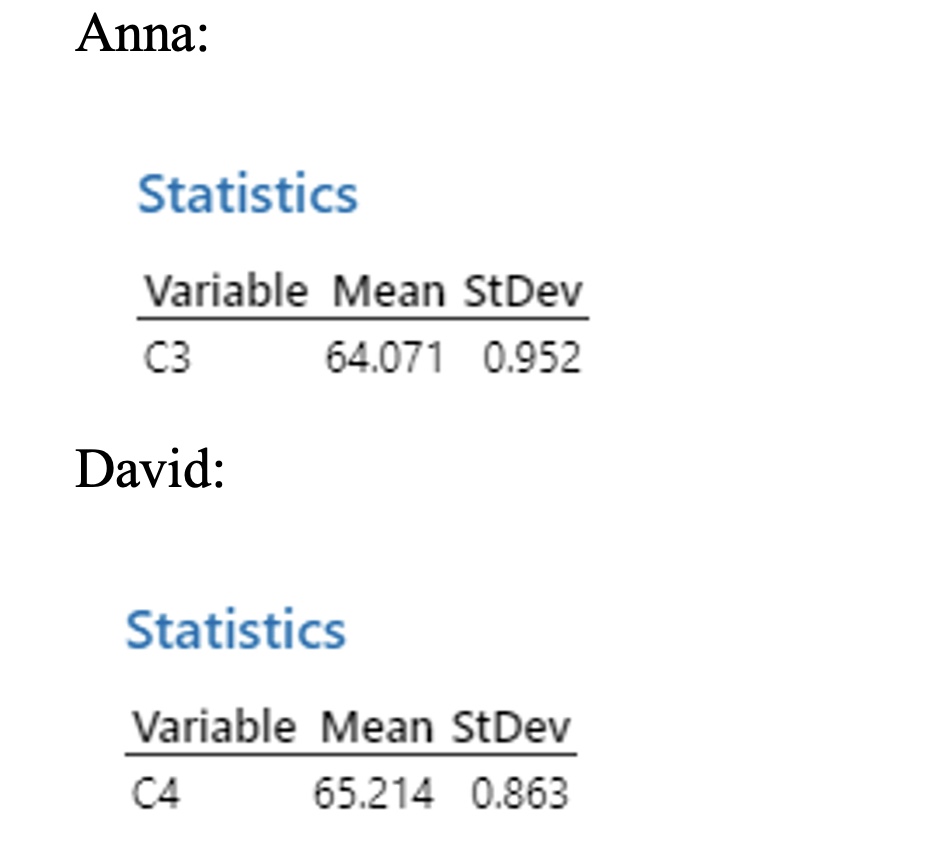
a) the mean, standard deviation of the population and standard uncertainty of each set of results.
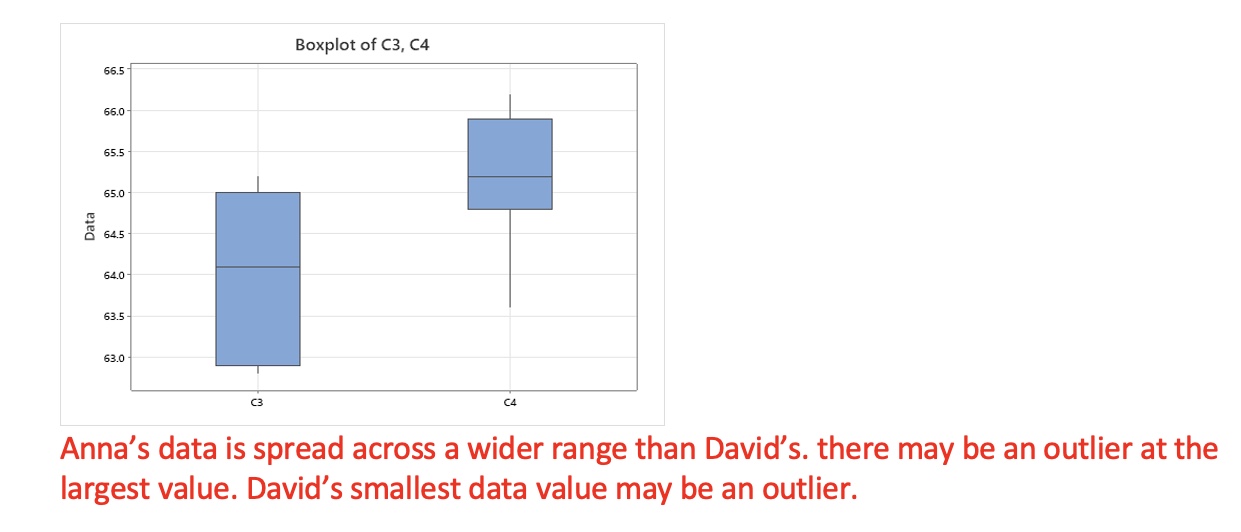
b) Plot the results produced by each analyst. Are there any suspect points?
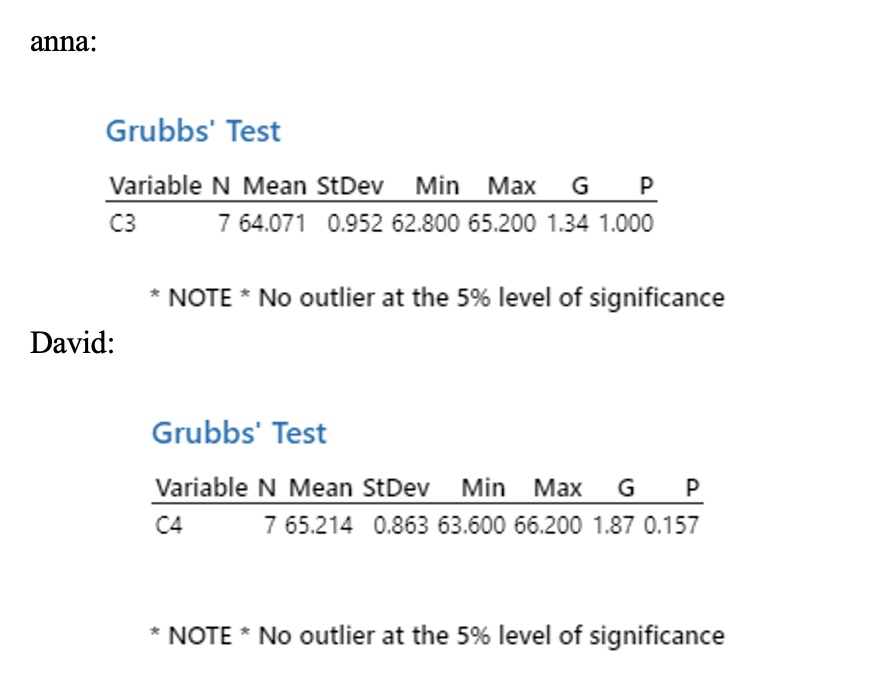
c) Carry out a Grubbs test on each set of results and determine if there are any outliers.
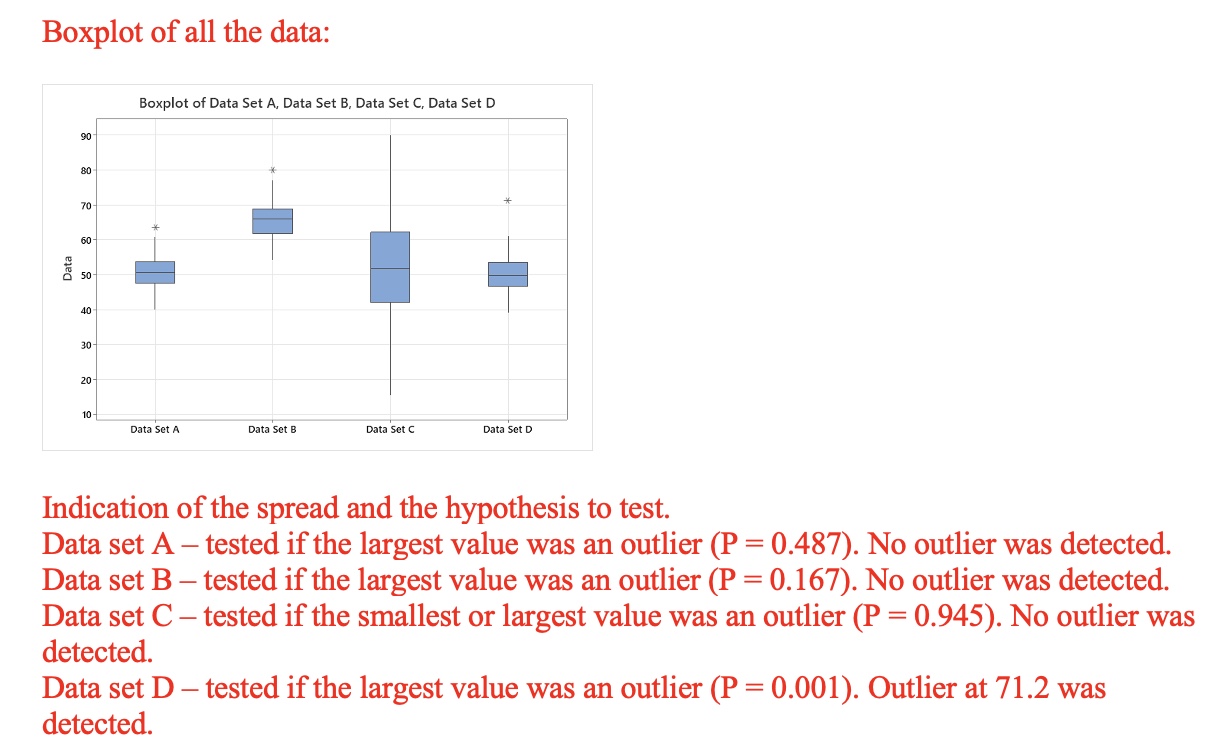
In all cases, no outlier was identified (P > 0.05) for Anna or David’s data. Outlier tests assessed the following:
· Smallest or largest data value is an outlier (Anna and David)
· Smallest data value is an outlier (David)
· Largest data value is an outlier (Anna)
3. For Data Sets A – D in the Minitab Worksheet for Task 1 determine if there are any outliers in these data sets at the p = 0.05 level.