Geography- Regenerating place
1/78
There's no tags or description
Looks like no tags are added yet.
Name | Mastery | Learn | Test | Matching | Spaced | Call with Kai |
|---|
No analytics yet
Send a link to your students to track their progress
79 Terms
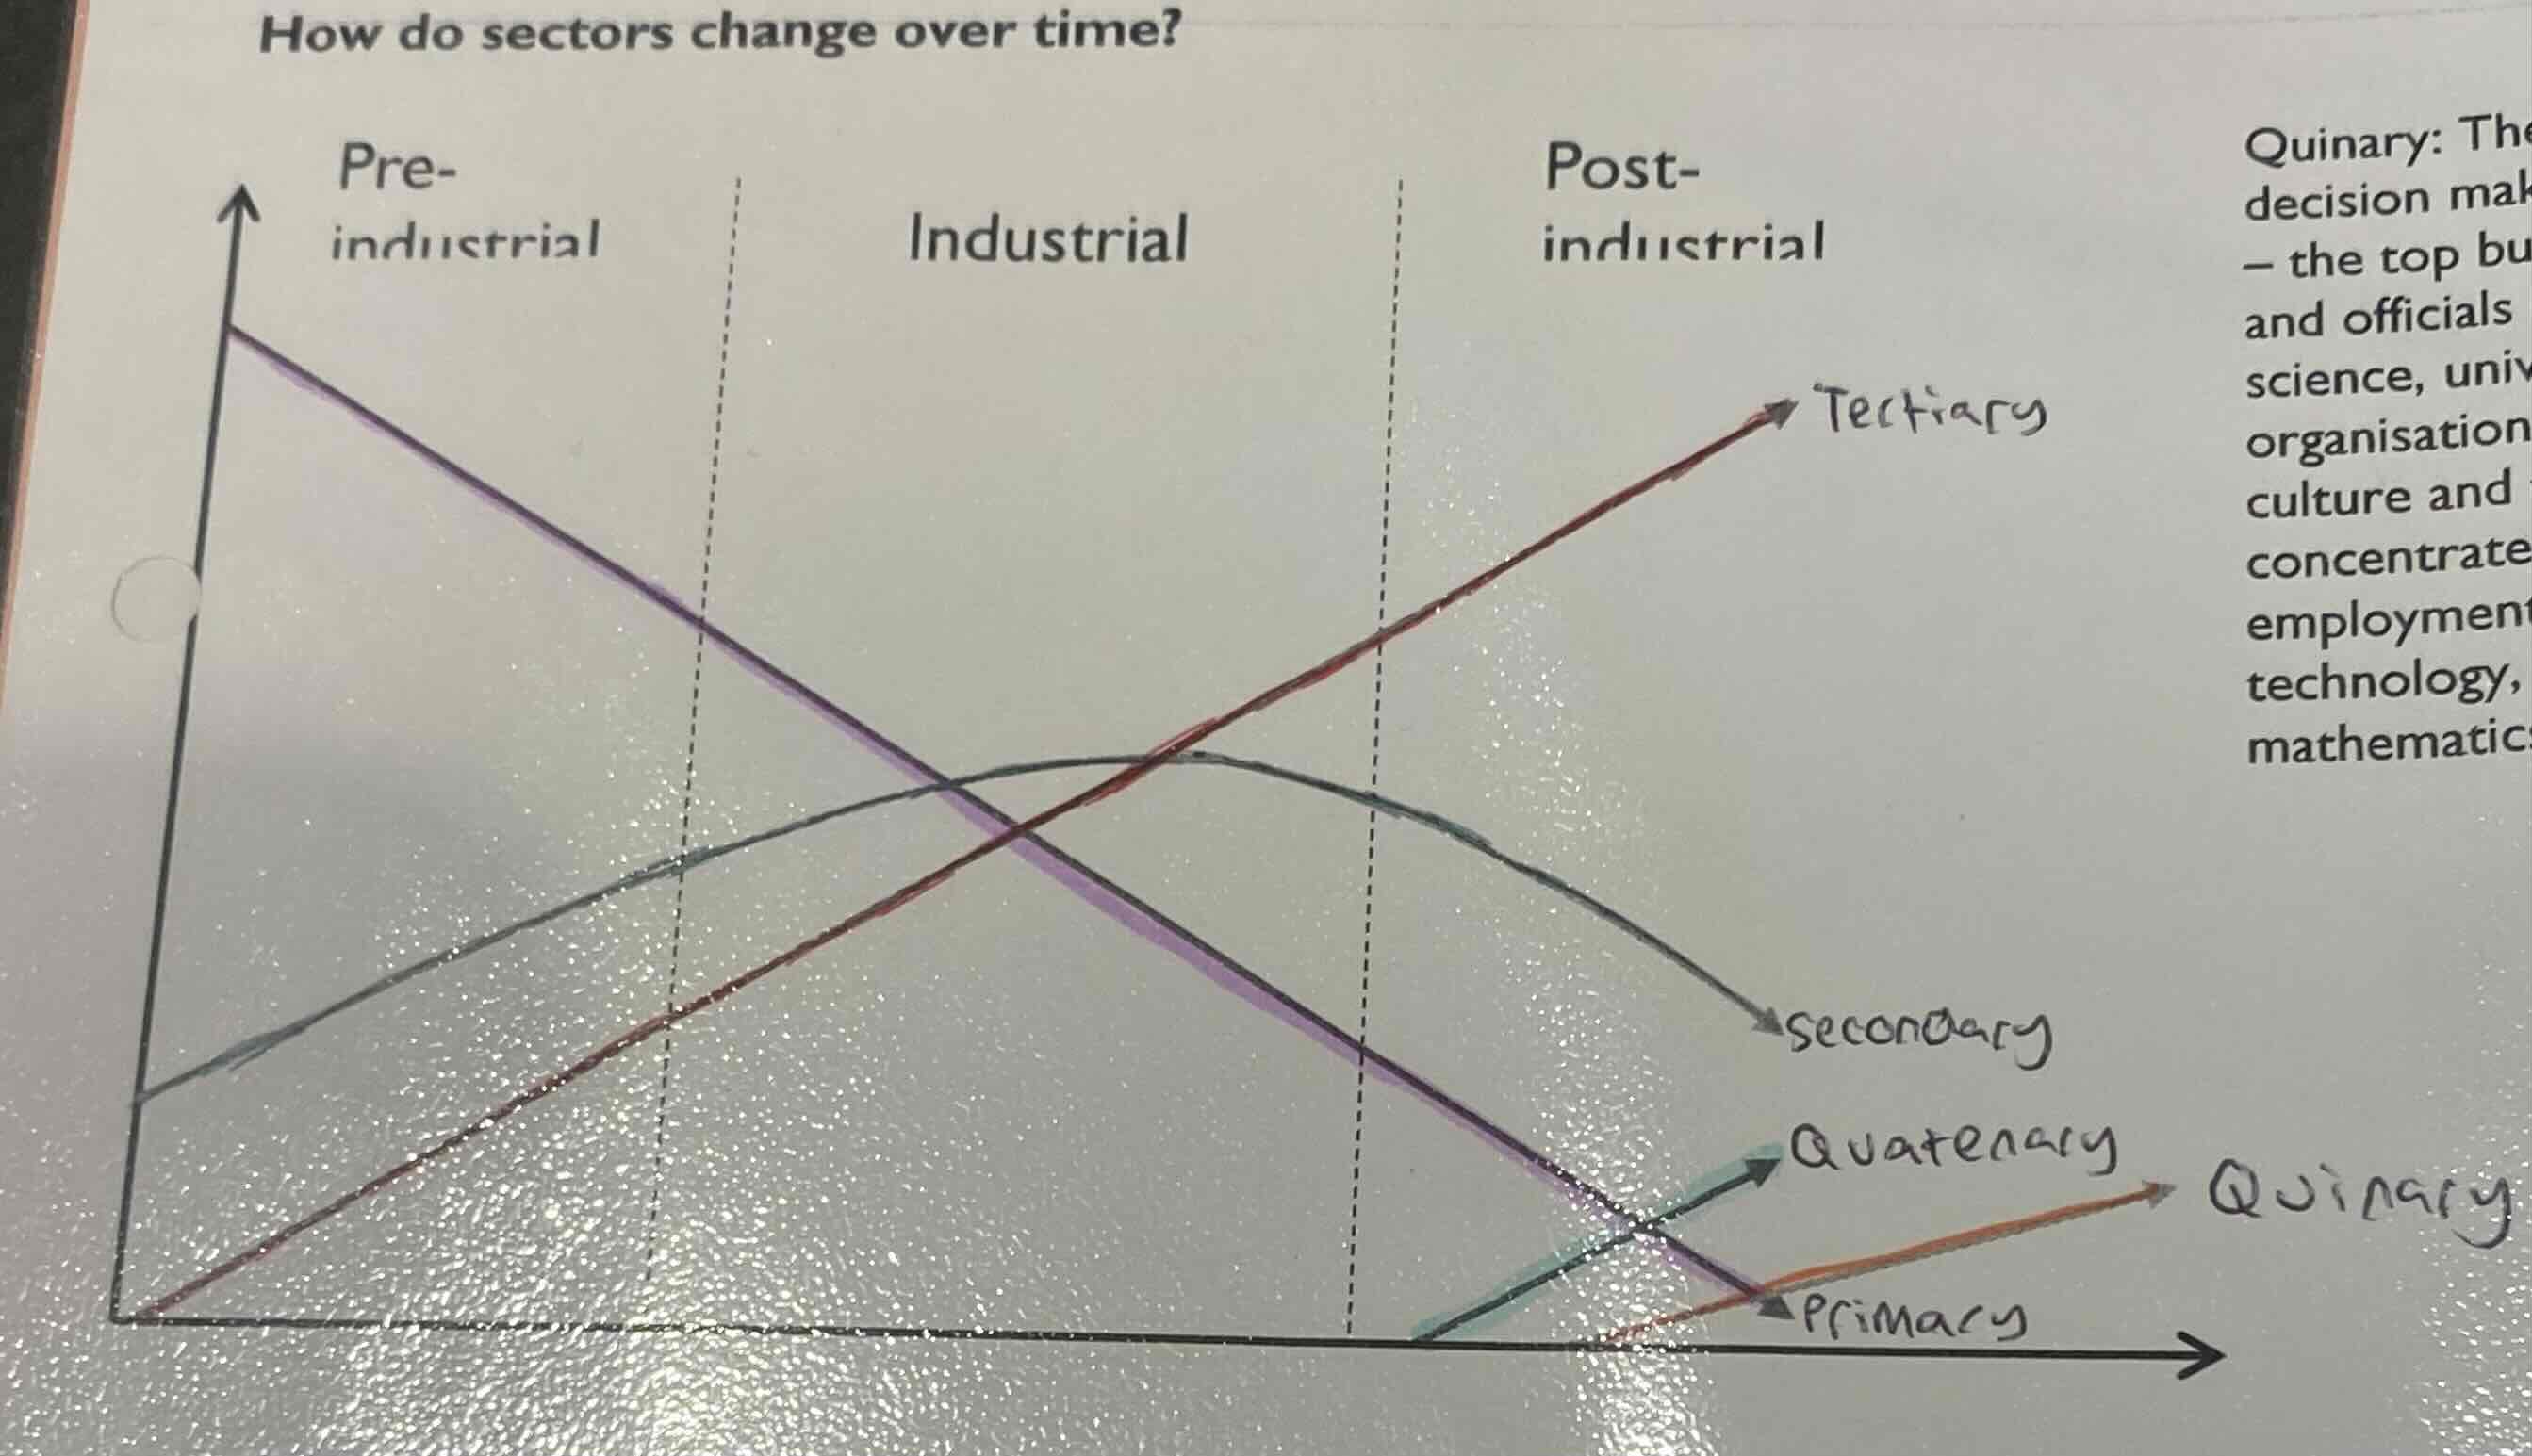
Classification of economic activity
Primary- Extraction of raw materials- rural UK
secondary- Manufacturing raw materials- Conurbations- Merseyside
Tertiary- Service sector- All UK
Quaternary- Research + design- Large well connected cities e.g. London, M4 corridor
Quinary- Knowledge management- London, large cities
How do sectors change over time
Regeneration definition
Improve place or system to make it more successful + active, it is a long term process to reverse decline through bespoke solutions that create lasting improvements for the community, economy and environment through sustainable redevelopment.
Sustainability definition
Meeting needs of current generation without compromising the needs of futures generations
Regeneration, Rebranding, Reimaging definitaon
Regeneration- place making- long term upgrading- connected to rebranding
Rebranding- place marketing- new look/ reputation, involves reimaging area
Reimaging- making a place more attractive + desirable to live + invest in
Spearman Rank Correlation Coefficient (equation)
used to discover the strength of a link between 2 data sets
R= rank
d²= difference between two ranks ( then square the it)
n= number of data sets e.g. number of places
n³= cube n
1= strong positive correlation
0= weak correlation
Spearman Rank Significance table
to test the significant of the rank the R value must be tested
Work out degree of freedom- number of pairs -2 (n-2) this number is your df- find it on the table
If your R value is greater than the a= 0.05 ( critical value) value then you can be sure that the results are 95% reliable
If your R value is greater than the a= 0.01 (critical value ) value then you can be sure the results are 99% reliable
The link between economic activity and social indicators/ quality of the life indices
Even in the UK there are tremendous inequalities in level of pay and types of work
How can economic activity be measured
can be measured by employment and output data (locations quotients, gross domestic products + gross value added)
What is location quotient
a mapable ratio which helps shows specialisation in any date distribution being studied. A figure equal to or close to 1.00 suggests national and local patterns are similar with no particular specialisation, such as retailing. LQs over one show a concentration of that type of employment locally
Gross domestic product definition
is the broadest quantitive measure of nation’s total economic activity. More specifically GDP represents the monetary value of all goods and services produced within a nation’s geographic borders over a specified period of time.
Gross value added defintion
Measures the contribution of the economy of each individual producer, industry or sector. It is used in calculating GDP
Variation in average salaries in UK
Greater in cities than in rural areas
London- average weekly salary= £851
Dover- average weekly salary= £608
N/S divide- London= £851 vs Manchester= £610
Variation in industry in UK
primary= very small + mainly in rural areas e.g. Wales 9% (no primary in areas around cities
also small amounts of secondary as it is cheaper to import in from overseas (food manufacturing= highest in rural areas but still low)
tertiary= more jobs, food + beverages= high in Scarborough (7%) and 7.1% in central London
main sectors= quaternary + quinary= tend to be closer to cities
Is their a correlation between high income + employment type?
Low + high examples
high income areas tend to be working higher income jobs e.g. London weekly salary= £851 and 10% of people working in legal + accounting services over 16 in centre
Low income areas e.g. Rochdale (near Manchester)= av. weekly salary of £510 + there is more primary
reasons for link between economic activity/ income inequality + social indicators/ quality of life
People working in the primary sector and low level services receive lower pay than those in more skilled workforces
People working long hours in manual jobs or are exposed to harmful chemical will have higher risk of poor health and more mortality and lower life expectancy
Variations in income effect the qual of housing and diets (poorer diets normally mean poorer health)
Is there a correlation between high income + qual of life?
yes
London weekly salary= £851 + life expectancy= 80.7
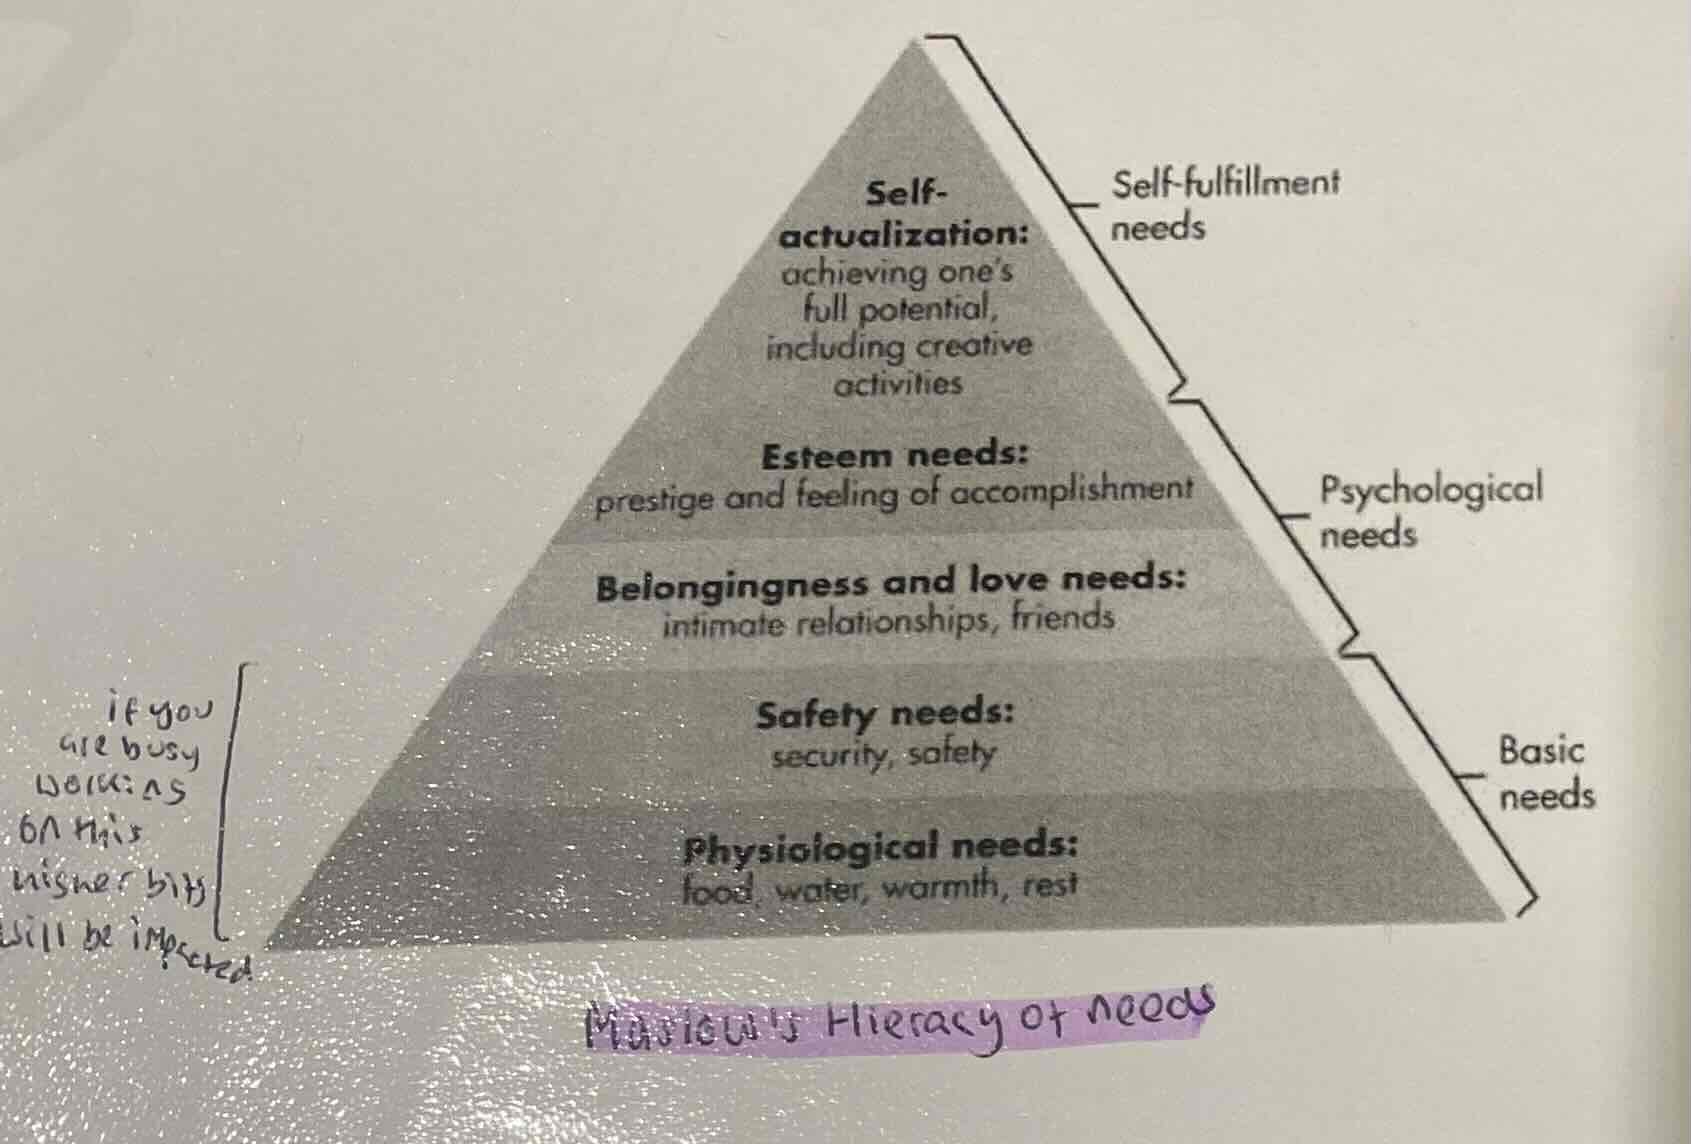
Is there a link between income deprivation and educational deprivation
use Maslow’s hierarchy of needs
income deprivation= no computer for school work
lack of home stability= gap when starting school which is hard to close/ can widen
don’t have money for transport to school
Parents who work low paid, low skilled jobs may not prioritise education for their kids- need help with fam income
How has Manchester’s function and characteristics changed over time
Greater Manchester is metropolitan county in NW England. Pop= 2.8m.
17th century= wool + cotton industry + centre of industrial revolution
1894- Manchester ship canal opened- peak = 75,000 employees - Britain’s 3rd busiest port
Dock closure in 1982= Loss of 50,000 full time jobs- 17.5% of pop
Present function= Capital of North
Super output areas(SOA) + Lower super output areas (LSOA) pop + household figures
LSOA- min pop= 1,000 max= 3,000 min nu. of households= 400 max= 1,200
SOA- min pop= 5,000 max= 15,000 min households= 2,000 max= 6,000
Formal vs informal representation of a place
Formal- Gov data, local council, tourist boards
Informal- Social media, Trip advisor, newpapers
How have regional, national, international, global influences shaped Manchester
Hulme/Moss side- Regional- District centre local plan with community + local council to create attractive residential area, improve connectivity, school healthcare over next 15 yrs
Opportunities- improve communities facilities, attract investment, pride
Threats- Funding, Gentrification
Enterprise zone= National, international, global- Boost business + private sector near Manchester airport + business rate discounts offered
Opportunities- Business growth- tax + economy with thrive
Threats- Long term project, increased competition for local business, gentrification
Manchester City FC- Regional + global- Transform E Manchester into global sporting capital, Connell Sixth form, offices, hotels
Opps-Jobs for deprived area= improved health + education
Threats- Gentrification, jobs for non locals, gentrification
Northern Powerhouse- regional, national- Boost economy by linking N cities (e.g. HS2)
Job creation, investment, interconnected economy
Other regions left behind, HS2 stopped before N, Very long timescale- decades
How have regional, national, international, global influences shaped Scarborough
Scarborugh’s New market- Regional, national- Local council + Hull Uni project, online market as well, 2.7m grant from Big Lottery Fund
Boost small businesses, tourism + more diverse local economy
Gentrification, Push old businesses out
Coventry Uni campus-Regional, national- New campus, education + sport facilities
Increased skilled pop, tax improvement, prevents brain drain
studentification
Europeans Investment bank- International- 20,000 affordable homes nation wide- some in Scarborough, alleviate affordable housing shortage
Jobs in construction (temporary), prevent gentrification??
Long time to build, develop, expensive, pressure on services
McCain factory- Global- 100m investment in a modernised factory, using waste gas to generate electricity + run by Canadian TNC
Long term jobs in factory, jobs in construction (temporary)
Low skilled jobs, Mechanisation- fewer jobs
Evaluate the relative importance of national and international influences in shaping the economies and social characteristics of 2 contrasting places (20 marker)
need to use specific detailed evidence of characteristics of each place and link this to influences
make sure to link every point back to the question
Historic function Manchester vs Scarborough
Manchester
17th century- wool + cotton- thousands of jobs, centre of industrial revolution but extreme wealth gap
1894 ship canal opened- 75000 people employed out of 220,000 pop
3rd busiest port in Britain until closure 1982- = Loss of 50,000 full time jobs- 17.5% of pop
Scarborough
12th century- castle built- one of the greatest royal fortresses- Henry iii
17th century, medicinal water found- 18th century- spa town (tourism)
flourished into spa town, seaside resort, fishing port, shipbuilding industry
Down to location-
Man- port no coast (industrial history)
Scarborough- coastal (tourism history)
Changes in function Manchester vs Scarborough
Manchester
Manchester= first western Europe boomtown after WW2
1960s emerging economies e.g. Japan, Taiwan- unemployment + deprivation in Manchester
1971-1981- Man loss of 50,000 jobs + 17.5% of pop
reurbanisation- 84% increase in city centre jobs 1998-2015
Scarborough
16th century due to stable reign, no war no need for castle
1845- Scarborough York railways system= increased visitors
middle of 19th century- shipbuilding decline- foreign competition + fall of British empire
2000s cheap flights abroad- detrimental to British tourist industry
Present function Manchester vs Scarborough
Manchester
UK’s second largest city- capital of north
Manc Piccadilly- busiest train station other than London in England
2021- pop= 586,100
Scarborough
large fishing industry, largest industry= services + accommodation
factories e.g. McCain’s
no diverse economy- one major event and entire economy would collapse- relies on day + weekend trips
2021 pop= 108,700 (6x smaller than Man)
Physical factors Manchester vs Scarborough
Manchester
flat land- good for agriculture + infrastructure= more connected
Scarborough
NE England
Seaside- fishing, tourists
No major motorways leading to Scarborough
Peripheral (core being London)
Accesibility Manchester vs Scarborough
Manchester
proximity to other cities- within hour of Leeds, Liverpool, Sheffield
Airport= international
TNCs e.g. Etihad, Adidas- head offices in Manc
M60+ M6 connect Manchester with N + S
Scarborough
Not very accessible
Railway, 25 main bus routes that link to lager cities e.g. York, Leeds, Liverpool, Manchester (closest train to city= 40 mins to York)
Historical development Manchester vs Scarborough
Manchester
city centre pop- 2002-2015= grew 149%
1992- Metrolink built + trams started running
1996 bomb= prompt massive regeneration
Scarborough
Market hall opened 1852
1960s= seaside identity born as there was more wealthy middle class + cars which enabled transport to Scarborough
Local and National Planning Manchester vs Scarborough
Manchester
1987-moved towards urban entrepreneurialism
Maintained historical buildings but increasing demand for business + resident space= reduce of green belt
1970= planning = nothing higher than Victorian buildings but 1990s overturned to usher investment
Scarborough
McCain foods will invest £100m in expanding Scarborough factory= employment
Some of 20000 new houses- European investment bank
2035, Scarborough is set to refocus on digital + creative industries
Age structure Manchester vs Scarborough
Manchester
Median age of city of Manchester= 31- lowest in NW
40,000 student pop
Scarborough
More elderly dependents- median age = 50 (UK median= 40)
31.3% of residents= over 60
Ethnic Composition Manchester vs Scarborough
Manchester
57% white, 21% Asian
52% increase in ethnic diversity 2011-2021
Scarborough
97% white, 1.3% Asian
Deprivation levels overall Manchester vs Scarborough
Manchester
many areas of MCR consist of area in the most deprived decile
investment in city= larger gap in deprivation
25,000 kids growing up in severe poverty
Scarborough
Scarborough is most deprived district in N Yorkshire (les than MCR)
Differences in deprivation levels within local authority Manchester vs Scarborough
Manchester
Rochdale, Oldham, Bolton- most deprived
Trafford, Stockport are least
Manchester city ranked 7th whereas Trafford 214th in income deprivation effecting children
Scarborough
Areas of deprivation- Old town + along coast
Mean salary 2016- 19,925= below national average
Reasons for deprivation Manchester vs Scarborough
Manchester
lack of employment- high skilled jobs not accessible for deprived areas
Scarborough
lack of employment due to lack of connectedness + investment
Regenerating rural places examples
Visitor centre
2.6m pound for sustainable visitor centre- finished easter 2007
aimed to attract 15,000 visitors a year
Generated 9.3 million pounds in visitor spends
Attempt to increase dwell time (length people stay)
Dixons Hollow + Adderstone Field
Chosen location for mountain biking world cup 2010 (short term success- long term?)
Built 5.5km of bike trails + 3 acre skills park
Consulted local community + built with local materials that can be used all year around ( increase dwell time)
Cost 450,000
Adderstone field- used for live events- began 2001
Explain how international + global influences shaped the social characteristics of local place (6)
Break down Qu
Explain= give a reason
link with another country vs world connections
social= people
local place = MCR
need 3 well developed PEE paras
link to education levels, ethnicity, deprivation, life expectancy
Points:
Airport= immigrants= change ethnic composition + working age also brings in International students = looking for high skilled jobs- increase education levels= = diverse ethnic composition - 52% increase 2011- 2021
Canal was global connection but ships = too big= deindustrialisation= loss of jobs= increased deprivation- 50,000 jobs lossed + 17.5% of pop
Etihad- building another footy stadium to attempt to attract global sport
Windrush- commonwealth countries- immigrants post war to rebuild
M4 corridor- successful region
County of Berkshire- SE England
2001-2011 census= pop rise of 6.4%
high rates of employment
Well qualified work force. It was expected to need 70,000 more well qualified workers by 2020.
Thriving Business in the area due to proximity to Heathrow airport, M4, good schools + train lines.
2015 the price of a 6 bedroom house was exceeding 2m - these prices are out of reach for 20% of the working age pop
Benefits
low pollution
attractive, quiet environment
well connected
costs
aging pop
expensive housing
Declining town case study
Middlesborough
declining= consequence of deindustrialisation
10% of areas is in bottom 1% of deprived areas in England
Landlords buy properties and rent them out without upkeeping standards
high anti social behaviour + dumped waste= a health problem- cost of fly tipping= 10% increase each year
Continued spiral of social and economic decline
benefits
well connected urban area
possible more affordable housing
costs
higher levels of deprivation
deindustrialisation
crime, pollution, poor health
Establishing master plan for regeneration
masterplan= report that identifies how an entire county, region or group of cities may be regenerated in order to meet for than one priority for the area- they often help shape policy and result in a range of regeneration schemes being undertaken
establish socio-economic + environmental context for regeneration- judging inequality
initial masterplan- involving locals views
Get stakeholder input for evaluation report
Implement and evaluate projects success
Key problems experienced in rural communities in UK
-affordable housing- 2007- average rural house cost 6.8x more average annual rural household income
-Aging pop- cannot downsize due to housing prices
-Overcrowding- big fam in one small house due to prices= poor living quality
-tackling homelessness + hidden homeless in overcrowded living conditions
PRIORITIES ARE:
BUILD AFFORDABLE HOUSING (this effects the others)
Support services such as schools to attract young people + families
create diversity in employment sectors
prevent rural homelessness + an isolated ageing pop.
Areas facing these problems are less likely to see any investment (this depends on the area some rural areas see a lot of investment) and are neglected by gov due to urban slant where gov doesn’t see problems faced in countryside as serious as ones seen in cities
Key problems seen in urban communities in UK
-poorest are often pushed to live in degrading environments- few services, less access to public transport, jobs, education, green space this leads to cycle of poverty and families are forced to stay as they don’t have the money to move
PRIORITIES ARE:
access to services- lack of= reinforce poverty + inequality eg each year1.4m people miss, turn down medical help because of transport problems
Housing- poorly insulated housing (council) = housing cost induced poverty- 9% of UK cant afford to heat living areas in home + 10% live in a damp house- this can effect kid development + opps in later life
Transport- disadvantaged people= less mobile + more reliant on public transport- less location flexibility in seeking jobs due to expensive public transport
Health- social gradient in health- poorest= most time in ill health + die earlier due to being exposed to environmental conditions which negatively affect health.
Urban sinks- URBAN
social housing estates characterised by high levels of economic and social deprivation- ironically council housing was meant to improve living conditions.
PRIORITIES
improver living conditions
need to be community built projects
accessibility to services, healthcare + jobs needs to be improved
example- Barrack- Glasgow
NOT ALL RUNDOWN ESTATES ARE SINKS
Gated communities- URBAN
communities with controlled entrances + closed perimeters- found in settlements where wealthier residents have secure buildings and gentrification occurs on the inside and not to the locals on the outside
PRIORITIESlots of gated comms are targets of crime so there is a need to create a sense of community inside and out to stop the separation
Spread affluence + investment from not just inside the gates
example- London redeveloped docklands
Commuter villages- RURAL
-residents work in nearby urban areas but live in connected rural areas
PRORTIES
business closures due to commuters not spending money in the area
no sense of community + possible rivalry due to increased house prices, pollution ect
an effort needs to be made to create a community spirit
example- wealth corridor of Itchen Valley- Winchester
Declining rural settlements- RURAL
-experiencing loss of services/ declining pop- leaves aging pop as working class move to find jobs
PRIORITIES
investment into services + functions to attract affluent economically active people
example- Powys ,Wales
Suggest 1 reason why there is a positive correlation between income + levels of education attainment (3)
income is needed to fund necessities to make education accessible
Catchment area for good school= high housing prices- if you cant afford this you will have to live further out and travel in
the transport can be too expensive for lower income families and therefore the cant send their child to school + their level of education will be lower
higher income families able to afford things like private tutors, computer programmes to help with child’s learning
boost levels of education of children living there
lower income families may not be able to spend money on extra resources so education levels maybe lower
another point maybe higher income children= no need for part time job so more time to spend on studies
Answering 6 makers + example- Belfast change in function
3x PEE- make sure your answer is structured well
make sure to state your reason at the start of each paragraph
make sure you know what you want to say at the start- example:
BELFAST CHANGE IN FUNCTION BETWEEN 1911-2009
-deindustrialisation
-economic diversification- tertiary industry + uses of educated workforce
- heritage diversification- Titanic- tourism
-Regeneration
-local/national planning
-physical factors
look in folder for full written examples
How do social and economic changes in Man vs Scarb impact peoples identity
Manchester- you know the changes
Impact on identity
employment change=different people attracted
international investment attract international workforce + increases ethnic diversity
multiculturalism, cultural enrichment, ethnic enclaves
increase inequality= increase in affluency background of people
people become more accepting as diversity increases
Scarborough
regional influence e.g. council
limited ethnic diversity
slower pop growth
mixed levels of deprivation
Impact on identity
low ethnic diversity- less tolerance to difference
Variation in affluence- high end tourism attract affluent people but also high levels of deprivation
Mainly regional influence= strong community but may feel left behind from development
How can regeneration cause conflict in communities about priorities + stratergies
Gorton feels left behind and aren’t benefiting from economic growth of Manchester as a whole- rundown housing, no sense of community, litter but there is some regeneration e.g. restoration of Monastery into conference centre
PRIORITIES- affordable, cost effective not rundown housing, community led regeneration programmes, open community space, community building, make it feel more connected to Manchester with developed cheap housing.
other people of Manchester may think that regeneration should only be focused in city centre as this is what will attract more affluent people and have the best impact on economy
a persons lived experience massively effect their views on regeneration
reasons for conflicting views about regeneration
-Age (lived experience+ sentiment of area), length of stay(transient pop e.g students), money(inequality breeds resentment), engagement (especially political, top down schemes= not representative of needs), Studentification- have a go at expanding these
-there will always be conflict- it is how the gov deals with it and adapts to fit all the needs that matters
-make sure when writing about different groups to be specific when identifying the groups don’t just say some people think…
Greater Manchester spatial framework
-plan to provide new land for jobs + homes across city region by 2035
Timperley Wedge- 2,400 homes + 60,000m² employment space
for= new home buyers- connections to airport + 30% affordable +expanding business owners
against- locals: traffic, if they rent prices may increase due to demand + environmentalists- may extend onto green belt
City centre- 50,000 new homes + 1.5million m² office space
for= young professionals- access to city centre jobs + business owners- larger pop= larger revenue and they have the space to expand
against= existing residents- overcrowding + elderly pop- pop will massively increase- disturb quiet life
Are there variations in levels of engagement in local communities
How does political engagement vary in UK
high turnout in S + low in N Ireland + Durham
however the population view of turnout may just show high population not higher turnout
Example of high level of community engagement- Grampound village shop owners retired making it a 6mile trip to shop so the community opened a new store in the village with money from a grant and community share
Low level community engagement- local shop owner had to sell shop and house due to opening of Tesco + nobody supported his business
community engagement varies due to lived experience + attachment to a place (length of residence)
deprivation+ engagement link
may feel switched off from gov like they aren’t represented but this isn’t the only thing that influences engagement
What data can evaluate need for regeneration in Manchester
Manchester= 32 wards made up off lots of LSOAs
QUALATIVTIVE
-surveys of locals, media portrays, discussion rooms
(help get local views of need for regeneration)
QUANTATIVE
-Index of Multiple Deprivation, census data (less likely to contain bias + comparative)
use both= best to find needs for regeneration
Examples of Qualitative and quantitive data assess need for regeneration in places of Manchester
Gorton- CCR- in top 1% of most deprived areas in England "(2015) + Guardian- forgotten neighbourhood
Sharston- CCR- in top 1% of most deprived areas in England (2015) + MEN- “I live here- very bad”
Ancoats- CCR- in top 1% of most deprived areas in England "(2015) BUT MEN- “goodbye to old council estate”- suggest a recent effort for investment
What role does UK gov play in Regeneration decisions- Infrastructure Investment
Man Airport City
Enterprise zone- connect sites close to airport to airport= spring board for private sector growth + then wider regeneration. P= new growth, employment, trade, investment. N= traffic, push out local business
HS2
=effort to reverse gov transport policies since 1945 of being in favour of road networks, 2013- 35m registered road vehicles (one of most congested roads in Europe)- worst= big city connections to each other. Significant reduction due to funding + scrapped in 2023. Phase 1- London- Birmingham was completed but connections to Manchester + Leeds= scrapped ( so it has failed to full connect N + S major cities
- infrastructure spending in London= £2600 per person compared to £5 per person in NE
What role does UK gov play in Regeneration decisions- Planning Decisions
House building target
-increase in BR, divorce, immigration, oversea investors(buy properties as safe investment and don’t live in them - Oligarch)= pop rise= demand for housing so Gov make target to reach by 2020 to battle this e.g. Kent= 15000 new homes
Housing Affordability
-since 1980s council housing scheme has been lost due to the right to buy so there is a lack of suitable properties for low income
-developing areas= increase in rent/price and low income people cant afford
Permission for fracking
- gov was attracted by perceived bens of fracking as it could reduce need for imported gas supply to UK (increase energy security) but it was damaging landscapes so the gov made the decision to stop
What role does UK gov play in Regeneration decisions- Gov Policies
Financial Degradation
- decision made by Margret Thatcher’s conservative gov in 1986
-Instead of London stock exchange having all shares now bank, finical advisor, individual can trade shares- freedom to invest
-Barriers stopping oversea financial institutions from investing in UK was removed and they don’t have to seek UK gov approval to invest- now Bank, finance, business sector accounts for 30% of UK GDP compared to 15.5% in 1986
Migration Policy
- UK joined EU single market in 1992 allowing any member seeking work to enter UK and vise versa
- this has helped balance UK aging pop through increased tax revenue and has helped economy expand through expansion of available labour market
Factors that effect regeneration policy
funding
where skill gaps are
inequality
investment
How has oxford Uni worked with local gov to attract investment into the area
Oxford + Begbroke science park
Uni starting to take much larger role in local decision making and 2 science parks have been built on outskirts of city
In 2014, funding grander for Begbroke to encourage high tech, aerospace + medical engineering + computer robotics
Oxford SP hosts many bioscience + computer hard/software companies
Return on investment created new £500m shopping centre + 2nd railway line to London
housing price is also trying to be cut to attract more world leading academics
Using specific interest groups explain how interest groups have had key role in regeneration decision making in Aylesbury
-Aylesbury Vale district council led Waterside redevelopment project
Environmental Agency delayed dev because of contamination of the land
Local restaurant owners in town resisted plans for more restaurants and shops to open
Aylesbury society campaigned to preserve some on towns historic buildings e.g. court buildings- local council agreed to convert them into hotels + restaurants
tension=
new +old businesses- competition
District council + environment agency
District council + campaign groups
Manchester example of local gov role in regeneration
GMLEP (Great Man Local enterprise Partnership)- connects local gov to business, education institutes, public, private, voluntary, community sectors
extra 56m into already 276.6m growth deal for GM- which was given to Andy Burnham- major who decides what to do with it e.g. ourpass
growth deals are about locals based investment to drive local economy money is put into regions transport or skill dev programmes- things that matter to people and business of GM
Election of Manchester major shows that local and national gov can work together to help invest in local priorities
Regeneration in Alti
Main group= local gov- already spent £3m on improving town centre footpaths, streets, parking and another £3m is going to spent in a second phase
Public realm improvement also play huge part in Transport being easier to other parts of GM e.g. Interchange as this connection keeps town thriving
Other Regeneration projects
Clay lanes estate was a housing cooperative built 1977 for vulnerable single people in Newham, London but was assigned the Olympic village in 2012 and 430 residents were forced to move as well as local businesses- this had huge public opposition
Declining coastal communities tend to get special attention from gov as they have high levels of deprivation mainly due to tourism sector decline. some resorts e.g. Bournemouth, Devon have reinvented themselves by diversifying into business and conference hubs whilst holding onto family holiday image.
Powys- An integrated economic and community regeneration in rural areas funded by Welsh gov and EU + is key source of funding for deprived rural areas and promotes grassroot, community led rural dev
How can rebranding/ reimaging make urban/rural places more attractive to potential investors + visitors (urban + rural examples)
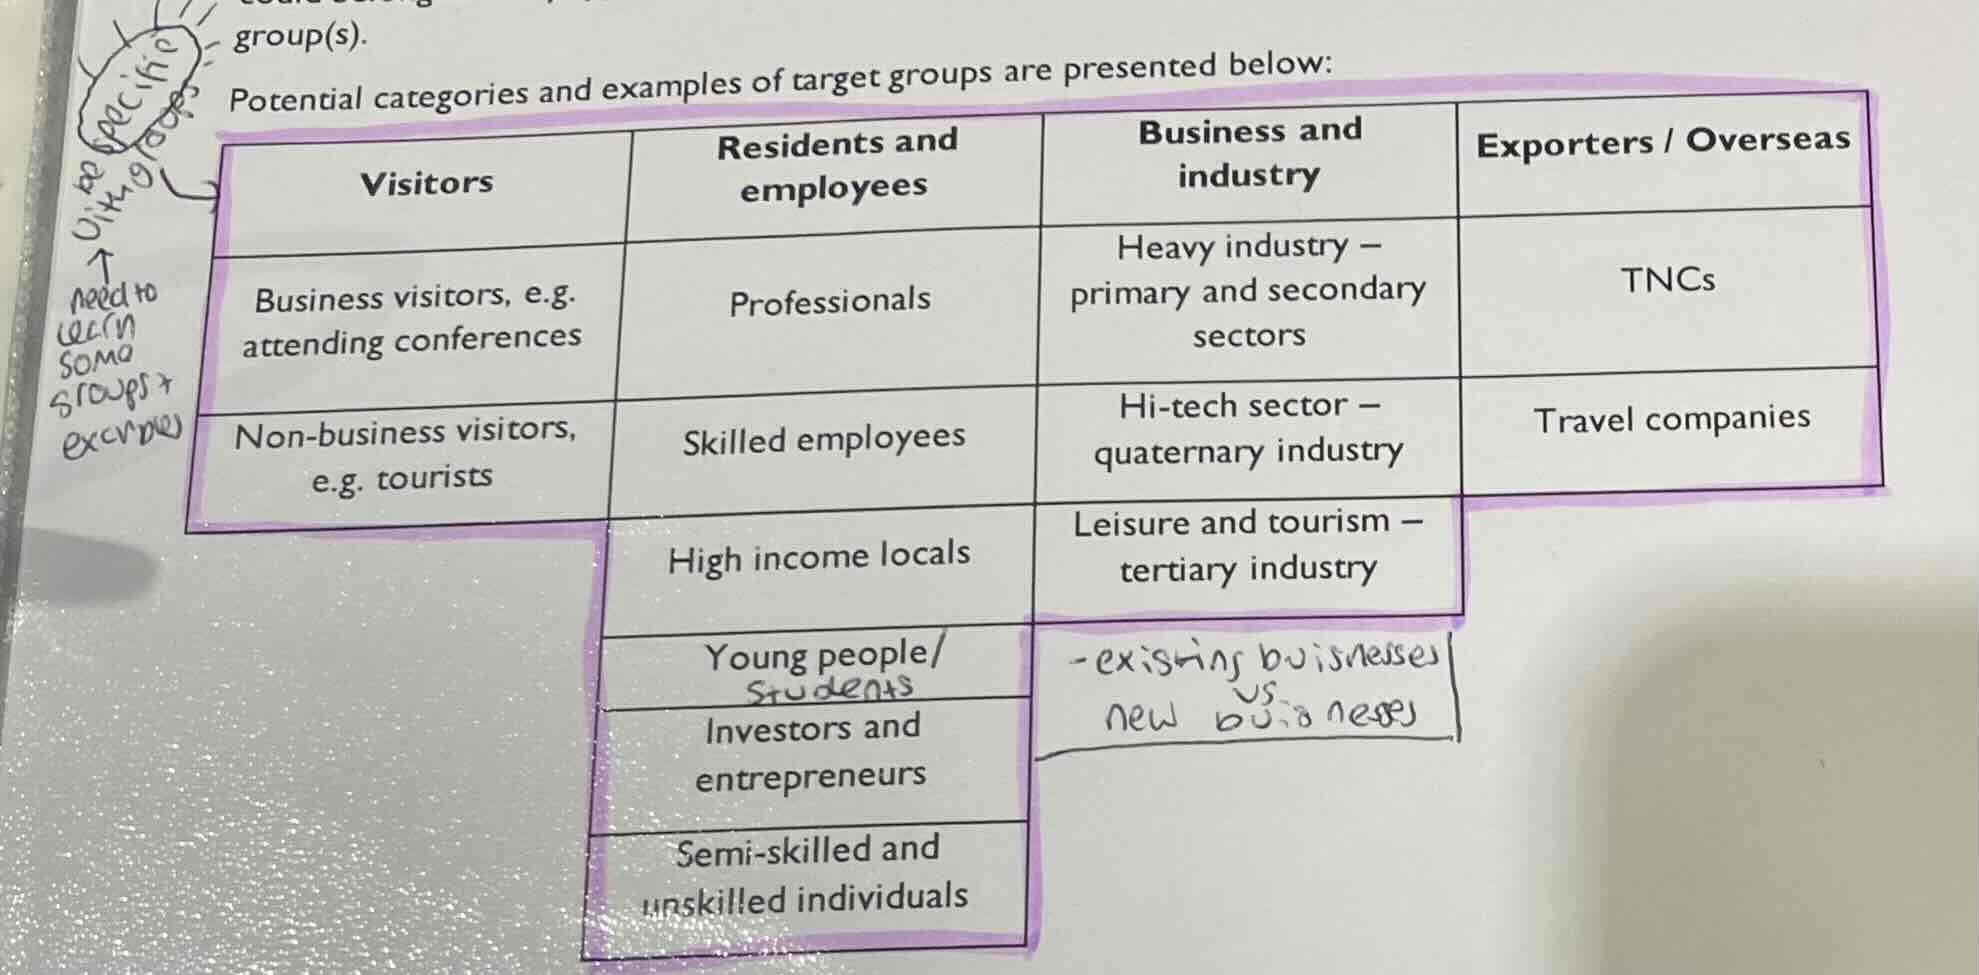
Regeneration, rebranding, reimaging tend to target specific groups but it is very unlikely that a scheme targets all groups, tends to focus on one or two key group identified in masterplan
Urban rebranding strategies in UK
Art + culture, Northern Quarter
Themed cultural events- Manchester Pride
Tech and science- Cambridge science park
Encourage reurbanisation- Mills Man to offices
Innovative architecture- Shard
sport- Manchester Stadium for Commonwealths
Leisure + tourism, Improving transport links, increasing visitor numbers
Rural rebranding strategies
Diversification
Alternative agricultural product, livestock e.g. Llamas, Crops e.g. flowers, processed food product e.g. ice-cream
Non agriculture businesses e.g. campsites
Outdoor activities, Dalby forest- go ape, mountain biking
Heritage + liberty associations
food + drink- food festivals
Literary links- book festivals
Heritage properties- Tatton park
How to measure success of regeneration
Economic- income, employment
Social- reduction in inequality, deprivation
Environment- reduction in pollution levels, derelict land
Urban rebranding/ reimaging titanic quarter Belfast
Titanic Quarter- Belfast
-Deindustrialisation of shipyard = left polluted (from years of industrial pollution from ships)+ derelict
-Large scale waterfront regeneration- apartments, film studio, historic landmarks + Titanic Belfast visitor centre cost 97m, over 618m invested already
-Players: Tertiary industry, High income locals (new accommodation), investors + entrepreneurs (investment opps), professionals, existing business
-Successes: attracts over 3.6 visitors each year, attracted over 1000 inter/national companies creating over 6000 jobs since 2006
-Limits: Gentrification- house price + displacement of working class residents
Urban rebranding/ reimaging factfile (altrincham)
Altrincham
-2010 it was named ghost town + had highest shop vacancy in UK (30%)- due to Competition (Trafford Centre) + online shopping + loss of unique identity
-2011 Trafford council made Alti a priority and “modern Market town“ plan was put in place
objectives= increase footfall, dwell time + spend
vision= Unique, attractive, vibrant market town and regain unique identity= more investment
-Players: Existing residents (increased connections, healthcare +improved public realm) , Independent sector- loan schemes + £900,000 new market= attract visitors= more revenue
-Success- vacancy levels down 75%, 10,000 people per week visit Market house, engaged all sectors (business ,transport, community)
-Limits- Prices of product, services increased- hard for locals, big chains have opened and compete with the small business the investment is trying to promote.
OTHERS: Could talk about Aylesbury, Ancoats, Manchester, London Olympics, Liverpool
Rural rebranding/ reimaging factfile(cornwall)
Cornwall
-Periphery- lack off transport= movement of educated working class= brain drain. Lower wages- 2005 it had lowest week wage in Britain (329.30)- 25% Below UK average. Lack of rural services-People chose to leave or didn’t move there in the first place. Deindustrialization- decline in agriculture e.g. exhaustion of tin mines= negative multiplier effect= post production countryside (isolated + seasonal)
-Uni of Cornwall was made to attract graduates + business + reverse BD, Eden project (2001)- built on China clay quarry brownfield site and when first opened attracted 1.8m visitors + employed 400 full time staff( 75% whom were previously unemployed)
-Players: Private individuals- Rick Stein opened fish restaurant in a declining sea side town, Business- especially tourism. EU- helped boost economy, National Lottery- funded Eden Project= became destination tourism place + creation of objective 1 (matched funding to help new businesses)
-Success- Faster growth rate-in 2008, 80% of Eden project surrounding businesses believed it had helped their business. Boosted Economy, jobs, private investment + Eden project= positive multiplier effect to surrounding areas
Negatives-Rural location + limited infrastructure- unequipped for rapid influx of tourist- may cause future problem if revenue isn’t reinvested into infra. Environmental reputation- if sustainable + natural rebranding schema isn’t upheld it could cause conflict
Rural rebranding/ reimaging factfile (Dalby forest)
Dalby Forest
-Long history of human intervention in area- interwar years= timber production (clearing of woodland), damaging environment
-Plan includes felling, thinning, restocking to increase species diversity + habitats, 2.6m natural visitor centre, mountain bike trails (Dixons Hollow=location of World Cup for mountain biking 2010), go ape, live music, camping.
-Players: existing residents- jobs, volunteering, outdoor activities. Local council- business profits + revenue + increased investment, Environmental groups, Unemployed residents + tourists
-Success- Existing residents benefits (above), £1.1m refurbishments of surrounding village, 1.2m from European funding +1.45m from Yorkshire Forward = site of investment+ increasing inter/national role
Limits- expensive long term project with maintence, Expensive entry (possibly decreasing nu of visitors) £9 pp. revenue= seasonality
OTHERS- Fordhall Organic Farm (Shropshire), Bronte County West Yorkshire + East Lancashire Pennines in North England.
Timeline of national and local regeneration strategies at Salford Quays
Salford City Council, UK gov, Private sector
1960s-1981- Decline in Docks- containerisation, shift in trade patterns + bigger ships
1981- Docks= “enterprise zone” for 10yrs by national gov- planning laws relaxed, businesses expect from Land Tax and Council rates
1983- Docks purchased by Salford City council + UK Gov agreed to give “derelict lad + urban programme funding“ if property developers could secure private sector investment
1985- Plan created- reclamation/renovation of polluted water, landscape + careful controls on dev and implementation of future projects
1985-1995-secured £35m in funding from UK gov +EU
1988- Development strategy review identified need to dev Art centre (Lowry) + improve transport (Met)
1991-5- Regeneration masterplan made in consultation with stakeholders + plans for art centre were developed
1995- UK gov national lottery- partly fund art centre
1996- further UK gov funding was secured
2000- Lowry + Millennium footbridge opened
2001- Imperial War Museum (public financed) + Lowry outlet mall (private finance) opened
2010- Media city plans created- aim= 378 apartments, Met station, high tech studios for BBC
Why there has been less conflict than most regeneration project in Salford Quays ( and what is the main conflict issue)
-less tension than usual regeneration as nobody lived there so nobody got diplaced + all things that have been done have been improvements EXECPT for the rise in price + minimised spread effect to rest of Salford
Stakeholders + their likely opinions of the regeneration of Salford Quays
Land Owners- Peel holdings-
🙂 Increased land prices= more money
Conflict= residents-increased price= move= cut off from regeneration
Local Salford City Council-
🙂 Multiplier effect + gentrification= increased footfall + more taxes
Conflict- local businesses- business rates will increase
Pre-existing local businesses-
🙂 Increased footfall= increased revenue
☹ Increased business rate
Conflict- Landowners- Demand=rent increase + competition
Local residents- Ordsall Park residents-
☹ Cut off from Regeneration as focus Salford Quays not the needed residential areas around
Conflict- Local council- angry they are being cut off
Former Dock Employees-
🙂 New jobs after losing old ones
☹ Gentrification may push them of area
Conflict- Local residents- both fighting for the same jobs
Transport Planners-
🙂 Attraction to area= more usage= more money
Conflict-Local residents- transport= more expensive
Land owners- if they don’t sell= no new tram lines
Environmental activist/agencies-
🙂 Increased water qual + greener transport
☹ Green belt may be built onto
Local council- may sign off to extend onto green belt
successes of Salford Quays regeneration project
employment in creative, digital, tech sectors (high investment in these industries)- catalyst= BBC moving to Media City followed by Children in Need, Comic Relief
soon more than 50% of BBC radio 3+6 will be broadcasted from Salford ( improving peoples perceptions)
socio-economic benefits- new jobs= higher living standard- 23,000 jobs in Salford Quays since 2010- levels of economic activity generated in city grew by £2.5b (48% increase)
Multiplier- kick start investment= media city= BBC= jobs= movement of people= demand for services= tax increase= investment…
Media city is set to x2 in size following £1b investment (still be invested in)
water cleanliness- less polluted- rebranded to water sports whilst still keeping history of waterways
Limits of Salford Quays regeneration project
1/3 of Salford pop live in highly deprived areas
Spread effect= limited investment in Quays and not wider Salford + Salford’s people cant access the high skilled jobs + new housing
Stakeholders and their likely opinions on regeneration of Causeway coast (stakeholder, likely opinions, criteria of success, conflict with other SH)
Department of Environment N. Ireland
-In favour of taking poor environment
-If environment has be improved + is protected for long term
-TOURISTS- could damage the environment
National Trust
-In favour of restoring of restoring environment
-Conserve Historic buildings+ sustainable + increase in visitors= increase in profit
LOCALS- money doesn’t stay in area it goes back to corporation
Private Land Owners
-Favour of economic growth so land value increases
-If the schemes bring in profit
Conservationist- conflict over land use
Tourists
-More attractive= more tourists
-Good access to area+ facilities + affordable prices
-Most groups that care about environment + the locals
Conservationists
-in favour of conserving environment + heritage
-If heritage sights are kept + environment restored
-Private land owners who could get rid of heritage sights for profit builds
Local Council
-In favour of all regeneration as it = taxes + investment
-If schemes bring in more taxes
-?
Locals
-In favour IF the money stays in the area+ if they are involved in the planning process
-Jobs opps and Increased standard of living
-Tourists
What local + national strategies were employed in regeneration of Causeway Coast
Rural Diversification
-8.5m support rural businesses + creation of 20 new business projects + 40 new businesses
-P= less reliance of primary sector + economic diversification (less vulnerable to effects of recession), jobs created in Tertiary+economic growth
-N-Environmental damage, unequal investment= conflict and will it reach all needs?
New rural workspaces
-40 new enterprises + 40 micro enterprises focusing on social economy e.g. non profits, cooperatives
-P= new jobs + volunteering (community spirit) + reducing reliance on primary industry, seasonal work
-N= Doesn’t get used- wasted money
Tourism
-New activity based tourism, enhance local tourism amenities- signage, picnic areas, regional food tourism
-P=Economic growth + jobs in tourism, more investment in environment which benefits locals, multiplier effect
-N=Environmental degradation of tourists, Traffic, air pollution, money may not stay in area
Basic service + transport
-Village renewal for all age groups, tackle low education levels, tackle poor environment (dereliction, vacant properties)
-P=Higher education provided= higher pay jobs= disposable income, attract people to live in area
-N=Can only improve education to an extent
Conservation + rural heritage
- Replace ferry to Rathlin Island + fund project to conserve historic buildings
-P=connection to heritage, attract tourists
-N=Not much on island may not attract tourists
Rural poverty + isolation
- Small settlement regeneration programmes partly funded by local council + part form UK Gov e.g. restore coastal paths, signage, picnic areas
-P=Coastal paths will encourage residents to get daily activity + signage will encourage visitors to venture into village (economic boost for small towns)
-N=Environmental degradation with tourists coming or resident swaying off path
Conservation + rural heritage
- Village catalyst programmes- funding to allow breath of new life for rural areas + conservation of heritage sites
-P= Connection with heritage
-N= Could help improve rural urban inc=vestment gap
Look at end of the regeneration section to see exam Qu help (answer= yay)
yay