Foundations of Statistical Inference and inferential statistics
1/29
Earn XP
Description and Tags
research pt. 6 (time will be heavy on the exam)
Name | Mastery | Learn | Test | Matching | Spaced | Call with Kai |
|---|
No study sessions yet.
30 Terms
foundations of statistical inference
allows for predictions and conclusions to be made
inferential statistics basics
probability, empirical rule, and confidence interval
probability
likelihood that any one event would occur (p)
measured as a decimal version of the percent chance (so 16.6% would be p = 0.167)
if the event must occur, p = 1.00
if the event will not occur, p = 0.00
p < 0.05 is signficant
empirical rule
the 68-95-99.7 rule
the pattern of percent of data which lies 1, 2, and 3 SDs from mean. You can then use this to determine the probability of an event in a normal distribution
Confidence Interval
range of values used to eliminate unknown pop parameter (like a mean) based on sample data, giving you an idea of the precision of your estimate and how confident you can be of your estimate. should be presented as a percentage
wider boundaries = inc confidence, dec precision
interpretation ex: 95% CI, with CI = 6.8 ± 0.4116. We would say “ we can be 95% confident that the population mean will fall between 6.39-7.21”
we do not want the CI to cross 0
P value + CI will always result in a sum of 100%
Sampling error
error is inevitable. this particular error means that the sample reflects the difference between results obtained from your sample and the truth about the population. As sample size increases, sample sets become more representative of the population. So a larger n value means less sampling error!
Point estimate
single value obtained by direct calculation, using sample mean to estimate population mean. likely contains some degree of error
interval estimate
specifies a range within which the population parameter should lie. This is the more meaningful method
hypothesis testing
draws conclusions about population, based on sample data
null hypothesis (Ho)
differences occurred due to chance, rather than intervention (means of control and case groups are the same)
alternative hypothesis (research hypothesis)
group means are different
non-directional simply says they are not the same
directional says one is greater than the other
Ex: for pts with limited shoulder mobility, mean change in Sh ER will be greater/lesser for those who receive mobilization than for those who do not receive mobilization. Errors can occur in hypothesis testing, too: Type I and Type II
Type I
rejecting null when it is true (stating difference, but really none)
level of significance (a) - probability of Type I error.
if p = /< .05, reject the null - this means there’s a 5% change of Type I error
Type II
not rejecting null when it is false (stating no difference, but really there is)
power (1-beta) measures how good the test is at detecting a real effect when one actually exists - of actually rejecting a false null. Beta is the probability of making Type II error. Our goal is to have a high power (80%), beta = 0.20
without enough power, we risk concluding that an intervention doesn’t work when it actually does! And if that happens, we risk abandoning a good intervention idea
power analysis
power analysis
good for determining sample size and probability of Type II error
a priori
before the study. used to determine n
post Hoc
after the study. used to determine power and may assist in explaining any potential significance results
effect size (d or standardized mean difference, SMD)
measures how big or important a different is between groups/variables. it is possible to have a p that is insignificant, and a large effect size - we focus more on p, so in this instance, the other stuff doesn’t matter!
cohen’s d: small = .2, medium = .5, and large >.8
pearson’s r: small = .1-.3, medium = .3-.5, large = >.5
*Also has a connective to SD! We want our two samples to be separated in regard to SD
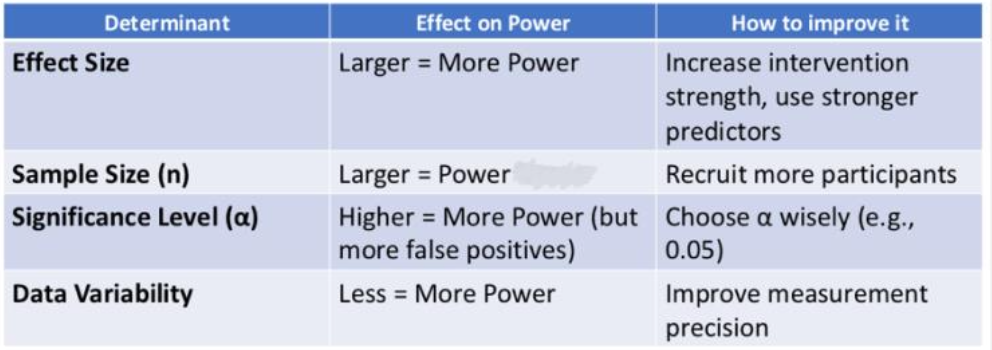
chart of determinants
inferential statistics
parametric statistical tests and t-tests for parametric
parametric statistical tests
requires three assumptions:
normal distribution
variance
interval or ratio scales
*these tests are generally more powerful and can test a wider range of alternative hypotheses
normal distribution
samples are randomly drawn from a population with a normal distribution
normality
shapiro-wilk or kolmogorov-smirnov (p >0.05, because the null hypothesis is that there is a normal distribution
variance
samples being compared are roughly equal
Levene’s (p > 0.05). This is the rare time when we WANT a non-significant (>) result - it means groups are homogenous!
interval or ratio scales
data should be measured on the interval or ratio scales (continuous data)
for a parametric test, we usually want n = or > 30, so just be aware of that with the textbook’d sample questions. but regardless of number, the exam will be clear whether or not yu need to use parametric!
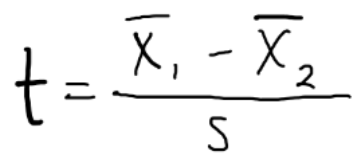
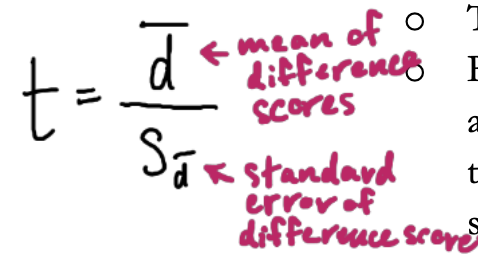
t-tests for parametric
significance of difference between two group means is judged by a ratio. t = diff between groups/variability within groups. Basically numerator = mean of different scores and denominator = standard error the difference scores. T will be large if the difference is significant
independent (unpaired) and Paired (correlated, matched)
independent t-test (unpaired)
two independent groups (whether case and control, or two cases getting different txs)
homogenous groups
paired t-test (correlated, matched)
tend to be more powerful
repeated measures, or where participants are exposed to both conditions (they are their own controls). Analyzes a difference score and reduces error variance
*be careful - multiple t-tests increase chance of error (if you need to compare three or more ANOVA)
research deign or inferential statistic
how to determine which parametric or nonparametric inferential statistic to use?
what is the research design?
list the independent variable (s)
for each IV, is it a between or within IV
list the dependent variable (s)
list the level or measurement scale for each DV
the research design used is _____
What inferential statistic should be used?
is the data parametric or nonparametric?
how many means are being compared?
are the means paired or unpaired?
the statistic that should be used is _____