acts 430
1/39
There's no tags or description
Looks like no tags are added yet.
Name | Mastery | Learn | Test | Matching | Spaced | Call with Kai |
|---|
No analytics yet
Send a link to your students to track their progress
40 Terms
damages of non constant variance
biased estimates, make the OLS estimates LESS EFFICIENT because equal weights has been assigned regardless of the info contained in each observation
assumption of constant variance can be checked by examining
scale-location plot
how do we deal with non constant variance
transform observations (non constant variance transformation); use another estimating method: weighted lease squares; model the variance (arch/garch)
model diagnostics
E(Ei)=0
Var(Ei) constant
Cov(Ei,Ej)=0, i=/j
Ei~N(0,var)
check outliers and high leverage points
the variance of standardized residuals is approximately ____, but only approximately because…
1, their definition DOESNT take account the correct variance
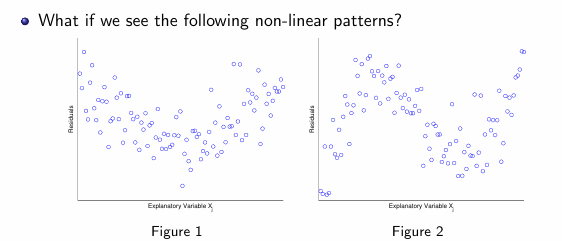
violation of E(Ei)=0 caused by…
inappropriate model structure (effect of explanatory variables may enter model in a different way)
negligence of some important explanatory variables (STEPAIC)
if a model is adequate, what should we expect to see when we plot residuals against Xj?
random scatter plot
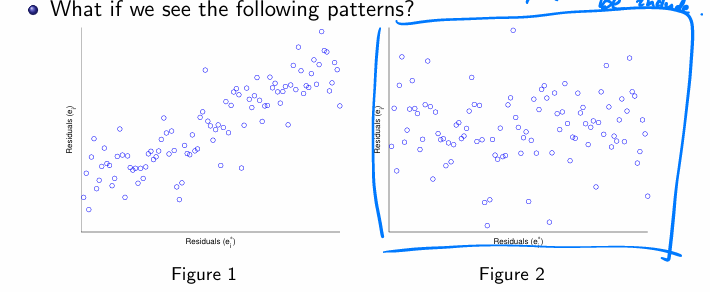
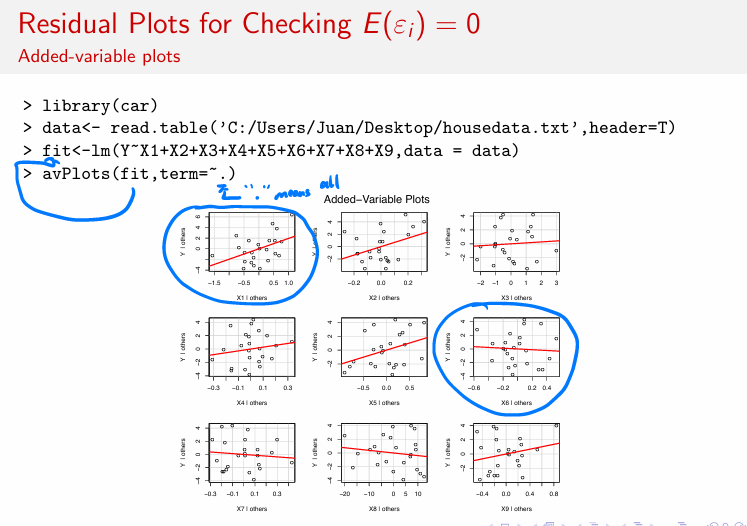
an added variable plot is useful when
deciding whether a new explanatory variable should be included
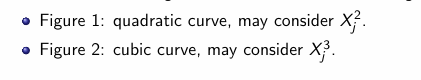
residual plots for checking E(Ei)=0:
checking residuals from X* and original residuals.
Figure 1: theres a pattern, so addition of X* may improve model
Figure 2: random scatter plot, may not need to include X*
Plot with a clear slope / pattern (your left blue circle)
Points follow an upward or downward trend
Red line is noticeably sloped
Interpretation:
Xk has a nonzero partial effect
Xk likely belongs in the model
Omitting it could violate E(εi)=0
partial residuals plot shows the relationship
b/w a given explanatory variable (Xj) and the response (Y) given that other independent variables are also in the model
BACKWARD LOOKING
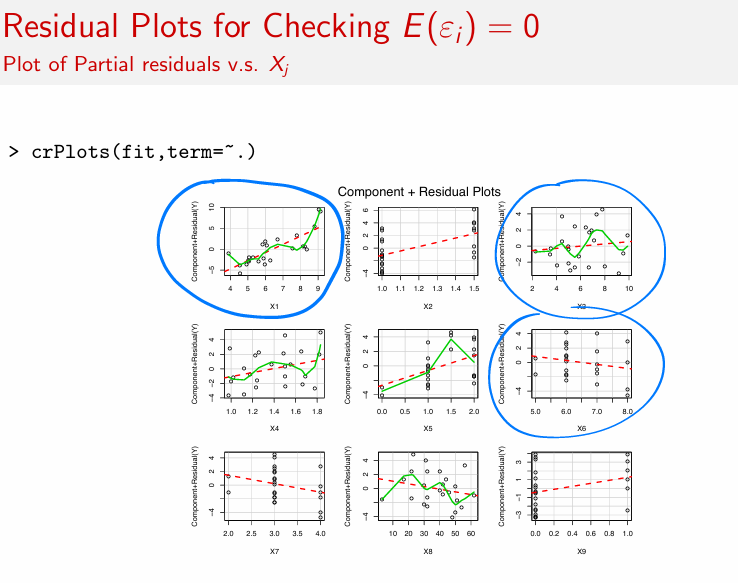
Circled plots with curvature (top left, top right)
The green smooth curve bends away from the red dashed line
This suggests:
The relationship between Y and Xj is not linear
Even if Xj is important, the model is misspecified
Typical fix:
Add Xj^2, log(Xj), or a spline term
👉 These variables belong, but not in a simple linear form.
heteroscedasticity
variability of a collection of random variables is unequal
when consider log transformation
when standard deviation of y is proportional to the mean. regress ln(yi) on the explanatory variables
QQ plot compares…
quantile of data sample and quantile of the theoretical distribution
QQ plot: if the residuals don’t come from a normal distribution.
steeper —>
flatter —>
steeper —> fat tailed
flatter —> light tailed
outlier is an observation that has an extreme _____ value. treat a point as an outlier if the …
high leverage point is an observation that has an extreme ____ value. leverage can be assessed through …
influential point is an observation …
we use what to measure the influence of an outlier or a high leverage point
outlier is an observation that has an extreme response value. treat a point as an outlier if the standardized residual exceeds 2 in AV
high leverage point is an observation that has an extreme explanatory variable value. leverage can be assessed through …
influential point is an observation where including/excluding point can have a big impact on regression result
cooks distance
cooks distance
sum of all the changes in a regression when a data point is removed
when interpreting results from multiple regression, the main goal is
convey the importance of the individual variables, or effects, on an outcome of interest
readers of a regression study first want to understand the
direction (sign) and magnitude (size) of individual effects
consequences of overfitting the model
increase resulting sigma hat squared due to a smaller value of denominator (n-p-1)
including extraneous variables would NOT lead to bias. but the standard error would be larger than if we had correct model (less efficient)
consequences of underfitting
bias estimates
increase sigma hat squared due to biased estimates
larger sigma hat squared inflates PI and produces inaccurate test results regarding importance of explanatory variables
more serious than overfitting
potential pitfalls when collecting data
sampling frame error and adverse selection
limited dependent variables, censoring, truncation
if sample not representative, taking a larger sample
DOES NOT remove bias
drawbacks of using old modeling technique
poor fitted values - yi only takes the values of 0 or 1 but yhati can be continuous
heteroscedasticity - var(yi) varies depending on different obs
meaningless residual analysis
logit and probit functions are both _____. they are similar in that they are almost linearly related over the interval .1<p<.9, so the function choice is dependent on…
nonlinear functions
preference
for simple linear relationship, y=B0+B1+E,
if E=0, the 95% confidence interval is equal to the 95% prediction interval
The prediction interval includes the irreducible error, but in this case it is zero.
for simple linear relationship, y=B0+B1+E,
the prediction interval is always at least as wide as the confidence interval
Because it includes the irreducible error, the prediction interval is at least as wide as the confidence interval.
confidence interval quantifies what range?
E(y/x)
forward step selection
greedy
starts w intercept and then adds explanatory variable that most decreases SSres at each stage. rather than explore all possible models, looks for a good yet easy to compute path thru them
backward step selection
start w full model and delete explanatory variable that is least significant. ends when all explanatory variables are statistically significant
AIC
nested models
BIC
non nested models
visuals for whether we should alter model structure?
residuals vs Yhat
residuals vs Xj, j=1.,,,p
visuals for whether we should add a particular explanatory variable?
added variable plots (partial regression plot)
partial residuals plot
ridge regression:
modifies…
L_ regularization
tuning parameter controls… and is determined by …
modify SSres by including an additional shrinkage penalty term
L2 regularization because second order magnitude is imposed as the penalty
tuning parameter, lamda, controls the relative impact of the penalty and is determined separated via CV
ridge regression improves OLS in terms of
MLE
disadvantage of ridge regression
it would always include all explanatory variables in the final model
lasso regression
stands for?
L_ regularization
least absolute shrinkage and selection operator
L1 regularization because the first order magnitude is imposed as the shrinkage penalty
compared to ridge regression, lasso regression has the ability to force some of the B’s to be exactly = 0 when lambda is sufficiently large