Global Change Biology: Exam IV
1/8
There's no tags or description
Looks like no tags are added yet.
Name | Mastery | Learn | Test | Matching | Spaced |
|---|
No study sessions yet.
9 Terms
Describe how UV radiation can damage living organisms and explain how the ozone layer in the stratosphere protects us from UV radiation
Describe Ozone’s presence in the troposphere and stratosphere
At what wavelengths is UV light?
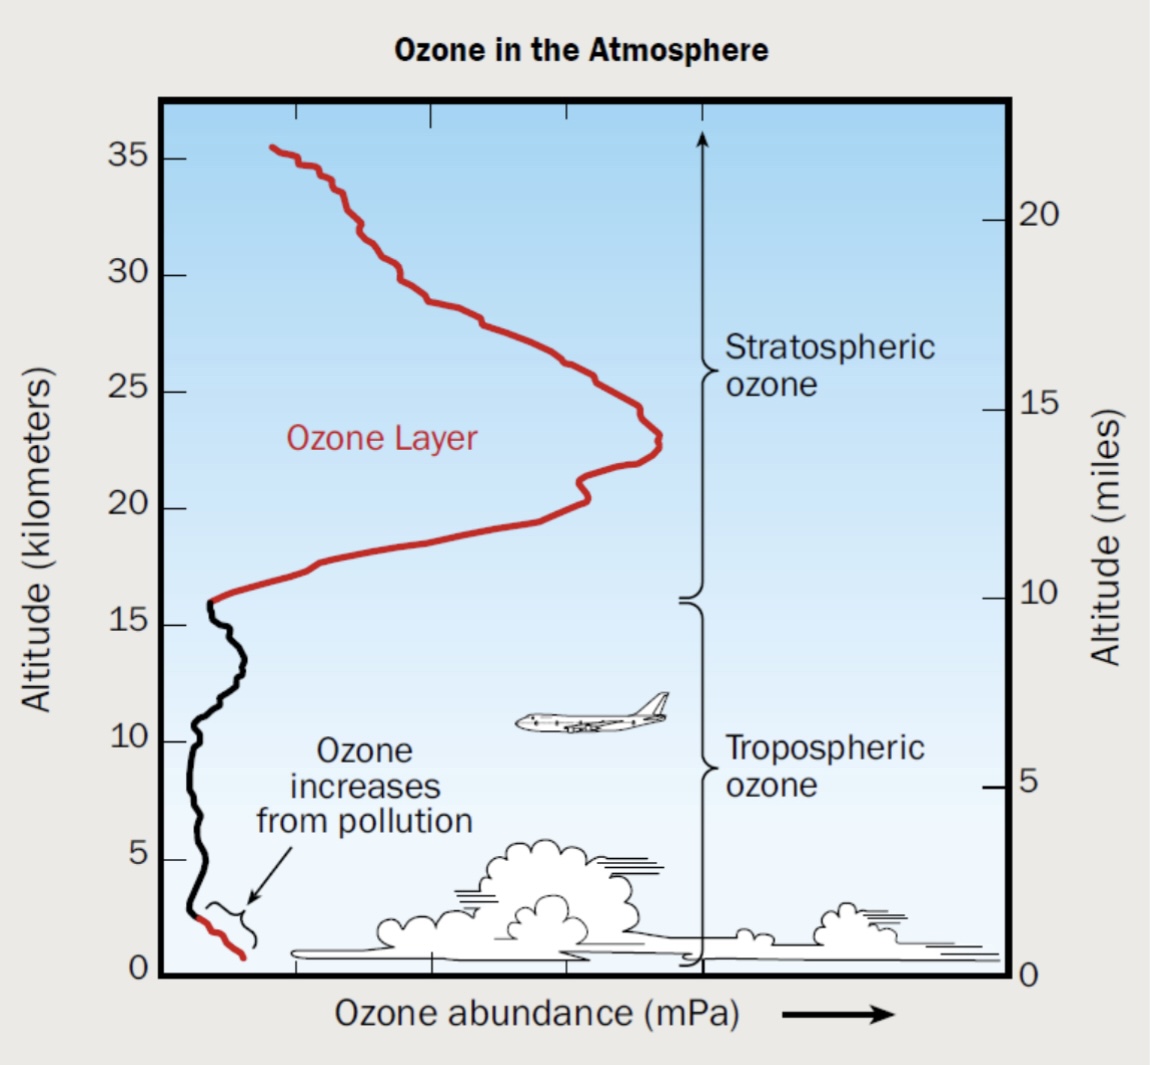
Ozone is present throughout the troposphere and stratosphere.
This profile shows schematically how ozone changes with altitude in the tropics.
Most ozone resides in the stratospheric "ozone layer."
The vertical extent or thickness of this layer varies from region to region and with season over the globe
Increases in ozone occur near the surface as a result of pollution from human activities.
At 10 miles/15 kilometers of altitude you switch from tropospheric to stratospheric ozone
Ozone gradually increases as you increase in altitude eventually reaches a peak and then starts decreasing again
UV Light Wavelengths
100-400 nm overall
100-200 UV vacuum
200-280 UV C
280-320 UV B
320-400 UV A
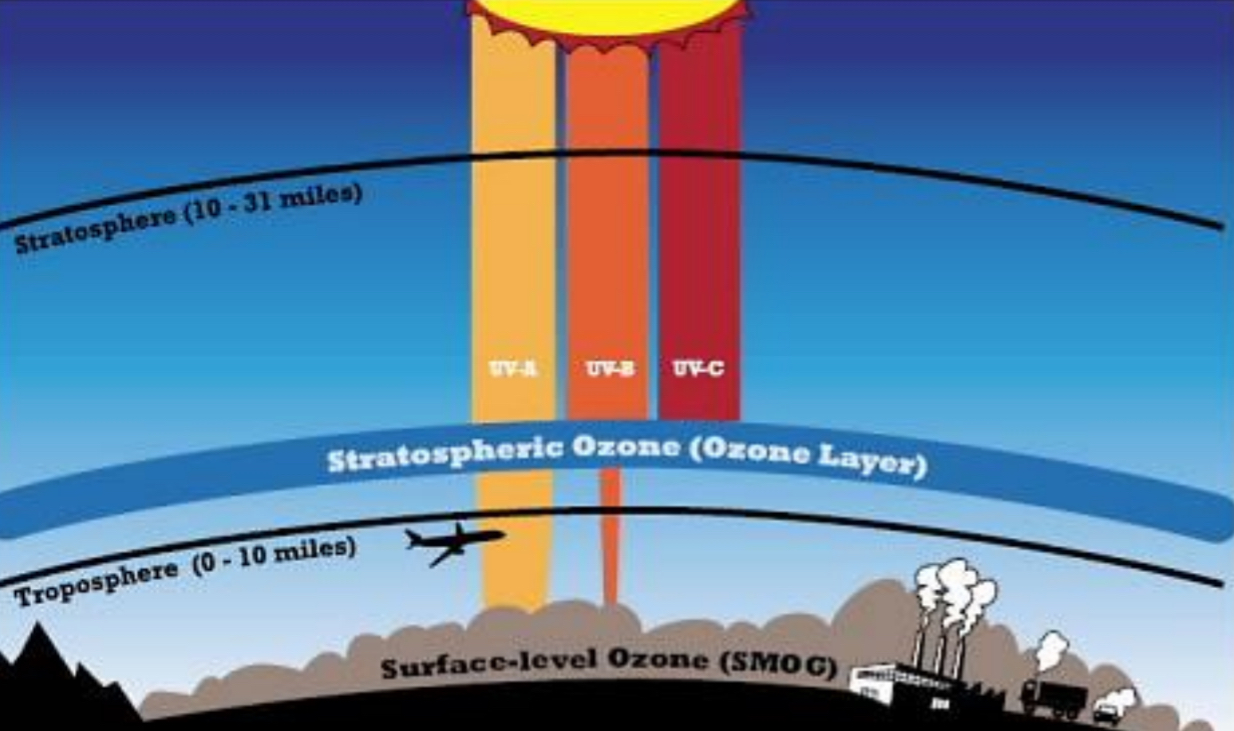
Only UV A can fully penetrate stratospheric ozone layer and enter troposphere
UV B slightly penetrates, UV C not at all
400-800 nm is visible light spectrum
I frequently play as Hulk=green=close to blue=high energy=low wavelength=UV is high energy/frequency
How does the Ozone Layer protect life on earth?
O2 molecules are photolyzed by UV C radiation forming 2 O radicals (SLOW)
O3 and O2 atoms are continuously interconverted as solar UV- C breaks O2 into O O and O reacts with O2 to form O3. O3 itself can be broken down by UV-B and UV-C back into O2 and O.
This interconversion converts UV radiation into thermal energy (which is let off) thus further heating the stratosphere. This SHIELDS earth’s surface from harmful UV radiation.
O3 is lost by the reaction of O with O forming more O2 or O3+O→ 2O2; or even trace gases like Cl radicals which react with O3 breaking it down into ClO and O2 instead
Describe how UV radiation can damage living organisms and explain how the ozone layer in the stratosphere protects us from UV radiation
Describe the general chemical process through which CFCs and other ODSs can deplete the ozone layer in the stratosphere
UV-B radiation impacts on living organisms
• UV-B radiation (280-320 nm) directly damages DNA
• Damages human skin cells and causes sunburn
• This leads to mutations and disruption of cell cycle or tumor suppression genes, resulting in skin cancer
• UV-B exposure also causes eye damage and can lead to cataracts
• In plants, growth is stunted and crop yields are decreased
Ozone-depleting substances (ODS) contain Cl or Br
These substances enter the stratosphere, where Cl and Br radicals are released and catalytically destroy ozone.
Most ODSs are from human activity, not natural sources.
Natural sources of Cl and Br alike remained largely constant
Chlorine Source Gases Have Decreased Overall (1993 → 2012)
• Total chlorine dropped about 10%.
• Major decreases came from Methyl chloroform (–96.0%) — almost entirely phased out.
HCFCs and CFC-12, however, has increased
Halon 1211 and Halon 1301 have also increased in the Br department
Bromine Source Gases Also Decreased Slightly (1998 → 2012)
• Total bromine dropped by ~9%.
• Largest decrease was from Methyl bromide (–61.8%), largely due to regulatory controls.
Ozone is destroyed by a chain reaction with radical intermediates | Catalytic Cycle as 1 Cl can destroy thousands of O3 molecules
How chlorofluorocarbons (CFCs) deplete the ozone layer:
CFCs released into environment by industries rise up to the stratosphere
CFCs are very stable in lower atmosphere which is why they last for so long, rise up to stratosphere which exposes them to high-energy UV-C radiation (200-280 nm) which has enough energy to break their C-Cl bonds releasing Cl radicals that destroy O3
Sunlight (UV-C: 200-280 nm) photolyzes CFCs
CFCl3—>CFCl2 • + Cl •
Cl• + O3 —> Chlorine Monoxide (ClO•) + O2
ClO• + O• —> Cl• and O2
Preventing O• reacting with O2 to form O3
NET: O• + O3 —> 2O2
CALCULATING NET EQUATION INVOLVES CANCELLING OUT THE INTERMEDIATES OF THE OVERALL REACTION (USED AND REGENERATED)
Step 1:
Cl• + O₃ → ClO• + O₂
Step 2:
ClO• + O• → Cl• + O₂
To derive net equation, first ADD reactants and ADD products
Cl• + O₃ + ClO• + O• —> ClO• + 2O₂ + Cl•
Cancel out whatever appears on both sides
Thus Cl• and ClO• are both excluded from the NET equation, however they are NOT THE SAME
Derive the net equation
NET: O• + O3 —> 2O2
Since Cl• appears on both sides yet also appears in the FINAL result then it is a CATALYST | Since ClO• appears on both sides yet is ABSENT from the final result then it is an INTERMEDIATE
Describe the characteristics of the ozone hole – location, seasonality, causes, etc.
The Ozone Hole Is Seasonal and Occurs Primarily Over the Antarctic Due to The Presence of Stratospheric Clouds (PSCs)
Ozone depletion occurs primarily over Antarctica and is not even around the world
Even after pollution stops being made, it takes decades up to a century for a full recovery to be made. Takes a few years to make ozone hole, takes a lot longer to fix it
1979 higher ozone layers, reduces in 1987, increases again in 2006 then starts decreasing in 2011
Peaks in Southern Hemisphere Spring (September-November)
Winter conditions set the stage; Sunlight returning in spring triggers the rapid ozone breakdown
In Antarctic winter, extremely cold temperatures form Polar Stratospheric Clouds (PSCs) in the stratosphere which enable chlorine activation
During cold winters PSCs provide a surface where inactive chlorine compounds are converted into reactive forms (like Cl2).
When sunlight returns in spring, UV-C radiation photolyzes Cl₂ → 2Cl• radicals, which then destroy ozone.
Bonus: Why Not the Arctic?
The Arctic also gets cold, but not as cold or as stable.
Antarctica has stronger and more persistent polar vortex winds, which trap air and keep temperatures low enough to form more PSCs, making ozone loss more severe in the Southern Hemisphere.
Describe why the Montreal Protocol is considered the most successful treaty of all time, and articulate the impact that it has had on the ozone hole and global warming
Montreal Protocol
Put into writing in 1987, ENFORCED in 1989
Bans the use of CFCs and other related gasses (HCFCs, etc.) that contribute to the destruction of O3 in the stratosphere (ODSs)
Preceded by the “Vienna Convention for the Protection of the Ozone Layer,” (1985) which laid down the principles
Backed by strong scientific evidence and global cooperation from governments, scientists, industry, and technologists.
Great example of what can be accomplished if scientists, nations, industries all unite to solve one problem
Considered the most successful UN treaty ever— UNIVERSAL RATIFICATION
Chlorofluorocarbons (CFCs)
Were invented as non-toxic coolants/refrigerants
Turned out to be contributing towards over half of Antarctica’s ozone layer being destroyedOzone levels have stabilized, and recovery is underway.
Full recovery is expected by the end of this century, but:
ODSs have long atmospheric lifetimes, so vigilance is needed.
Some replacement chemicals (like HFCs) are strong greenhouse gases, linking ozone recovery to climate change.
Montreal Protocol has been revised over time to reflect updated science and promote greater effectiveness
AMENDMENTS
Included the REGULATION of new chemicals which also deplete the ozone layer (initially CFCs, but now also cover HCFCs and HFCs)
Created the MULTILATERAL FUND (a financial mechanism to enable developing countries to comply with the treaty via support from richer countries)
5 Major Amendments (and other revisions)
The London Amendment (1990)
The Copenhagen Amendment (1992)
The Montreal Amendment (1997)
The Beijing Amendment (1999)
The Kigali Amendment (2016)
The Path from Kigali: HFC Phase-Down Timeline
Guidelines developed, ratification (2016)
HFC import and export systems implemented (2019)
Regulatory frameworks are set up to monitor and control trade in hydrofluorocarbons
Eligible capacity cut-off 1 (2020) and 2 (2024)
Benchmark years to tighten limits and increase phase-down efforts
2033: Ban on HFC trade with non-parties
2047: Phase down COMPLETE
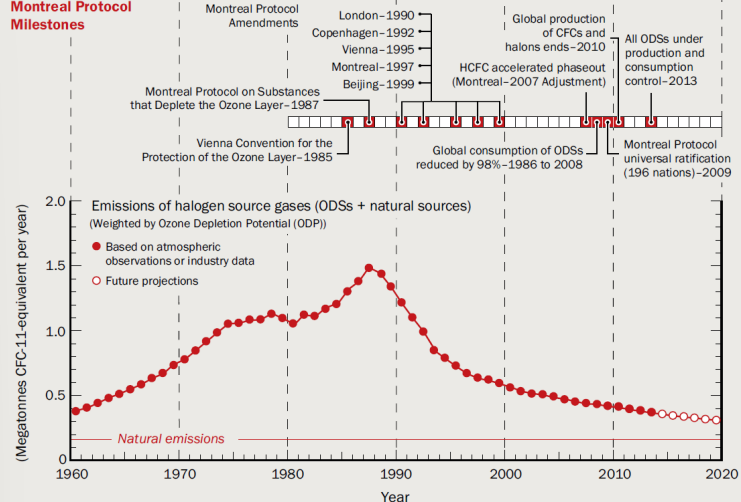
Montreal Protocol Milestones and Emissions of Halogen Source Gases (ODSs + natural sources; GRAPH 1)
Emissions of halogen source gases (mainly CFCs and halons) increased steadily from the 1960s through the 1980s.
The peak occurred just before 1990, at around 1.6 megatonnes of CFC-11 equivalent per year.
Emissions Dropped Dramatically After the Montreal Protocol (1987)
Following the adoption of the Montreal Protocol in 1987, emissions rapidly declined.
By 2008, global consumption of ODSs was reduced by 98% compared to 1986 levels.
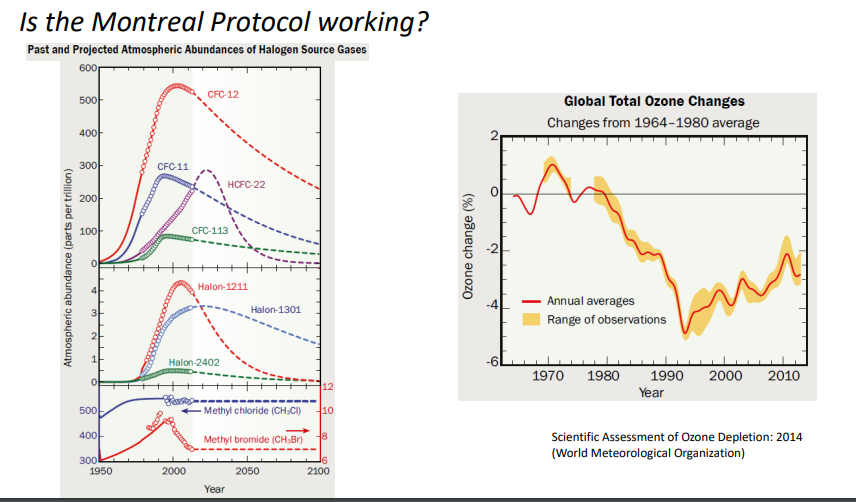
Is the Montreal Protocol Working? (GRAPH 2)
CFCs and halons (e.g., CFC-11, CFC-12, Halon-1211) peaked in the late 1980s to early 1990s, then declined due to Montreal Protocol regulations.
HCFCs (like HCFC-22), used as transitional replacements, rose slightly but are now stabilizing or declining.
The right panel shows global total ozone changes relative to the 1964–1980 average.
There was a clear decline in global ozone from ~1980 to the late 1990s (~5–6% loss).
After 2000, the decline slowed and began to level off, showing early signs of ozone stabilization and recovery.
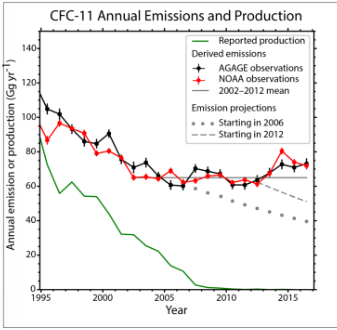
Monitoring and Enforcement of Montreal Protocol are Essential to its Success in Protecting the Ozone Layer (GRAPH 1)
The graph shows that while reported production of CFC-11 (green line) dropped to near zero after 2010, measured emissions (black and red lines) remained higher than expected.
Emission projections (gray dashed lines) based on official data showed a steady decline, but real-world observations revealed an unexpected plateau and slight rise.
This discrepancy indicated illegal production, which was later traced to China.
After the issue was identified, China took action to curb the illegal production of CFC-11.
As noted in the news excerpt, this response brought ozone layer recovery back on track, confirming the importance of global cooperation and accountability.
Tools like the AGAGE and NOAA atmospheric monitoring networks played a key role in detecting unexpected emissions.
This highlights how science-based tracking systems help ensure compliance and drive corrective action.
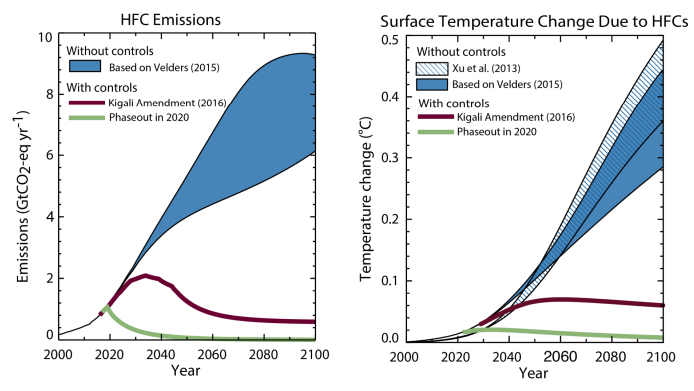
The Montreal Protocol is actually helping mitigate global warming by phasing out ODSs that are GHGs
Many ozone-depleting substances (ODSs) and their replacements (especially HFCs) are also powerful greenhouse gases (GHGs).
By phasing them out, the Montreal Protocol—especially with the Kigali Amendment (2016) also reduces global warming.
LEFT graph (HFC emissions): Without regulation, emissions would climb steeply, reaching ~9–10 GtCO₂-eq/year by 2100.
RIGHT graph (surface temperature): This would result in ~0.4–0.5°C of additional global warming due to HFCs alone.
With the Kigali Amendment (2016) or an even stricter 2020 phaseout, HFC emissions are significantly reduced and then leveled off.
The associated temperature rise is capped at ~0.05–0.1°C, preventing a major contributor to climate change.
Describe and compare the Montreal and Kyoto Protocols, and the Paris Agreement
Kyoto Protocol (1997)
The first attempt at reducing GHG emissions
Set goals for countries to reduce their GHG emissions to a certain
Established a system of EMISSIONS CREDITS
Rich countries could pay other countries to offset their GHG emissions
Considered a failure b/c U.S. DID NOT RATIFY it (leader in GHG emissions)
Also considered ineffective b/c BRICS countries were not required to set emissions targets
Paris Agreement (2015)
In Dec. 2015, a new global environmental agreement was developed
Every country sets its own goals for emissions reduction
U.S. goal was 28% REDUCTION by 2025 relative to 2005 emissions levels
There is NO MECHANISM for ENFORCEMENT; voluntary but still considered a major step forward in global climate change diplomacy
Describe and compare the Montreal and Kyoto Protocols, and the Paris Agreement
Montreal Protocol (1987)
Goal: Protect the ozone layer by phasing out ozone-depleting substances (ODSs)
Target chemicals: CFCs, halons, HCFCs, HFCs (via Kigali Amendment)
Success: Extremely effective — global CFC emissions dropped by 98%, and the ozone layer is recovering
Climate co-benefits: Many ODSs are also greenhouse gases (GHGs), so phasing them out helps mitigate global warming
Global participation: Universal ratification — 198 nations (most successful environmental treaty ever)
Kyoto Protocol (1997)
Goal: Reduce greenhouse gas emissions in developed countries
Target gases: CO₂, CH₄, N₂O, and other long-lived GHGs
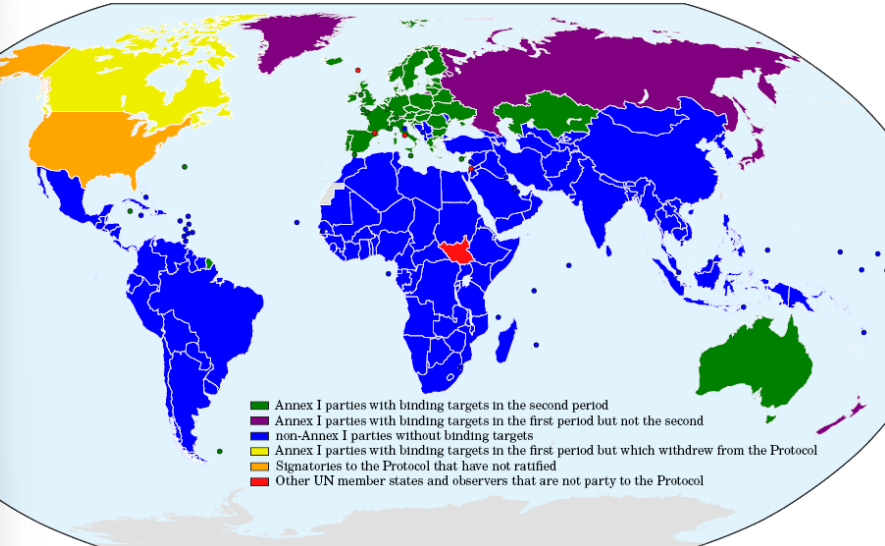
Binding targets: Only for developed nations (Annex I countries)
Criticism: Developing nations (like China, India) had no binding targets; U.S. signed but never ratified
Result: Limited success — some emission reductions, but many countries did not meet targets
Paris Agreement (2015)
Goal: Limit global warming to below 2°C, ideally 1.5°C above pre-industrial levels
Global scope: All nations (developed and developing) participate with self-determined goals (NDCs)
Flexibility: Non-binding targets, but regular reporting and updates required
Focus: Emissions reduction, climate adaptation, and financial support for vulnerable nations
Success (so far): Most countries joined (including U.S., which left under Trump but rejoined under Biden); actual progress varies
Montreal Protocol = ozone protection + climate benefits; highly successful
Kyoto Protocol = GHG cuts for rich countries; limited effectiveness
Paris Agreement = inclusive, flexible climate framework; progress depends on continued action
Outline the standard and stretch goals for the Paris Agreement and describe how much CO2-equivalent emissions are allowable under the 2°C goal:
Describe the overall trends in GHG emissions and how they break down geographically and/or by sector:
International consensus on limiting global warming - 2°C target
Goal: To limit global surface warming to 2°C (3.6°F) by 2100 compared to 1860
If possible, we want to try to keep warming down to 1.5°C to minimize impacts and disruption to life on Earth
Maximum cumulative CO2 emissions allowed to meet the 2°C goal: approx. 1 trillion tons of carbon
Cumulative Emissions of CO2 largely determine the global mean surface warming by the late 21st century and beyond
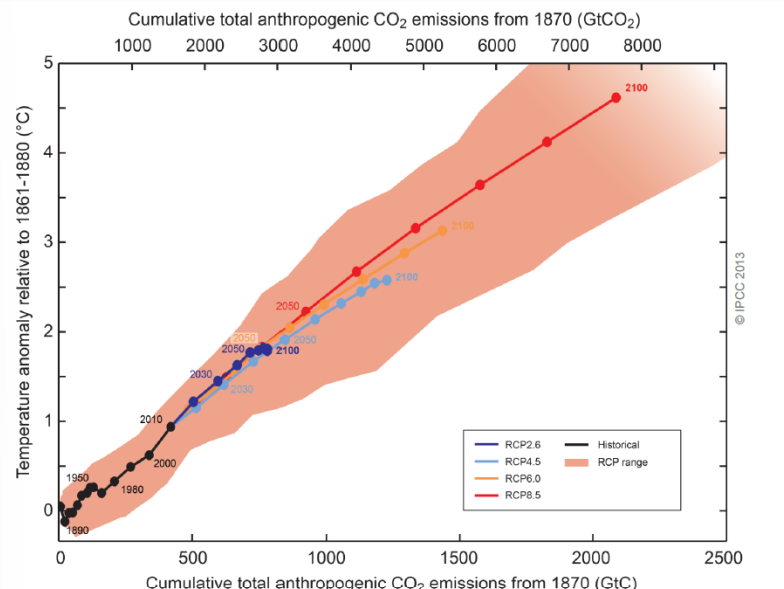
Limiting Climate Change will require SUBSTANTIAL and SUSTAINED reductions of greenhouse gas emissions (GRAPH 1)
Direct Link Between CO₂ Emissions and Warming:
The temperature anomaly (how much warmer it is compared to 1861–1880) increases with cumulative anthropogenic CO₂ emissions.
This relationship is almost linear, indicating a strong correlation.
Future Emissions Dictate Future Warming:
Four Representative Concentration Pathways (RCPs) illustrate different emission scenarios:
RCP2.6 (blue): Aggressive mitigation — warming limited to ~1.5–2°C by 2100.
RCP4.5 (orange) & RCP6.0 (light brown): Intermediate mitigation — 2–3°C warming.
RCP8.5 (red): Business-as-usual — warming exceeds 4°C by 2100.
The Orange Shaded Area = Range of Uncertainty:
This "envelope" represents the likely range of warming based on different models and feedback effects.
Even with the same emissions, there's uncertainty in the exact temperature rise — but the trend remains upward.
Urgent Message:
The bottom caption emphasizes the need for substantial and sustained reductions in greenhouse gas emissions to limit climate change.
Without major changes, we're locked into dangerous warming scenarios.
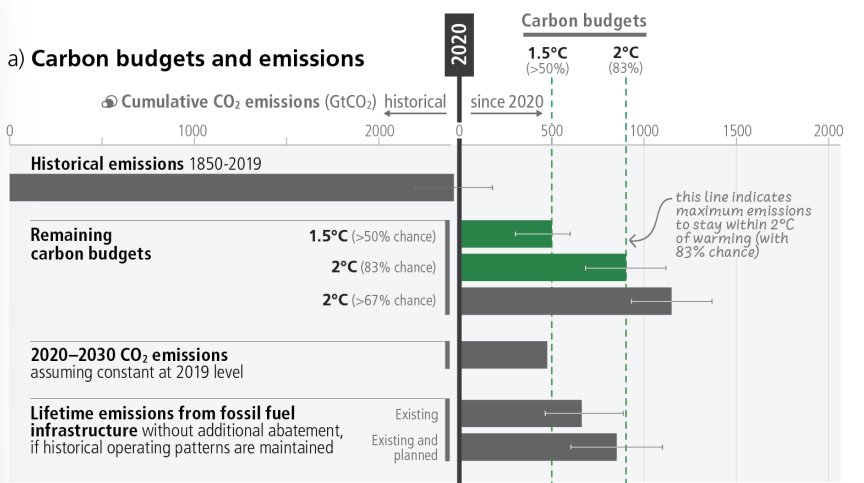
We are on the brink of exhausting the carbon budget for 1.5°C; staying under 2°C is also at serious risk without immediate and deep emissions cuts. (GRAPH 2)
Carbon Budgets Are Running Out Fast:
The remaining carbon budgets (green bars) for staying below:
1.5°C of warming (with ~50% chance) is very small — only ~500 GtCO₂.
2°C (with 83% chance) allows a bit more, but not much — around ~1000 GtCO₂.
These budgets are measured from 2020 onward.
We’re Burning Through the Budget Quickly:
Projected emissions from 2020 to 2030 (gray bar) already consume a large chunk of these remaining budgets — assuming no emission cuts.
At 2019 levels, we'd exhaust the 1.5°C budget in less than a decade.
Fossil Fuel Infrastructure Alone Can Blow the Budget:
The lifetime emissions from already-existing and planned fossil fuel infrastructure (bottom bars) exceed all the remaining carbon budgets.
This includes power plants, vehicles, industrial facilities, etc., even without new construction.
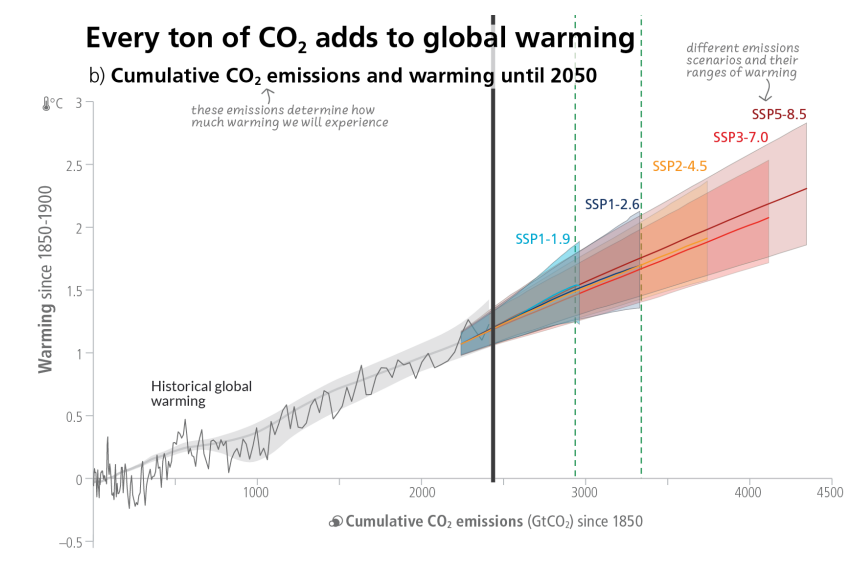
Every Ton of CO2 adds to Global Warming (GRAPH 1)
Cumulative CO2 emissions and warming until 2050
We’ve Already Warmed ~1.2°C:
Historical warming (black line) shows a clear trend upward, reaching about 1.2°C by now.
This has occurred with cumulative emissions nearing 2500 GtCO₂.
Different Futures Based on Emission Pathways:
SSP1-1.9 and SSP1-2.6 (blue lines): Low-emission scenarios that limit warming to well below 2°C, potentially under 1.5°C.
SSP2-4.5 and SSP3-7.0 (orange and red): Moderate to high emissions, pushing warming toward 2.5°C or more.
SSP5-8.5 (dark red): Very high emissions scenario, with warming exceeding 3°C by 2050.
Urgent Thresholds Are Approaching:
The graph shows vertical dashed green lines at key cumulative emissions points:
Once we surpass these, staying under 1.5°C or 2°C becomes nearly impossible.
This line threshold is at 300 GtCO2
Every Ton Counts:
The central message: Every ton of CO₂ emitted contributes to additional warming.
Small reductions now have big impacts on future climate.
Geographic Distribution of GHG Emissions has SHIFTED over the past 30 years
Global Emissions Have Risen Sharply:
Total annual GHG emissions increased from 38 GtCO₂-eq in 1990 to 59 GtCO₂-eq in 2019 — a more than 50% rise in just three decades.
Eastern Asia Now Dominates Emissions:
Eastern Asia's share grew significantly: from 13% in 1990 to 27% in 2019.
This region (primarily China) is now the largest contributor to global emissions.
Shift in Emission Centers:
North America and Europe’s relative shares declined:
North America dropped from 24% in 1990 to 13% in 2019.
Europe went from 16% to 9% over the same period.
This reflects efforts in emission reductions, but also OUTSOURCING of production and emissions to other regions.
Emerging Economies Are Increasing Emissions:
South-East Asia, Southern Asia, and Africa show growing contributions to emissions.
As economies grow, energy use and emissions rise — unless decarbonized early.
International Emissions Remain Small but Steady:
International shipping and aviation emissions stayed relatively low (~2%) but are still significant given their cross-border nature.
Emissions Have Grown in Most Regions but are Distributed Unevenly, both in the present day and cumulatively since 1850
While US emissions globally have reduced so that we are no longer the leaders
North America has the highest per CAPITA emissions, nearing 20 tCO₂-eq per person, far exceeding the global average.
Australia, Japan, and New Zealand, as well as the Middle East, also have high per capita emissions.
Eastern Asia has high total emissions but moderate per capita levels due to its large population.
Africa and Southern Asia have the lowest per capita emissions, even though they host a large portion of the global population.
GHG Emissions do NOT correlate geographically with highest vulnerability to climate-related impacts
The people most vulnerable to climate change are not the ones driving it. This underscores the need for fair and just global climate action, including financial and technical support for the most affected.
Inverse Relationship Between Emissions and Vulnerability:
Countries with the highest climate vulnerability (upper left of the chart) generally have very low per capita emissions.
These are typically low-income or developing nations, disproportionately impacted by climate change despite contributing little to the problem.
“Total Annual Anthropogenic GHG Emissions by Groups of Gases, 1970–2010”
GHG emissions are rising faster in the 21st century than before.
CO₂ from fossil fuels is the primary driver of climate change, and its share is growing.
Dominant source of emissions throughout, rising from 55% in 1970 to 65% in 2010.
Methane (CH₄), Nitrous Oxide (N₂O), and F-gases:
These non-CO₂ gases made up a smaller but significant and steady share.
F-gases, though small in percentage, are potent and increasing in use.
Tackling climate change requires:
Rapid decarbonization of energy and industry
Continued action on land use and non-CO₂ gases
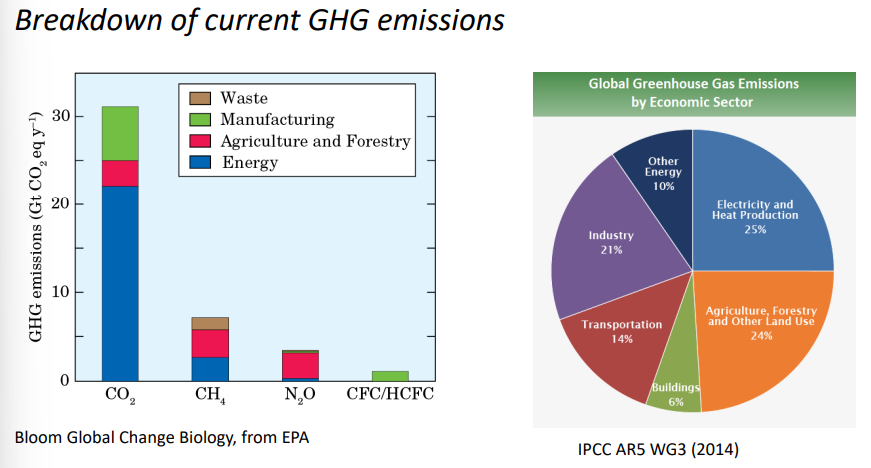
Breakdown of Current GHG Emissions (GRAPH 2)
Most GHG emissions come from CO2 used for Energy
Global Greenhouse Gas Emissions by Economic Sector
Electricity and Heat Production (25%)
Agriculture, Forestry (24%)
Industry (21%)
Transportation (14%)
Other NRG (10%)
Buildings (6%)
Mitigation of Climate Change - Approaches
Reduction in energy use - conservation & efficiency
Shifting from fossil fuels to non-fossil fuel energy sources (renewables)
Removing CO2 from the atmosphere and storing it in long-term SINKS
SINKS: Storage for CO2 outside of our own atmosphere
Reforestation or management of natural ecosystems to promote carbon storage
Carbon capture & storage (CCS) & other types of geoengineering
PUMPING CO2 back underground
Energy Efficiency has improved SIGNIFICANTLY in many sectors
LED v. incandescent lighting
Fuel efficiency of cars & trucks
High-efficiency…
Renewable or “clean” NRG sources
Solar
Wind
Hydropower
Geothermal
Bioenegy/Biofuel
Nuclear (?): Nuclear Waste: 0 carbon NRG source
We are NOT the world leaders in renewable energy generation
China eclipses us by up to 4 times
Trends in US Electricity Generation sources since 1950
Coal used to be primary source of electricity generation
Has been dropping since turn of millenia, has now dropped past
Natural Gas (40%)
Renewables (21%)
Nuclear (20%)
Coal (19%)
Other (<1%)
Coal is no longer our main source of electricity, and that is NOT about to CHANGE