lec 11 (mcbride) - application of protein isolation techniques in diagnosis
1/40
There's no tags or description
Looks like no tags are added yet.
Name | Mastery | Learn | Test | Matching | Spaced |
|---|
No study sessions yet.
41 Terms
blood tests
provide a snapshot of overall health and often the first step in disease diagnosis
may be performed as part of a routine physical exam or b/c of the presence of specific symptoms
will measure the levels of various components: blood cells and platelets, electrolytes, proteins, hormones, and certain minerals
glucose → high in diabetes
urea → high in kidney disease
LDL cholesterol → high in CV disease
blood test includes quantification of many proteins
albumin → marker of liver and kidney function
alkaline phosphatase (ALP) → high levels = liver or bone disorders
alanine aminotransferase (ALT) → high levels indicate liver damage
aspartate amino transferase (AST) → high levels indicate liver damage
aspartate aminotransferase and alanine aminotransferase
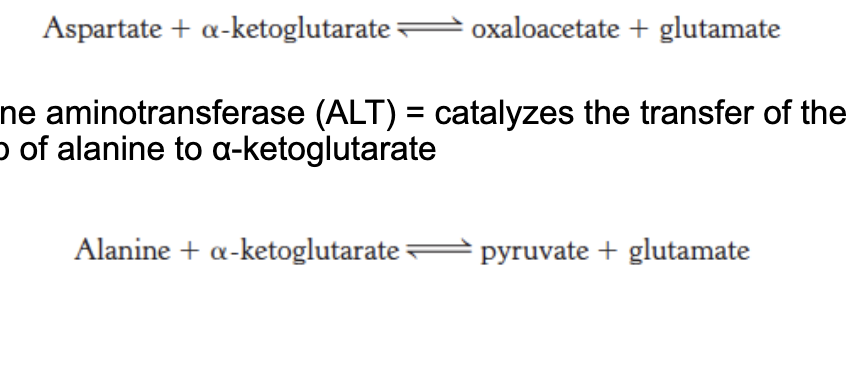
aspartate aminotransferase (AST) = catalyzes the transfer of the amino group of aspartate to α-ketoglutarate
alanine aminotransferase (ALT) = catalyzes the transfer of the amino group of alanine to α-ketoglutarate
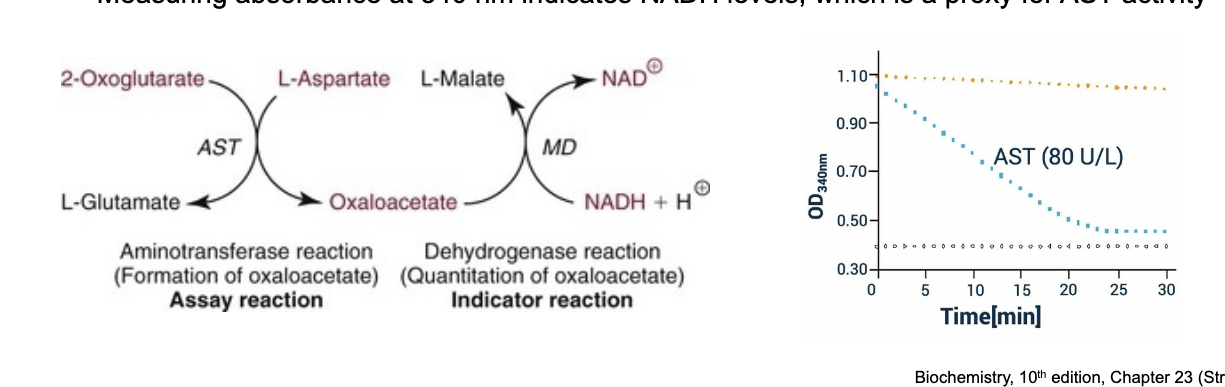
quantification of aspartate aminotransferase (AST) is...
coupled to NADH levels
malate dehydrogenase (MD) catalyzes this rxn to convert oxaloacetate to malate and in the process converts NADH to NAD+
NADH in solution produces a significant absorbance peak at 340 nm while NAD+ has virtually NO absorbance at this wavelength
measuring absorbance at 340 nm indicates NADH levels → proxy for AST activity
more NADH = LESS AST activity bc AST makes oxaloacetate which is converted to L-malate which consumes NADH as a result
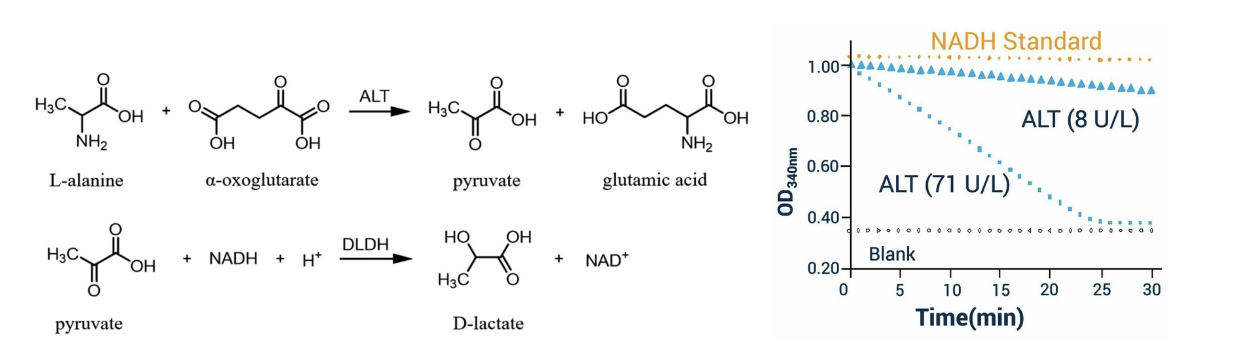
quantification of alanine aminotransferase (ALT) is…
coupled to NADH levels
lactate dehydrogenase (LDH) catalyzes this rxn to convert pyruvate to lactate and in the process converts NADH to NAD+
NADH in solution produces significant absorbance peak to 340 nm while NAD+ has virtually NO absorbance at this wavelength
measuring absorbance at 340 nm indicates NADH levels → proxy for ALT activity
in an assay for AST, the 340nm absorbance of sample A never changes and sample B decreases by 60% over 20 minutes. which sample has higher AST levels?
sample B
explanation
AST is responsible for converting aspartate → oxaloacetate
then MD converts the resulting oxaloacetate → L-malate; during that process; NADH → NAD
NADH produces a significant absorbance peak at 340 nm
sample A the absorbance at 340 nm does NOT change → high levels of NADH which means NO oxaloacetate is being forced which means NO AST activity
sample B, the absorbance at 340 nm decreases → NADH being converted to NAD → indicated presence of oxaloacetate which is only created through presence of AST
protein purification…
is often an essential first step in their quantification and understanding their function
proteins can be purified
performed by subjecting an impure mixture of starting material to series of separations based on physical properties such as size and charge
requires a test, or assay, that determines whether the protein of interest is present
analyzing a purification scheme
to analyze how a purification scheme is working, amount of total protein present in mixture being assayed must be known
specific activity = ratio of enzyme activity to amount of protein in mixture
overall goal of purification = maximize specific activity
proteins must be released from cell to be purified: steps
disrupt the cell membranes of intact cells to form a homogenate
centrifuge the homogenate at low speed to yield a pellet consisting of heavy material and lighter supernatant
centrifuge the supernatant at a higher centrifugal force to yield another pellet and supernatant
this process of differential centrifugation is repeated many times to yield several fractions of decreasing density
one fraction will be enriched for the desired activity
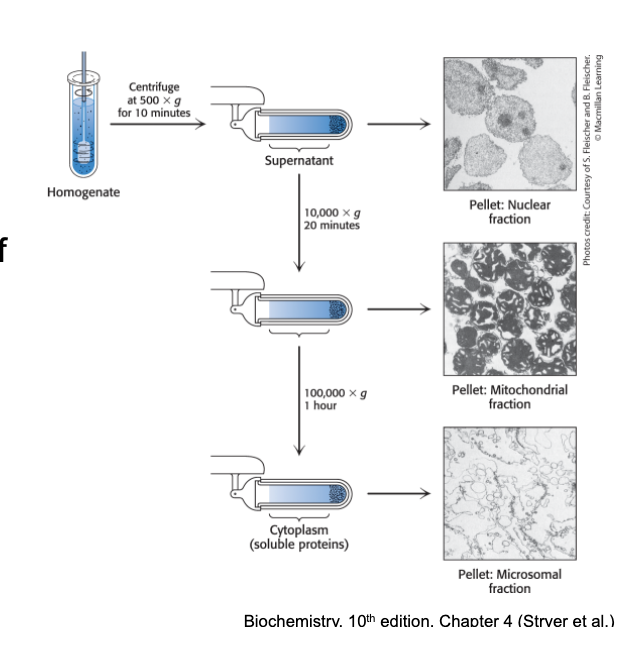
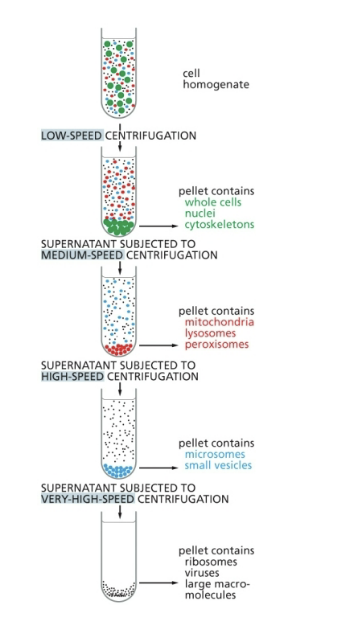
cell fractionation by centrifugation speed
repeated centrifugation at progressively higher speeds will fractionate homogenates of cells into their components
in general the smaller the sub-cellular component → greater the centrifugal force required to sediment it
in a cell homogenate containing both nuclei and mitochondria, where will each be located after a mild spin (low speed and short time)?
nuclei in pellet and mitochondria in supernatant
mitochondria in pellet and nuclei in supernatant
both in pellet
both in supernatant
answer = 1 → nuclei in pellet and mitochondria in supernatant
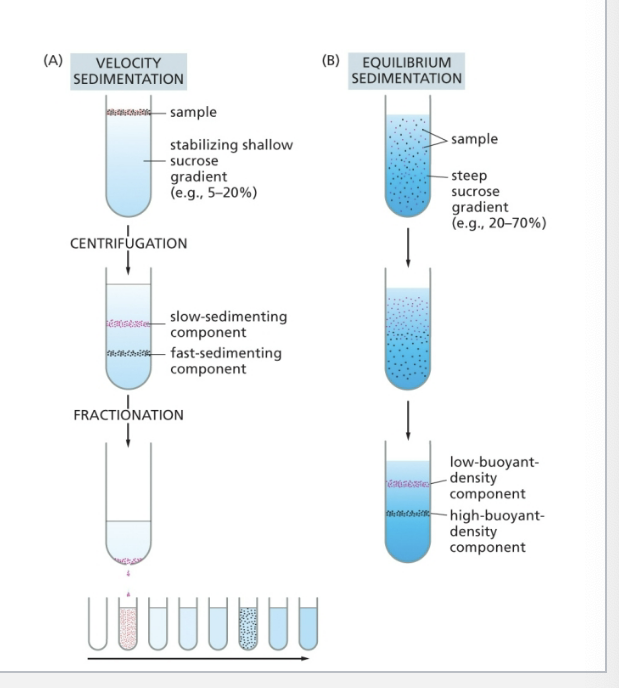
comparison of velocity sedimentation and equilibrium sedimentation
velocity sedimentation
sub-cellular components sediment at different speeds according to their size and shape when layered over a solution containing sucrose
after centrifugation, the different components can be collected individually, most simply by puncturing the plastic centrifuge tube with a needle and collecting drops from the bottom
slow sedimenting component on top
fast sedimenting component on bottom
equilibrium sedimentation
subcellular components move up or down when centrifuged in a gradient until they reach a position where their density matches that of their surroundings
low buoyant density component on top
high buoyant density component on bottom
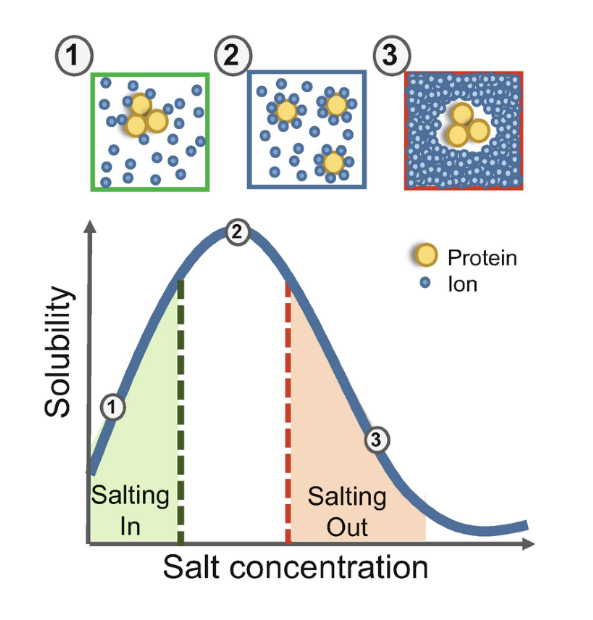
salting out
a method for precipitating proteins for collection
salting out = effect by which most proteins are less soluble at high salt concentrations
the salt concentration at which a protein precipitates differs from one proteins to another
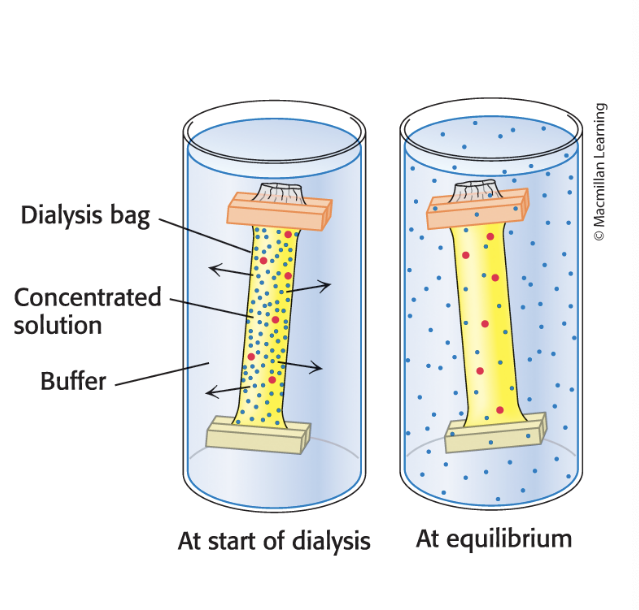
dialysis
separates proteins from smaller molecules
proteins can be separated from small molecules by dialysis through a semipermeable membrane such as a cellulose membrane with pore8
molecules larger than the pore diameter remain inside the dialysis bag
smaller molcules and ions diffuse down their concentration gradients and emerge in the soln outside the bag
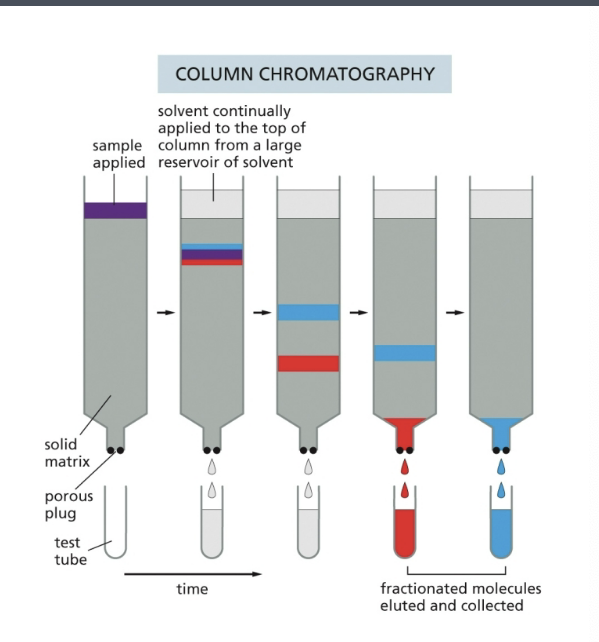
separation of molecules by column chromatography
the sample, a solution containing a mixture of different molecules, is applied to the top of a cylindrical glass or plastic column filled with a permeable gel matrix such as cellulose
a large amt of solvent is then passed slowly through the column and collected in separate tubes as it emerged from the bottom b/c various components of the sample travel at different rates through the column → fractionated into different tubes
gel filtration chromatography
separates proteins by size
gel filtration chromatography (molecular exclusion chromatography) = separates proteins on the basis of size
a column is filled with porous beads and the (protein) sample is applied to the top of the column
small molecules enter the aqueous space within beads → exit column last
large molecules CANNOT enter beads → exit column first
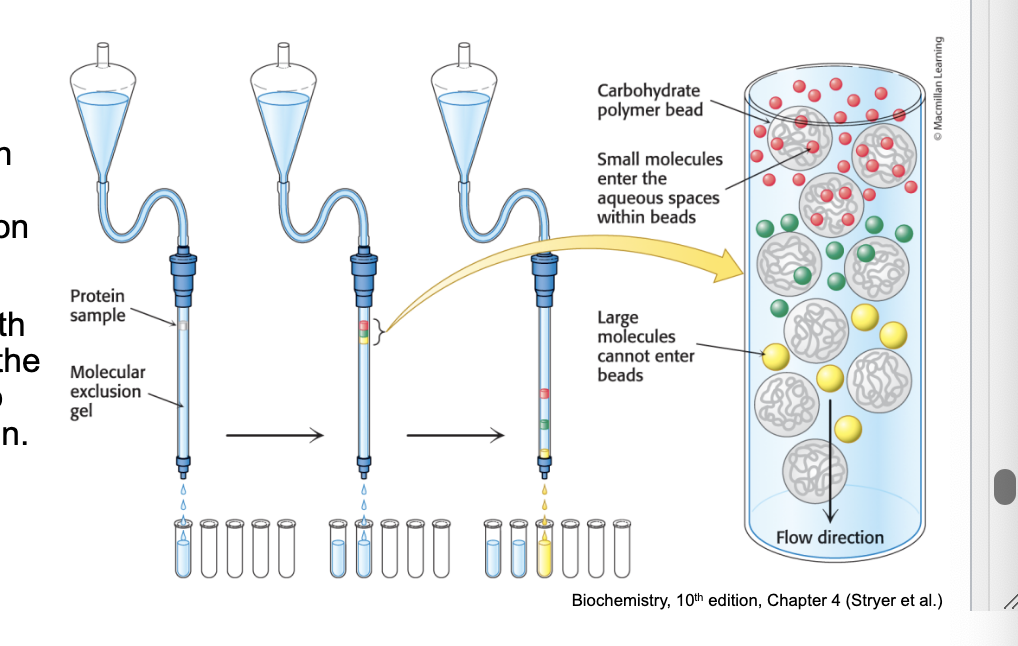
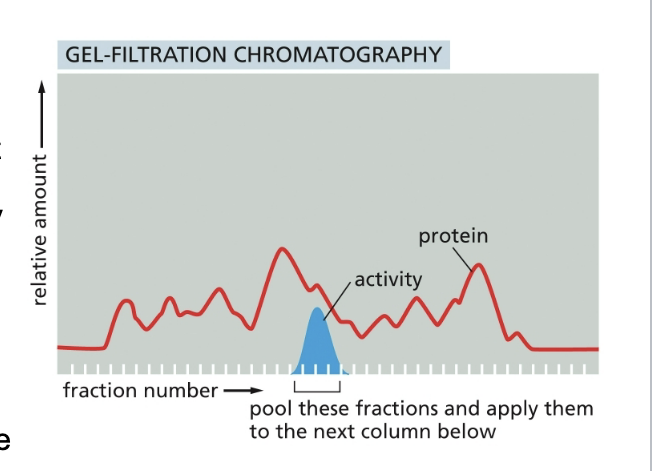
results for protein purification by gel filtration chromatography
a homogenate of cells is fractionated by passing impure protein through the matrix of gel-filtration column
the small beads that form the matrix are inert but porous. molecules that are small enough to penetrate into the matrix beads are thereby delayed and travel more slowly through the column than large molecules that CANNOT penetrate
beads of cross-linked polysaccharide (dextran, agarose, acrylamide) are available commercially in a wide range of pore sizes making them suitable for the fractionation of molecules of various masses
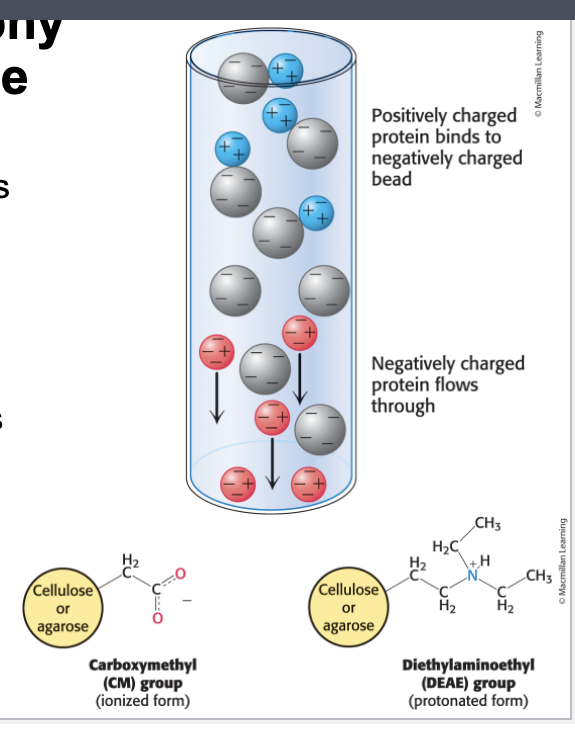
ion-exchange chromatography
ion-exchange chromatography = separates proteins on the basis of charge
a column is filled with charged beads and the sample is applied to the top of the column
cation exchange chromatography uses negatively charged beads
anion exchange chromatography uses positively-charged beads
when a protein soln is passed over the beads, proteins with the same charge as that on the column will exit the colum quickly
proteins with the opposite charge will bind to the beads
ultimately released by increasing the salt concentration of the buffer that is passed thru column
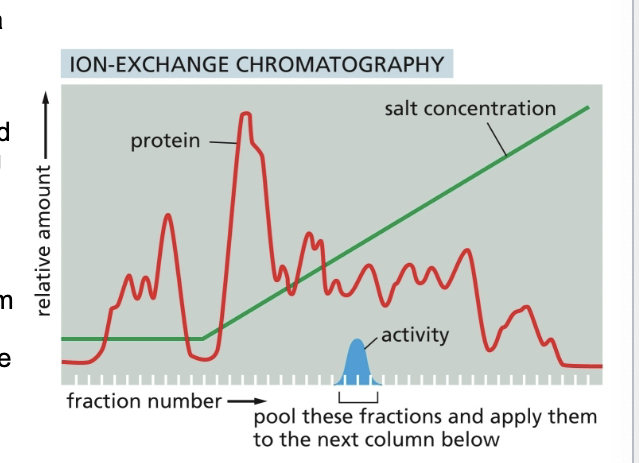
results for protein purification by ion-exchange chromatography
homogenate of cells is fractionated by allowing it to percolate through an ion-exchange resin packed into a column
the column was washed to remove all unbound contaminants and then the bound proteins were then eluted by pouring a solution containing a gradually increasing concentration of salt onto the top of the column
proteins with the lowest affinity for the ion-exchange resin passed directly through the column and were collected in the earliest fractions eluted from the bottom of the column
remaining proteins eluted in sequence according to affinity for the resin → those proteins binding most tightly to the resin requiring the highest concentration of salt to remove them
protein of interest was eluted in several fractions and then detected by its enzymatic activity
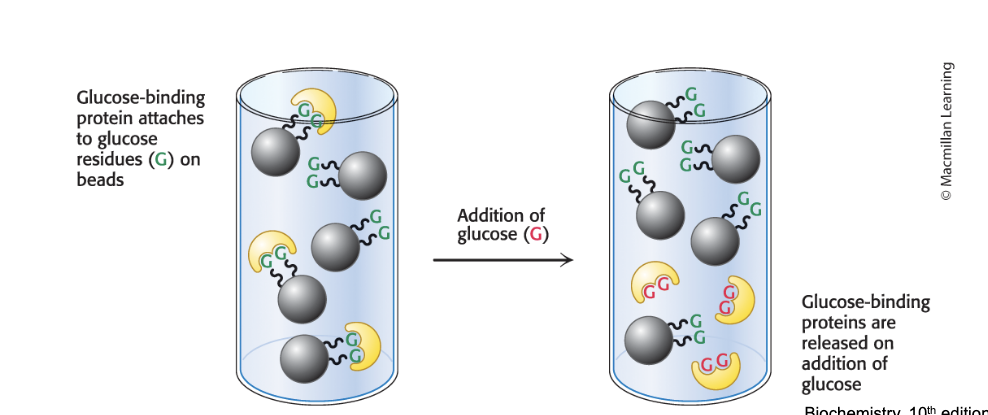
affinity chromatography
separates proteins by ligand affinity
affinity chromatography = takes advantage of the fact that some proteins have a high affinity for specific molecules called ligands
a column is filled with beads attached to the specific ligand
when a protein solution is passed over the beads, proteins with affinity for the attached group are retained
the bound protein is then released by passing a solution enriched in the ligand to which protein is bound thru the column
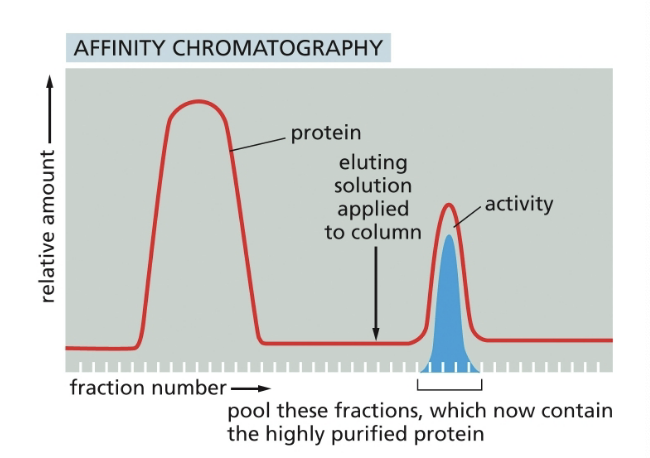
results for affinity chromatography
a homogenate of cells if fractionated by allowing it to percolate thru an immobilized substrate of the enzyme
the bound proteins were then eluted by pouring an elution solution, such as high volume of the free substrate, onto the top of the column
high-performance liquid chromatography
resolving power of any chromatographic technique is related to the # of potential sites of interaction between the protein and the column beads
very fine beads allow more interactions and thus greater resolving power but flow rates are slow
high-performance liquid chromatography (HPLC) = uses very fine beads in columns and pressure to move liquid thru the column
leads to sharper separations between proteins and a more rapid separation
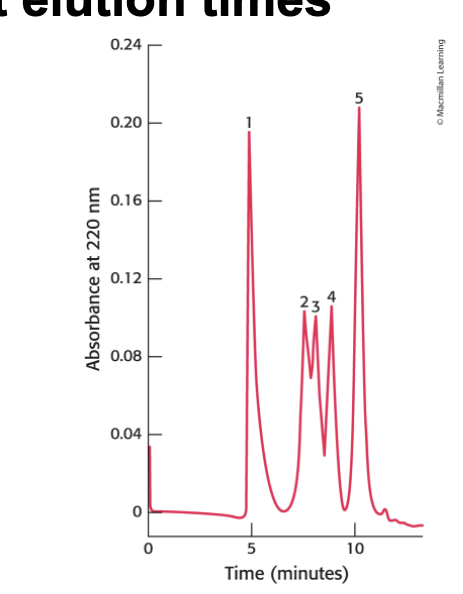
HPLC can separate proteins with…
high resolving power over short elution times
gel filtration by HPLC clearly defines the individual proteins b/c of its greater resolving power
1 → thyroglobulin → 669 kDa
2 → catalase → 232 kDa
3 → bovine serum albumin → 67 kDa
4 → ovalbumin → 43 kDa
5 → ribonuclease → 13.4 kDa
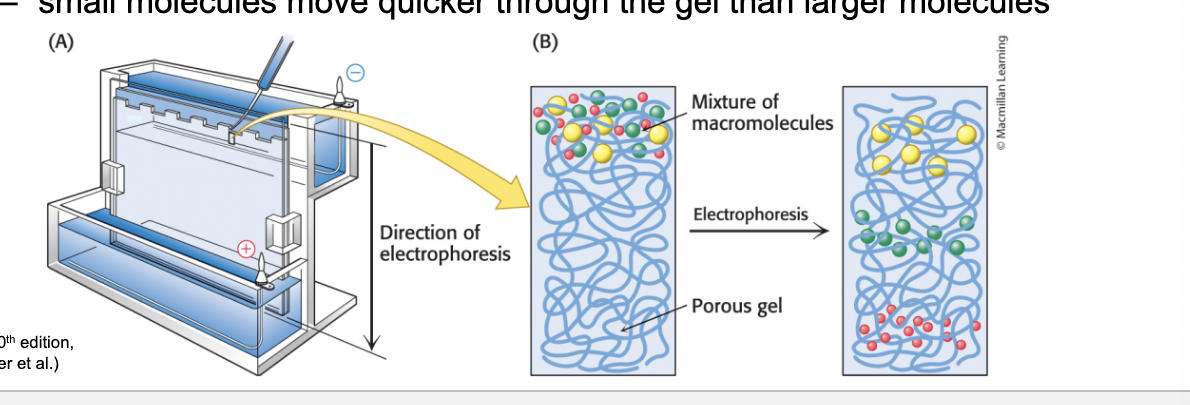
gel electrophoresis
separates proteins by size
electrophoresis = separates mixtures of molecules with a net charge by applying an electric field
used to separate proteins and nucleic acids
carried out in gels which act as molecule sieves to enhance separation
small molecules move quicker thru gel than larger molecules
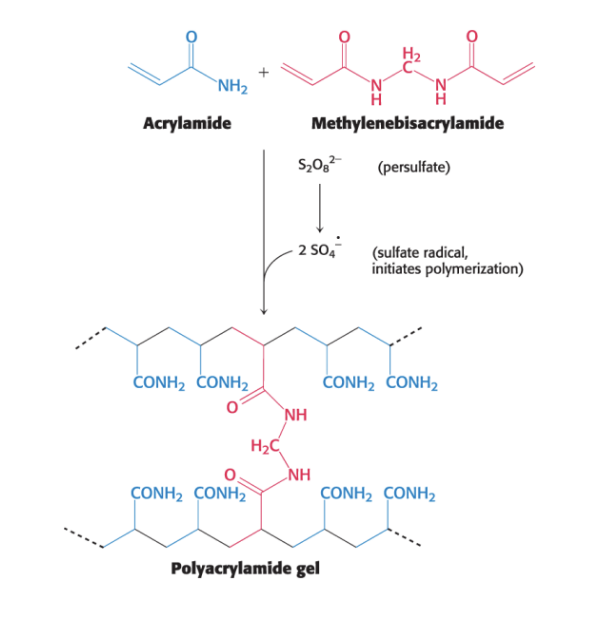
polyacrylamide gels
are highly cross-linked
polyacrylamide gel = highly cross-linked 3D mesh
gel is formed by polymers of acrylamide with intermittently spaced cross linker (red)
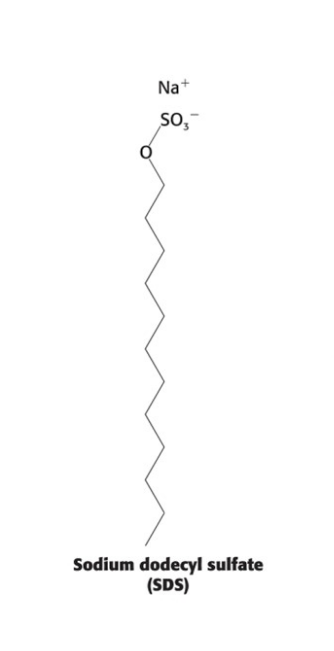
SDS-PAGE
a standard approach for protein separation
sodium dodecyl sulfate-polyacrylamide gel electrophoresis (SDS-PAGE) = allows accurate determination of mass
SDS = anionic detergent that denatures proteins
for most proteins, 1 molecule of SDS binds for every 2 AA
proteins have the same charge to mass ratio and migrate in the gel on basis of mass only
staining of proteins after electrophoresis
proteins separated by SDS-PAGE are visualized by staining the gel with dyes such as coomassie blue
coomassie blue dye binds to basic and hydrophobic AA residues
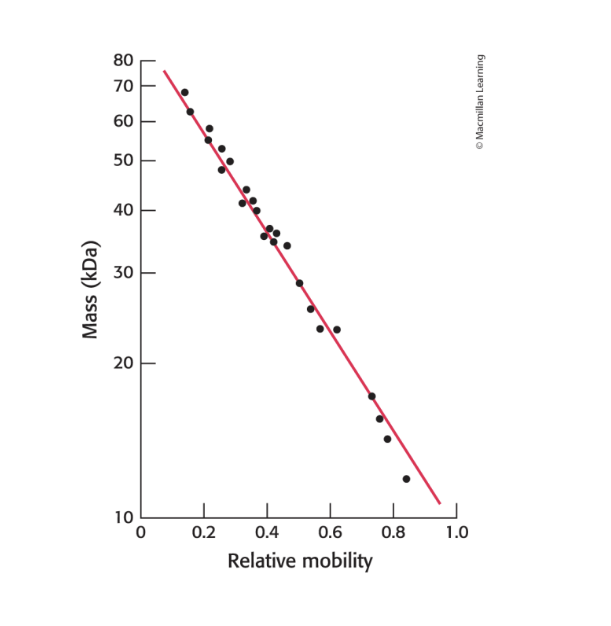
electrophoresis can determine…
protein mass
electrophoretic mobility of many proteins in SDS-polyacrylamide gels is linearly proportional to the log of their mass
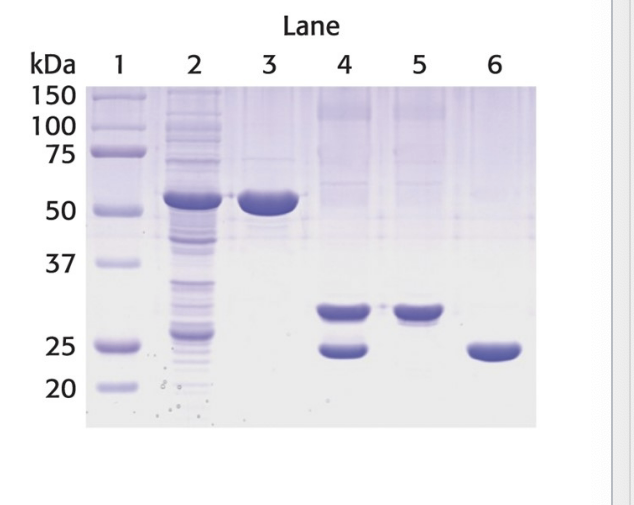
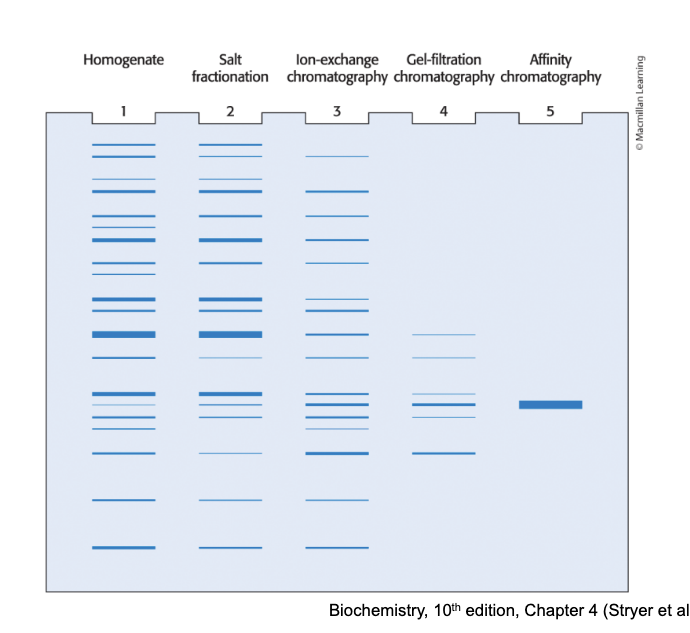
monitoring the process of protein purification
at each step of protein purification scheme, the sample was analyzed be SDS-PAGE
each lane contained 50 micrograms of sample
the effectiveness of the purification can be seen as the band for the protein of interest becomes more prominent relative to other bands
2 samples were analyzed by coomassie blue staining of an SDS-PAGE gel. sample A is normal and in sample B nearly all the proteins were about to be degraded by the proteasome, so they are highly ubiquitinated. how do these 2 lanes differ?
sample A bands are lower than sample B bands
sample A bands are higher than sample B bands
no difference
answer = 1; sample A bands are lower than sample B bands
explanation
in sample B, proteins are tagged with multiple ubiquitins which increases protein size → migrate more slowly
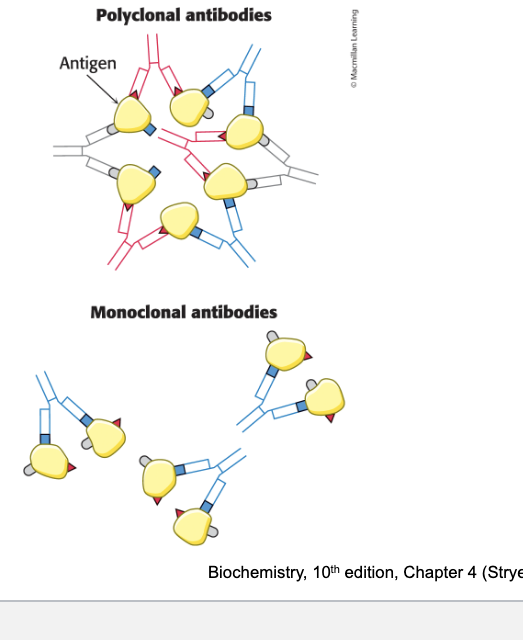
polyclonal and monoclonal antibodies are…
critical tools for protein detection
polyclonal antibodies = heterogenous mixture of antibodies
derived from multiple antibody-producing cell populations
each antibody is specific for one of the various epitopes of an antigen
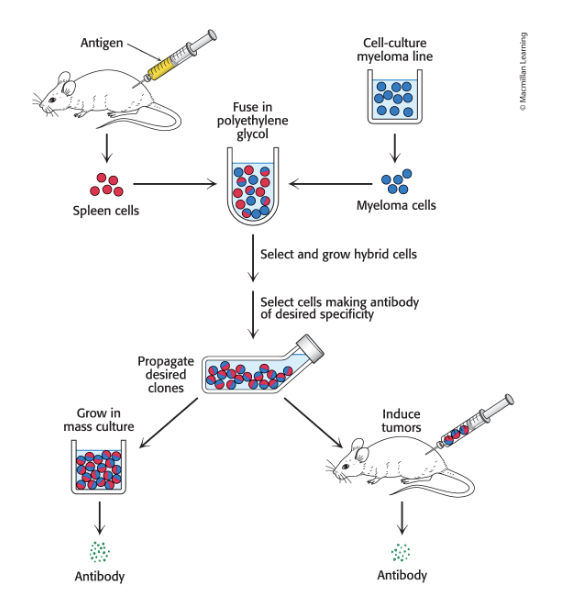
monoclonal antibodies = identical antibodies produced by clones of a single antibody-producing cell
monoclonal antibodies
with virtually any desired specificity can be readily prepared
immortal cell lines produce monoclonal antibodies
generated by fusing normal, short-lived antibody-producing cells w/immortal cells from a type of cancer called multiple myeloma
results in hybrid cells called hybridoma cells
monoclonal cell line is isolated by screening for the antibody of interest
western blotting permits…
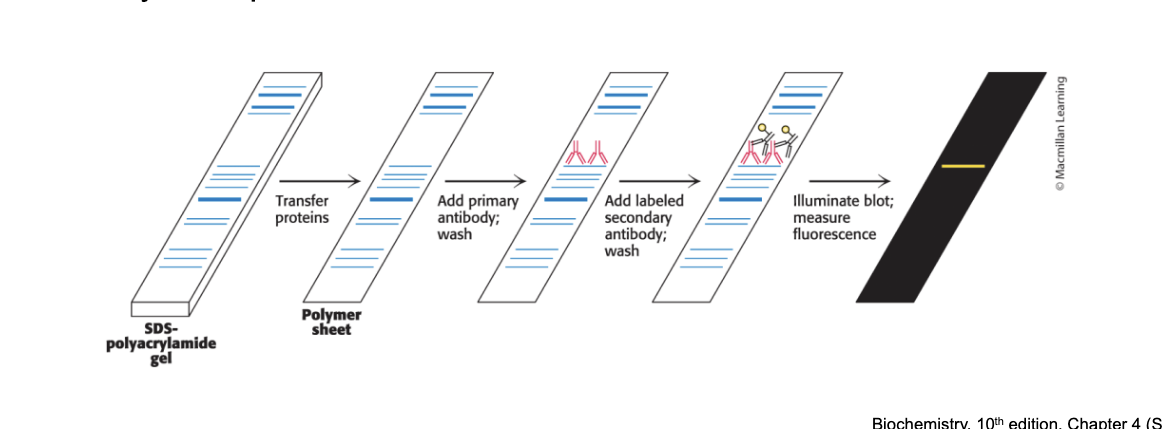
the detection and quantification of proteins separated by gel electrophoresis
western blotting = proteins are separated in an SDS-PAGE gel → transferred to polymer → stained with primary antibody → stained with secondary antibody → quantified (measure fluorescence)
primary antibody = antibody specific for the protein
secondary antibody = antibody specific for the primary antibody shapes
attached to an enzyme that generated a chemiluminescent product or contains a fluorescent tag to enable identification and quantification
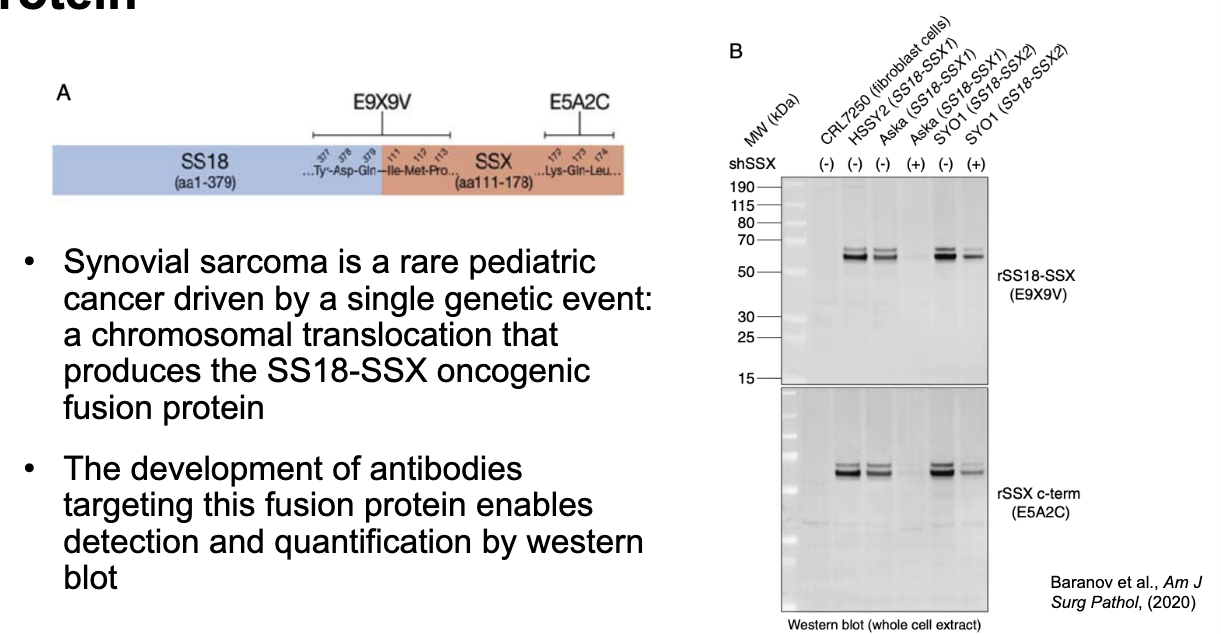
western blot detection of an oncogenic fusion protein
synovial sarcoma = rare pediatric cancer driven by a single genetic event → chromosomal translocation that produces the SS18-SSX oncogenic fusion protein
the development of antibodies targeting the fusion protein enables detection and quantification by western blot
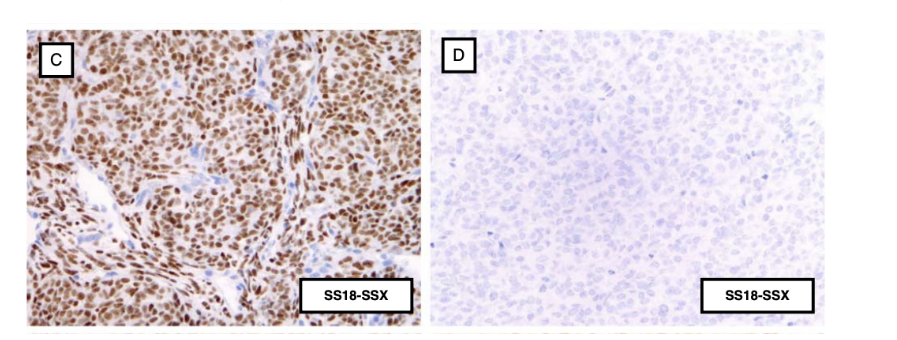
immunohistochemistry staining of the fusion allows…
pathologists to diagnose synovial sarcoma
immunohistochemical staining is accomplished with antibodies that recognize the target antigen on tissue slices and are then developed to produce a dark staining where the target protein is located
sample C = SS18-SSX positive → staining
sample D = SS18-SSX negative → no staining
protein extracts from 2 tumors are analyzed by western blot using an antibody targeting SHMT1 (size = 35 kDa). however this antibody also binds SHMT2 (size = 35 kDa). if the band at 35 kDa in tumor B is 50% less than tumor A, what can be conclude?
tumor B has 50% less SHMT1 protein
tumor B has 50% less SHMT2 protein
tumor B has 50% less total SHMT protein
tumor B has 50% less total protein
answer = 3; tumor B has 50% less total SHMT protein
enzyme-linked immunosorbent assay (ELISA)
proteins can be detected and quantified by using an enzyme-linked immunosorbent assay (ELISA)
antibodies can be used as reagents to quantify the amount of a protein or other antigen
ELISA = quantifies the amount of protein present
the antibody is linked to an enzyme, such as horseradish peroxidase, that reacts with a substrate to produce a colored product
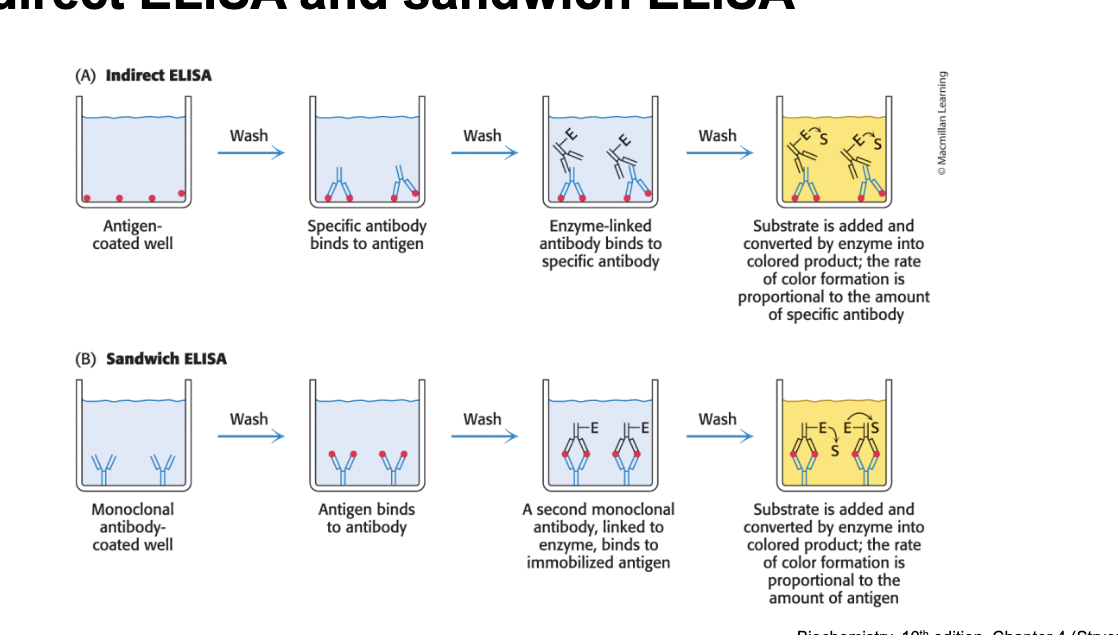
indirect ELISA and sandwich ELISA
indirect ELISA (antigen-antibody-antibody)
antigen coated well → wash → specific antibody binds to antigen → wash → enzyme-linked antibody binds to specific antibody → wash → substrate is added and converted by enzyme into colored product; the rate of color formation is proportional to the amount of specific antibody
sandwich ELISA (antibody-antigen-antibody)
monoclonal antibody coated well → wash → antigen binds to antibody → wash → second monoclonal antibody, linked to enzyme, binds to immobilized antigen → wash → substrate is added and converted by enzyme into colored product; rate of color formation is proportional to amount of antigen
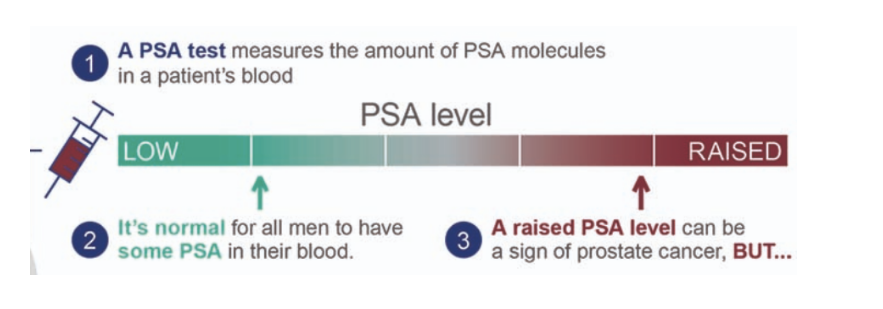
screening for prostate cancer with prostate specific antigen (PSA) test
prostate specific antigen (PSA) is a protein produced by the prostate and plays an important role in fertility
in prostate cancer, blood levels of PSA will increase
PSA test measures blood levels of PSA by ELISA
normal for all men to have some PSA in their blood
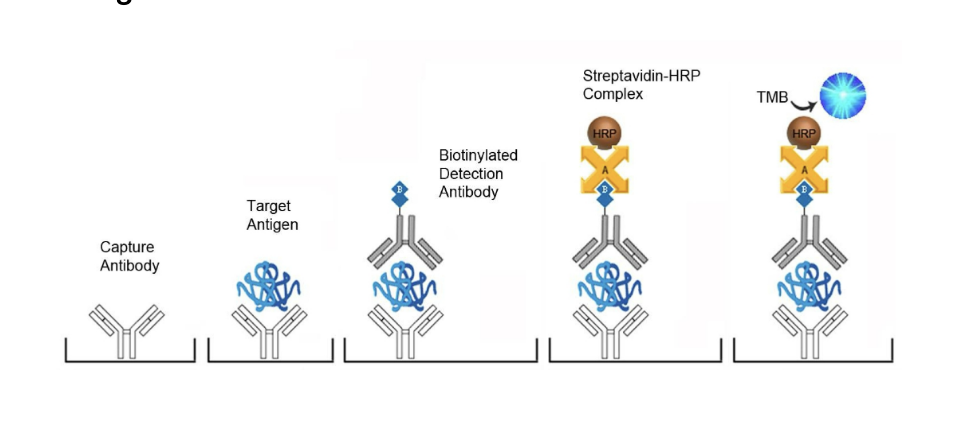
measuring blood PSA levels by ELISA
each well of the microtiter plate is pre-coated with a PSA-specific capture antibody
a biotin-conjugated detection antibody is then added which binds to the captured antigen
a streptavidin-horseradish peroxidase (HRP) conjugate is then added which binds to the biotin
a TMB (tetramethylbenzidine) substrate is then added which reacts with the HRP enzyme → resulting in color development (optical density is measured at 450 nm)
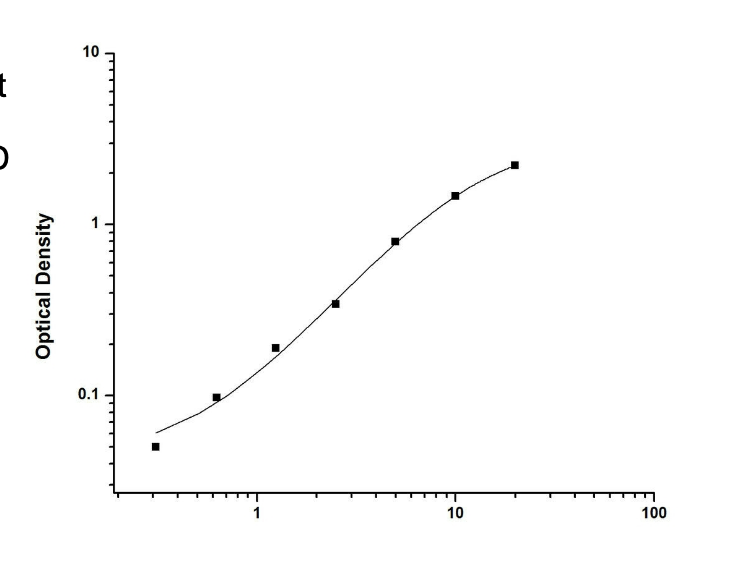
PSA levels are quantified using the standard curve from ELISA
the OD (optical density) of an individual patient sample is converted to PSA concentrations based on the OD of standards with concentration (standard curve)