Y10T3 HASS Test - Economics
1/20
Earn XP
Description and Tags
HOW TO DO INCOME TAX IN CASE YOU DONT GET IT: . . . . . . . . . . . . . . . . . . . . . . . . . . . . . . . . . . . .. . . . .. . . . . .. . . . .. . . . Go through every bracket and: If highest amount of money in the bracket is lower than your income (e.g., the bracket is 0-$18,200, and you make $20,000), you do: (highest amount of money in bracket) - (lowest amount of money in bracket). Then you times the answer by (tax rate) E.g., in the bracket 0-$18,200 at 0%: ((18200) - (0)) x 0% = (18200) x 0% = $0 paid in tax If the highest amount of money in the bracket is lower than your income (e.g., in the bracket $18,201 - $45,000, and you make $30,000), you do (your income) - (lowest amount of money in bracket). Then you times by taxrate. E.g., bracket is $18,201 - $45,000 at 20%, and you make $30,000. (30,000 - 18,200) x 20% (11,800) x 20% = $2360 paid in tax Add the amount you get from each bracket to get the total amount . . . . . . . . . . . . . . . . . . . . . . . . . . . . . . . . . . . .. . . . .. . . . . .. . . . .. . . . . . . . . . . . . . . . . . . . . . . . . . . . . . . . . . . . . . . .. . . . .. . . . . .. . (was gonna make this a flash card but it was wayyyy too long)
Name | Mastery | Learn | Test | Matching | Spaced | Call with Kai |
|---|
No analytics yet
Send a link to your students to track their progress
21 Terms
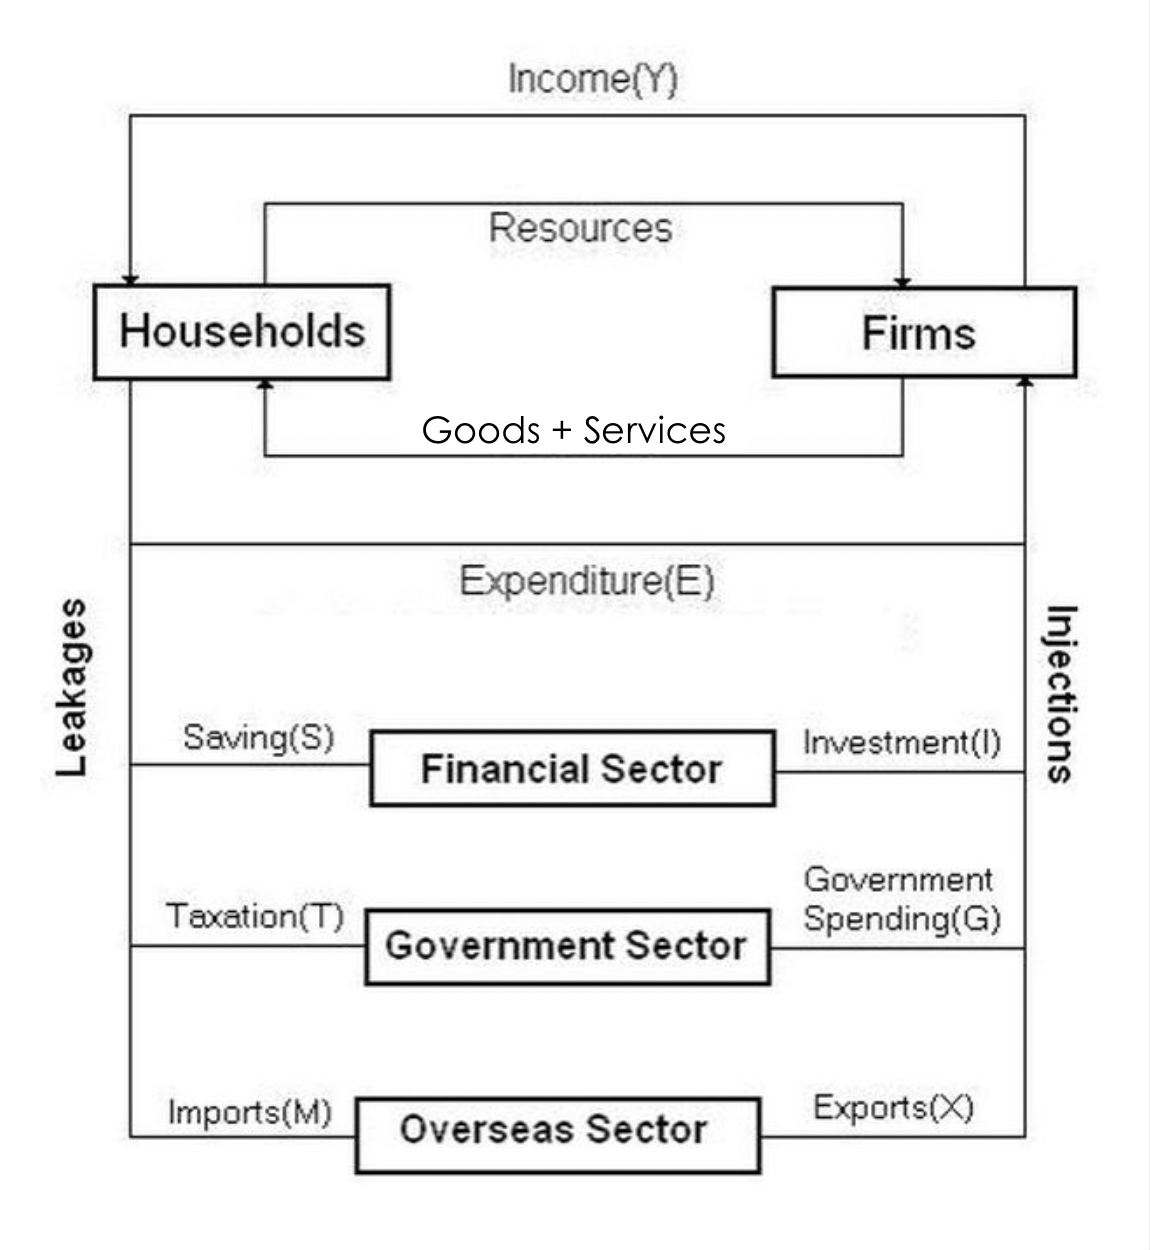
Circular Flow of Income Model

Income Tax
The tax placed on a person’s flow of money, which which is a percentage of it. This percentage increases as the amount of money a person makes increases. This comes from any source of money, such as from a salary/wage, property, rent, profit and dividends
How to calculate income tax (formulas)
If your income is bigger than the highest number in the bracket:
(highest number in bracket - lower number in bracket) x tax rate
if your income is between the smallest and biggest number in the bracket:
(income - smallest number in bracket) x tax rate
GST
Stands for Goods & Services Tax, and is a tax of 10% added onto the price of most goods and services (e.g., if a seller sells a product for $100, it would be sold for $110)
How to calculate the GST off a Total Price
(Price of product) / 11
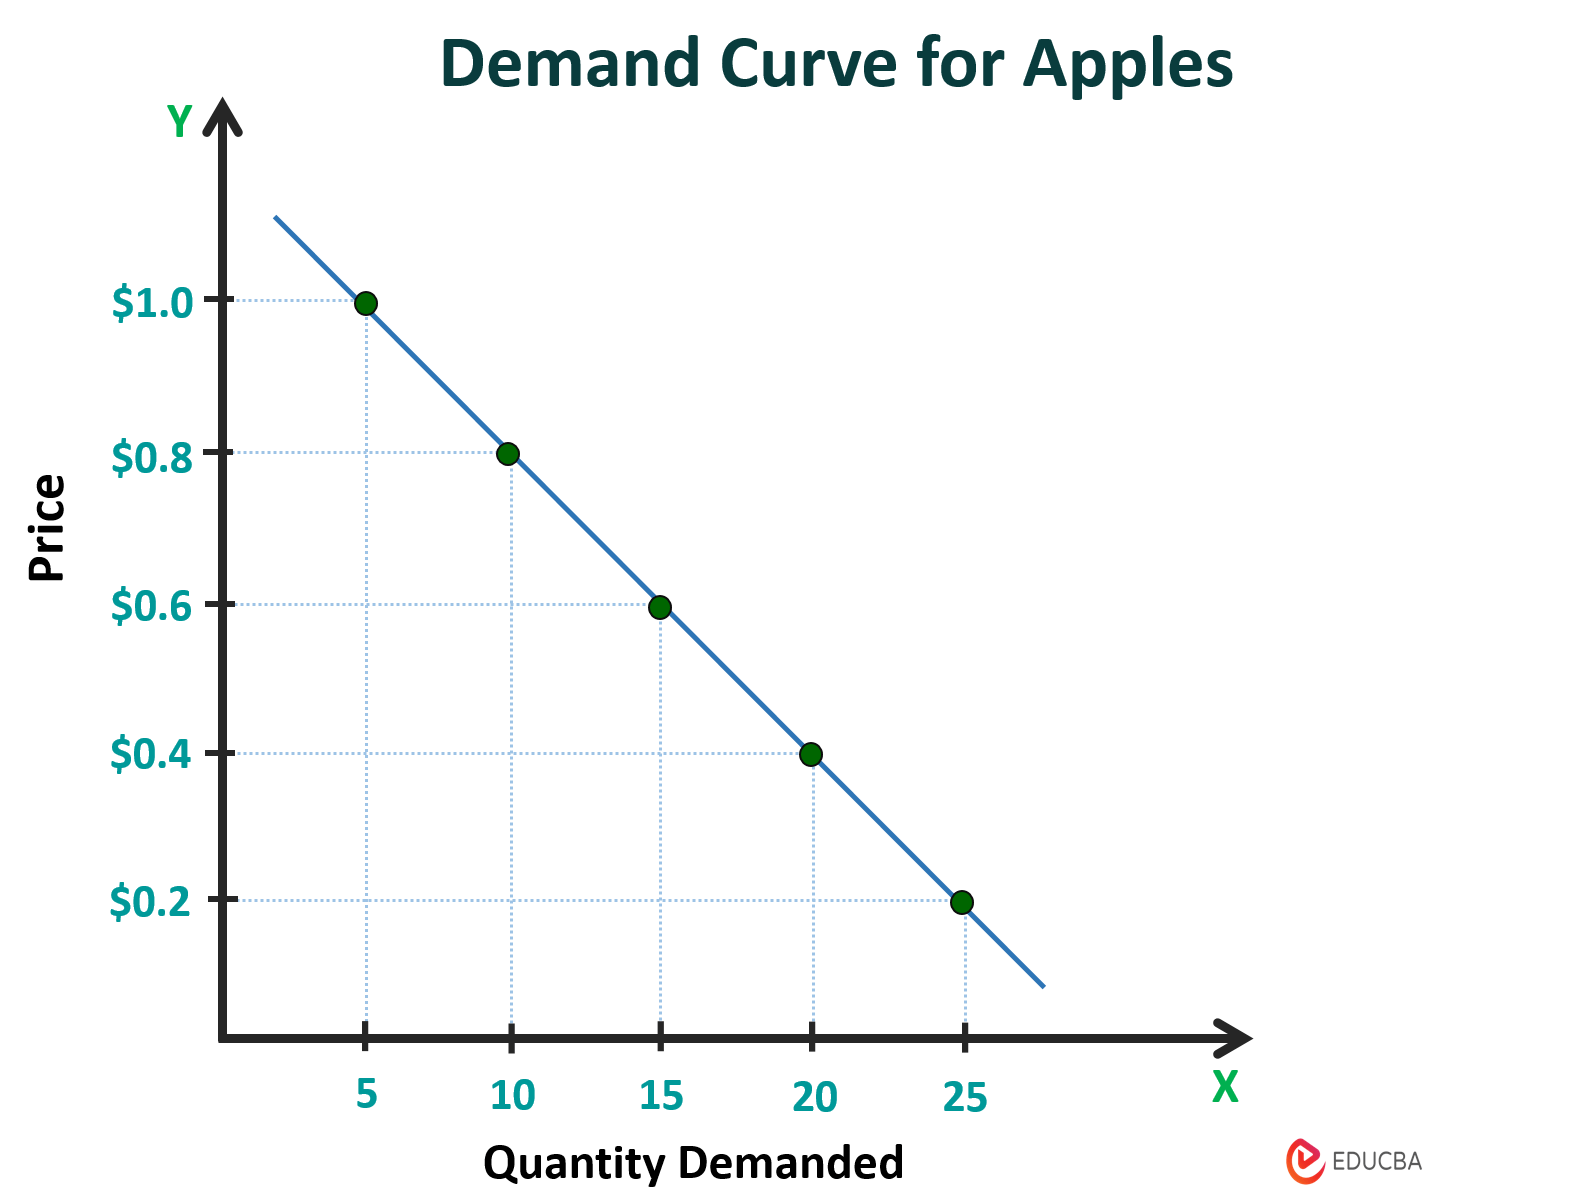
The Law of Demand
If everything stays the same, when the price of a product rises, the demand of a product falls. If the price falls, demand rises. Occurs as the lower the price is, consumers believe they are getting more value for a product or can actually afford it
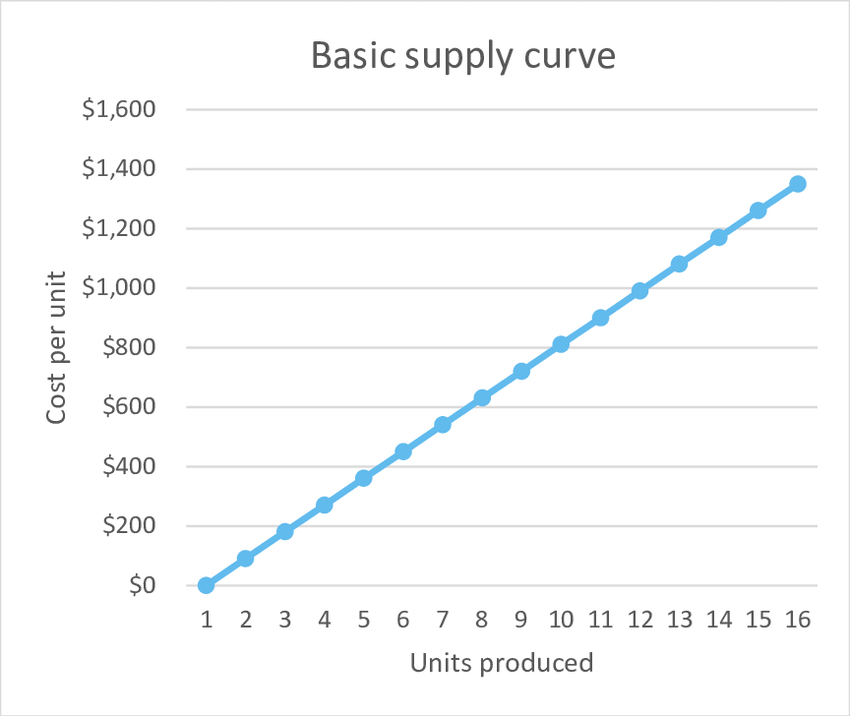
The Law of Supply
If everything stays the same, when the price of a product rise, the supply of a product rises. If the price falls, supply falls. Occurs as suppliers become more willing to supply products if they make more money
Requirements of a Graph
Must have:
Title
Axis Labels (horizontal line is always quantity, vertical always price)
Axis Units
Consistent Scale
Data
Demand Graph
As price lowers in the graph, the units demanded increases

Opportunity Cost
The next best alternative lost when you make a choice (e.g., choosing the buy 2 apples instead of 2 oranges)
Supply graph
As the price in the demand increases, the units supplied increases

Shifts in Demand
Occur when non-price factors affect the demand of the product, which causes the demand graph to shift inward/to the left when it decreases demand, or shift outward/to the right when it increases demand. Occurs as non-price factors change how willing consumers are to buy products at a certain price (whether it is to buy less products at the same price, or buy more products at the same price)
How Price vs Non-Price Factors affect a demand graph
Price increases/decreases demand, non price factors shift the graph inward/outward (or left/right)
Non Price Factors
Factors not to do with the price that affect the demand of a product, e.g:
Changes to disposable income (if people have more money to spend, they become more willing to buy and vise versa)
Changes to peoples tastes and interests (products or hobbies may go in or out of fashion)
Changes to interest rates (the more interest people are charged on credit, the less willing they may be to buy and vise versa)
Advertising/marketing campaigns (good advertisements/positive media increase demand, and vise versa)
Changes to the makeup of the population (e.g., if more of the population are elderly, things like walkers may increase in demand, while nappies may decrease)
Price of related goods (e.g., if light bulbs become more expensive, demand for lamps may decrease. e.g., 2, if price of coffee increases, demand for tea may increase)
Economic Inequality
The unequal distribution of income and opportunities between different group in society
Income and Wealth Inequality
The unequal proportions of flow of money and total amount of money between different groups in society
Causes of Income and Wealth Inequality
Living costs/prices continue to increase
Wages have yet to increase to follow suit
Property owners taking up too much property (resulting in wealth gap between property owners and those who don’t own property)
Factors that Influence a Consumer’s Decision to Buy [don’t really think we need]
Price (too low could make consumer suspicious, too high could make someone think it’s premium)
Availability of credit (how easy it is to borrow money)
Marketing (how well a product is marketed to the consumer)
Age + Gender (products may be marketed to specific age groups or genders)
Convenience (items that save time may be liked more)
Ethical and Environmental Considerations (items that are bad for environment or workers may be liked less)
Equilibrium
The point where supply and demand are equal, where the two graphs intersect
Injection
Points in the circular flow of income where money enters the economy
Leakage
Points in the circular flow of income where money leaves the economy