Experiment Errors
1/8
There's no tags or description
Looks like no tags are added yet.
Name | Mastery | Learn | Test | Matching | Spaced |
|---|
No study sessions yet.
9 Terms
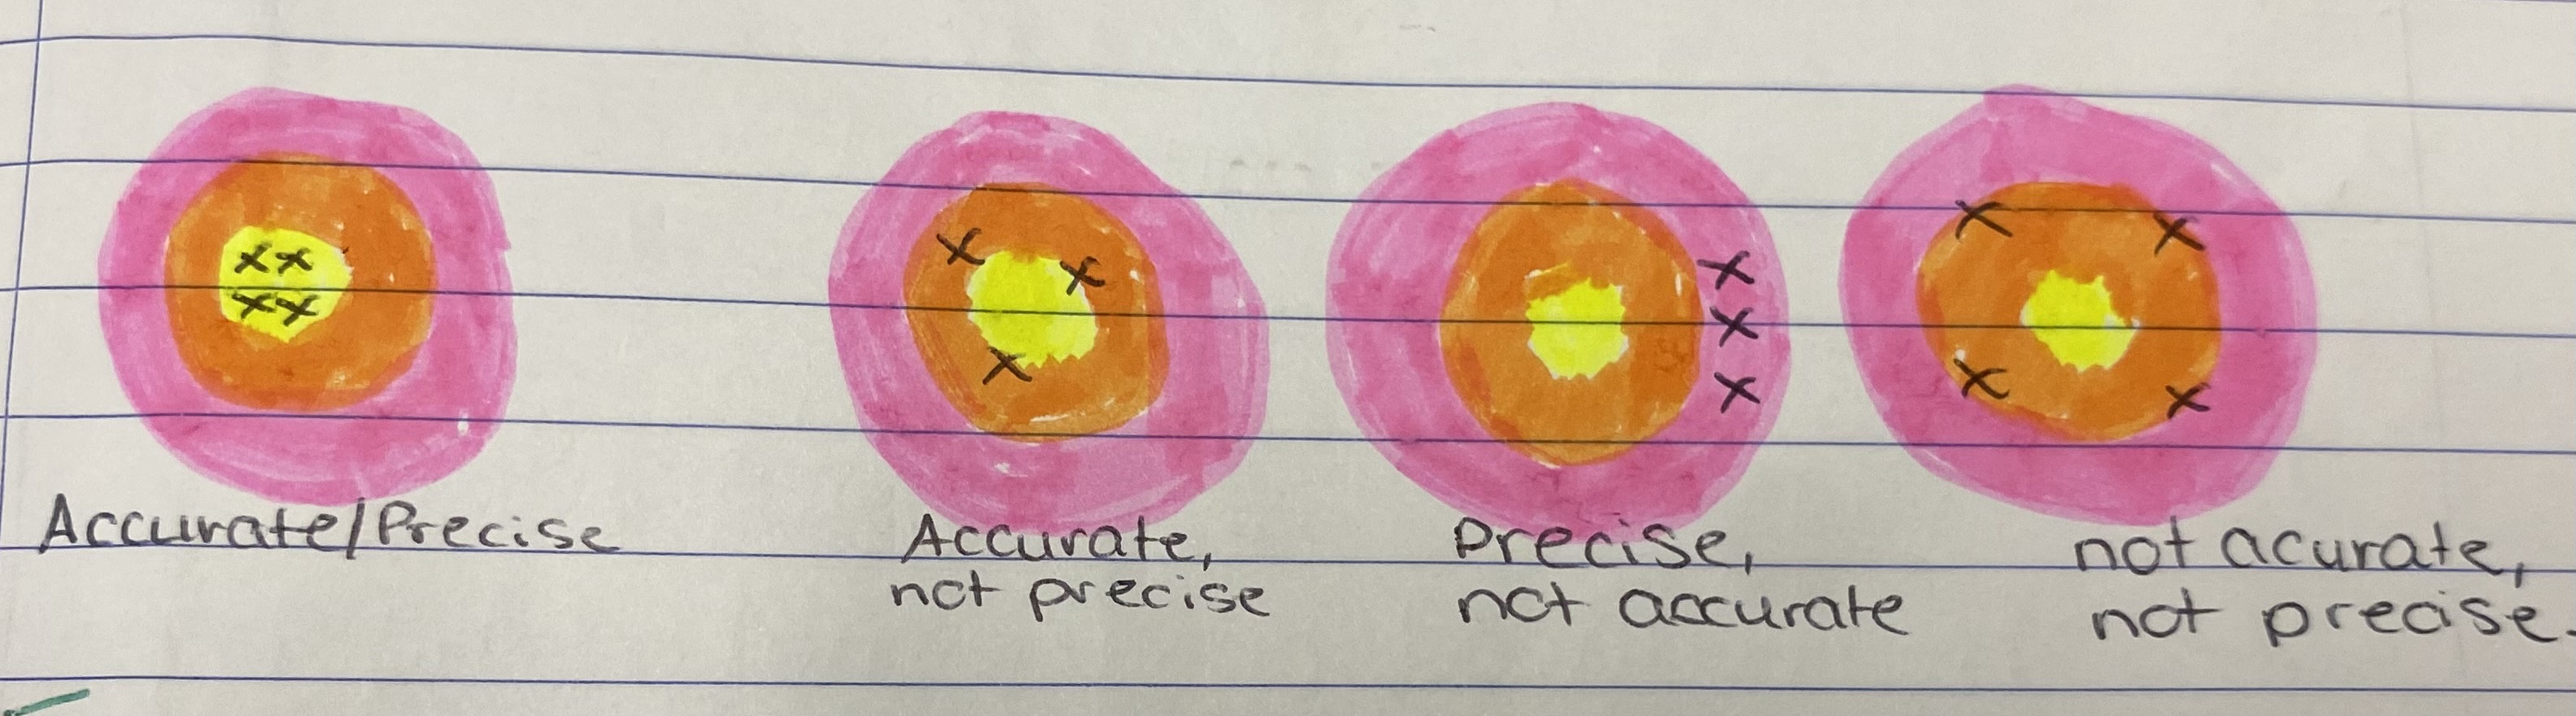
Accuracy and precision:
Precision is how close repeated measurements are to each other. Precise measurements are clustered closely together.
Accuracy is how close a measured value is to the true value of the quantity being measured. Accurate measurements are clustered around the correct value.
There are two types of error. Systematic error: three examples of systematic error-
Due to instrumentation : eg: incorrect calibration of an electric balance. Eg: an analogue anmetre may point to slightly below 0 when there is no current.
Due to person not using correct procedure: eg: parallax error.
Due to limitations in the design of the experiment: eg: measuring the temperature rise of water being heated by a coil- some heat will be lost in the environment.
Effects of systematic errors: ( 4 effects)
Can cause all measurements to be too high or too low.
Cannot be reduced or eliminated by repeated trials.
Reduced accuracy.
Do not necessarily affect permission.
How do reduce/ minimise systematic errors:
Ensuring correct calibration
Following the correct method of use of instrument
Taking measures to counteract or to allow for these errors
Random Errors- ( 2 examples of random errors)
Due to instrumentation: eg: electric balance can be effected by air currents high might give different air currents which might give different (slightly) readings each time. Eg: fluctuation of room temperature could affect how an instrument behaves.
Caused by a person making the measurement: eg: the person uses or reads the instrument slightly different each time. Eg: human reaction time could cause variations when stopping or starting a stopwatch.
Effects of random errors:
Unpredictable and inconsistent variations in the value of repeated measurements - some will be too high and others too low.
May not necessarily affect accuracy.
Will affect precision.
How can we reduce/ minimise random error?
Taking several measurements and getting an average ( ignore extreme values/ outliers)
Drawing a graph if possible.
Following the correct method of use of an instrument.
Percentage errors- True Vale known:
Error= true value - estimate
Percentage error= error/ true value (actual) x 100
Percentage error- true value not known:
Percentage error= estimate error/ measured value x 100
Estimate error= smallest division on the scale/ 2
Eg: a smallest division on a metre stick is 1mm so estimated error is 0.5mm or 0.0005m so all readings will be incorrect by + or - 0.005m.