Edexcel A-Level Geography - Regeneration
1/237
There's no tags or description
Looks like no tags are added yet.
Name | Mastery | Learn | Test | Matching | Spaced | Call with Kai |
|---|
No study sessions yet.
238 Terms
Economic Activity
Activity if making, providing, purchasing or selling goods or services
Employment Structure
How the workforce is divided up between the employment sectors
Economic Sector
Different sectors of the economy based on their role e.g. primary, secondary, tertiary, quaternary
Primary Sector
Low paid, manual work (agriculture, forestry, mining, fishing)
Secondary Sector
Low paid, manual work (manufacturing)
Tertiary Sector
Ranges from minimum wage to high paid professionals (retail, services, office work)
Quaternary Sector
Jobs in research, development and high tech industries (Scientific Research, ICT)
Full-time Employment
Where a person works a minimum number of hours defined as such by their employer
Part-time Employment
People who work fewer than 30 hours a week. Usually work rotational shifts
Temporary Employment
When you work for only a certain amount of time before your contract ends
Permanent Employment
Staff that work at a company until they decide to leave
Employed
People that work for a company
Self-employed
People who own their own company or work for themselves
UK Sector Employment as % (1841)
- 22% in the Primary Sector
- 36% worked in the Secondary Sector
- 33% in the Tertiary Sector
Quality of Life Indices
- Health
- Life Expectancy
- Levels of Education
Index of Multiple Deprivation (IMD)
Uses statistics of income, employment, health deprivation, disability, education, housing, crime and environment quality to produce an index reflecting the overall quality of life
UK Sector Employment as % (2011)
- 1% in the Primary Sector
- 9% in the Secondary Sector
- 81% in the Tertiary Sector
UK Employment number Figures (2015)
- 32 million workers
- 1.85 million (5.6%) unemployed
UK Contract number Figures (2015)
- 18.4 million people with Full-time contracts
- 9 million people with Part-time contracts (Growing Trend)
Rust Belt
Midwest USA
Deindustrialisation due to = shrinking industry, globalisation, automation, steel and coal decline
Detroit deprivation = 45/100000 murders in Detroit, over 8% unemployment, 50% decline in population since 1950
Political engagement
2001 election = 70% turnout of over 65s but 39% 18-24yrs
Scotland = 20% more interested in politics than London, more likely to vote (Possibly due to sentiment of change felt amoung many Scots for independence)
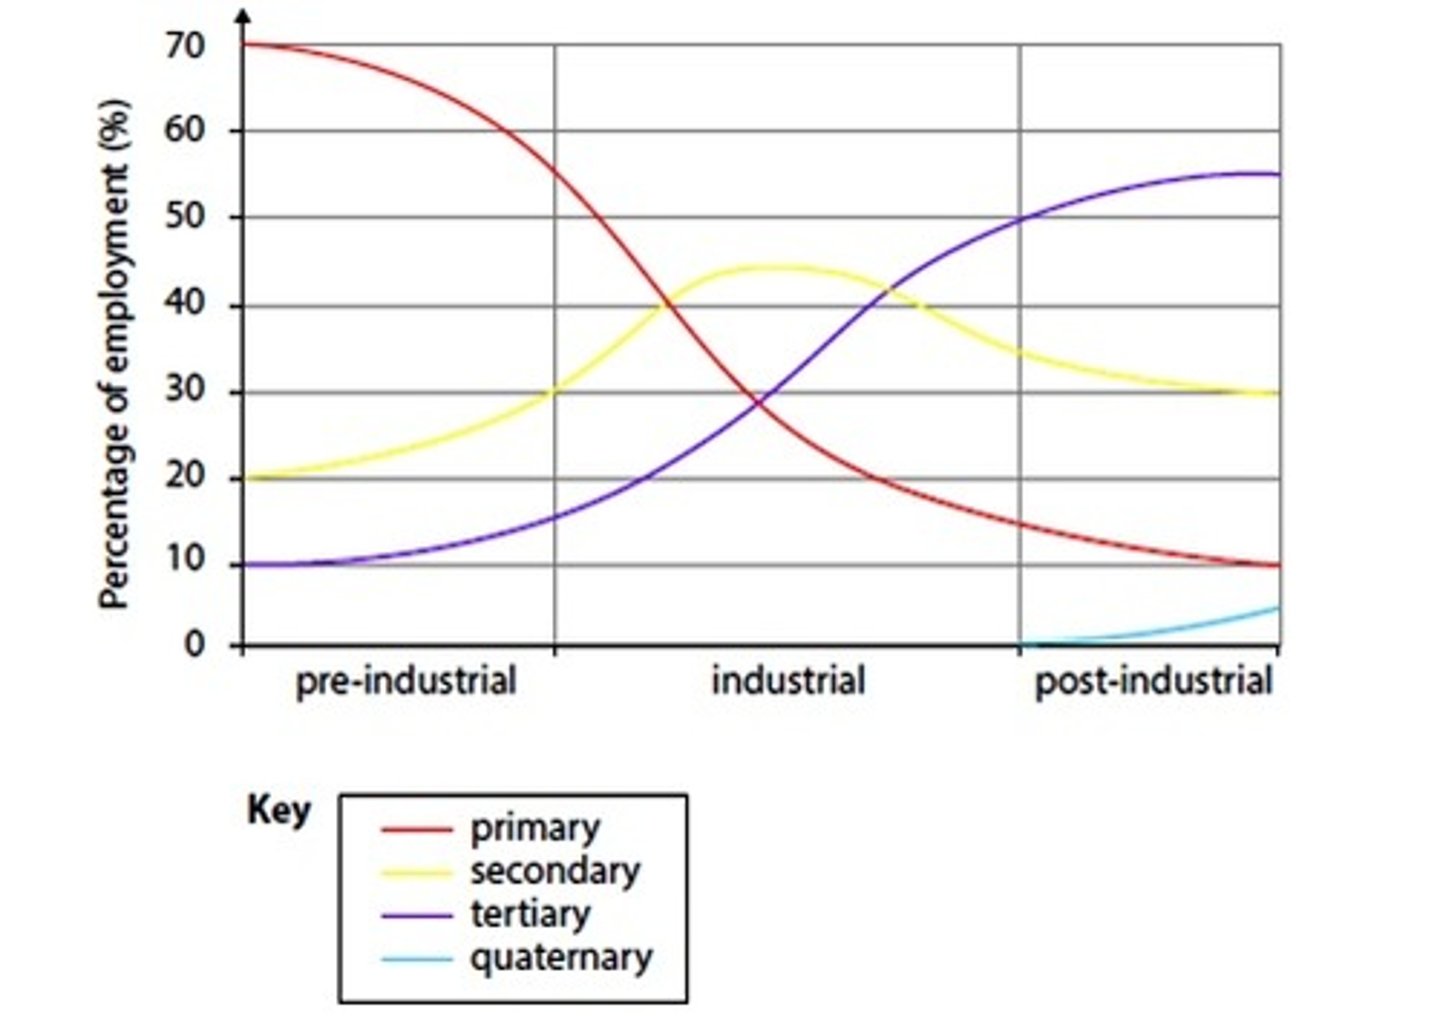
Clarke Fisher Model
Used to represent changes in employment during the 'pre-industrial', 'industrial' and 'post-industrial' periods.
UK Pre-industrial Stage
1450-1750
UK industrial Stage
1800-1960
UK Post-industrial Stage
1960-Present
UK Employment rate trends
- Employment rate fluctuates between 70% and 75%
- Employment dropped to an average of 64% during WW1 and WW2
- Dropped during 1980's religion
- Currently at a record high
Trends of Sectoral shares of Employment (UK)
Primary sector decreased from 14.3% in 1920 to 1.3% in 2016
Secondary sector decreased from 34.2% in 1920 to 15.1% in 2016
Tertiary sector increase from 51.5% in 1920 to 83.6% in 2016
Women's labour market participation (UK)
- Employment patterns changed during as a result of WW1 and WW2. A shift in attitude lead to equal opportunities
- 1914 = Only 23.6% of women in employment
- Post WW2 = 90% of women in employment
Changes in Full/Part-time employment (UK)
- Women increasingly switching from Part-time to Full-time employment. This is due to more women wanting to pursue careers
- However, women still dominate Part-time employment (87.3% in 1984, 73.3% in 2018)
Trends of Employees and Self-employed workers (UK)
- Number of employees rising relative to business cycle.
- Employees have a greater job security
- Self employed workers have also increased due to flexible work and technological advancements
Variations in economic activity and social implications - Health
Diet - fast food is cheaper than organic food, inner cities have easy access to it
Quality of housing - bad conditions, e.g. damp and mould growing; can't afford to repair
Access to healthcare
Variations in economic activity and social implications - Life Expectancy
Biological differences - female 82.9, male 79.2
Lifestyle choices - drinking, smoking, exercise - wealthier people have better diets and exercise
Variations in economic activity and social implications - Education
Children receiving free school meals do worse in school (working class white children)
Only 31% of 'Deprived Children' manage to achieve a grade 5 or higher in GCSEs
Reasons for Economic Differences (Middlesbrough vs Reading)
22.5% of people in Middlesbrough had no educational qualifications, versus 11.5% in Reading
19% had a University level qualification in Middlesbrough, but 43% in Reading
Reading Average weekly wage = £605
Middlesbrough Average weekly wage = £532
Factors impacting engagement
Age/Gender (Older people more engaged)
Ethnicity (participation increased in certain parts of UK)
Sense of membership
Influence
Residency time (longer = more engaged)
Deprivation (Inequality drives participation)
Attachment to a place
Sport (Hereford football team, Amir Khan boxer from Bolton)
Music (Liverpool = Beatles)
Cause of regeneration conflict
Inequality, ethnic tensions, lack of political engagement, rural/urban divide
Northern Powerhouse
Idea from former chancellor George Osbourne in 2014
Believed more economic/physical (HS2) connections would provide growth
Conflict between cities to which one would become the main economic hub
HS2
Part of Northern Powerhouse plan to build over 300 miles of high-speed railway to regenerate multiple regions of the UK
Positives = 25,000 jobs, greater connectedness for 30m people, £92bn benefit after construction
Conflicts = local people and environmentalists against plan, £56bn cost, concerns that it doesn't solve the issue of London-centricity
ONS
Office for National Statistics - responsible for holding/gathering a wide range of data on the UK
Place
Geographical space shaped by individuals/ communities over time
Regeneration
- Long-term upgrading of existing places
- Aims to tackle inequality
- Makes places more economically productive and socially acceptable
What are the four main place functions?
Administrative, commercial, retail, industrial
Administrative function information
Include council offices, schools and other public services like clinics and hospitals
What are processes?
The movement of people, capital, information and resources
What is rebranding?
Developments aimed at changing negative perceptions of a place making it more attractive to investment
What is re-imaging?
The process of making a place more attractive to live or visit and more desirable to invest in
What are the two aims of regeneration?
To tackle inequalities in either rural or urban areas
To make places more economically productive
Commercial function information
Offices of service industries such as legal services, accountants
Retail function information
Shops that range in size from small to malls
Industrial function information
Factories, warehouses and distribution centres
Gentrification changing functions of a place
When affluent people move into a location.
Planners may allow developers to upgrade a place's characteristics, residential and retail to deliberately attract people of a higher social status and income.
Age Structure changing functions of a place
Age Category (20-44)
Middlesbrough = 32%
Reading = 43%.
Suggests more young professional workers in Reading
Ethnic Composition changing functions of a place
Ethnic group make-up of a population.
In the UK the main groups are White, Asian and Black. Ethnicity is different from nationality.
Example of evidence of gentrification
Fletton Quays, Peterborough
How physical factors can change a place
Location and proximity to larger cities
Coastal erosion forcing change - residents leaving
Flooding/natural disasters requiring re-building
How accessibility and connections can change a place
Access to other places - by road (mainly motorways), rail, and air
Connections help competition for investment and visitors
New transport links, motorways, internet and broadband
How historical development can change a place
Post-production era - once the main employment sector, primary jobs (agriculture, farming, fishing) have been replaced by tertiary and quaternary jobs
Changes in consumer trends - retail has moved from corner shops to supermarkets to online shopping, house types: increased demand for single homes due to demographic and cultural trends
Increased affluence - increased leisure and tourism functions, so many houses and buildings have been converted, e.g. bar, B&Bs, and second homes
How local and national planning can change a place
Image causing government intervention, national government policies on restructuring the UK economy, trying to equalise the benefits and reduce the negative externalities of change
What are the four methods of measuring change?
- Land-use changes
- Employment trends
- Demographic changes
- Levels of deprivation
Media perception
Newspapers = Nationals favour London/SE
Estate agents = exaggerate positives
Tourism adverts = Promote positives
Blogs/forums = very negative view of local area/regeneration
How is the index of multiple deprivation used?
Used by central government and especially by local authorities to target regeneration aid, to allocate resources to places and people (e.g. areas with low average GCSE score) and target hotspots of crime
New York through media
Gossip girl = uptown residents look down on lower Manhatten (highlights wealth divide)
How i met your mother = Shows issues of loneliness of hard working graduates
Empire State of Mind = identifies uniqueness of New York
Deregulation
Conservatives did this in 1986 to enable FDI (Canary Wharf)
2008 crisis increased state regulations and control over financial centre
What makes Peterborough attractive?
- Great railway communications
- Availability of quality
- Relatively inexpensive land and labour
Why has the population of Peterborough increased?
- Inward migration
- Natural increase
By how much does Peterboroughs population grow per year?
2500 per annum
By how much has Peterborough's population grown since 1971?
110,000
By how much has Peterborough's output grown since 1971?
34%
By how much has Peterborough's employment grown since 1971?
45%
What was set up after the Peterborough Development Corporation ceased formal business?
Peterborough Development Agency was set up as a private sector to promote economic development
When was the Peterborough Development Corporation established?
1968
Role of Peterborough Development Corporation
Core objective to provide homes, work, facilities and services for an additional 70,000 people
Decrease in manufacturing employment in Peterborough
1971 - 34%
2015 - 15%
What did Peterborough adopt in July 2005?
A new development plan - plans to accommodate 22,000 homes, 18,000 jobs, 40,000 people by 2020
Why is Peterborough a cost effective location?
Proximity and ease of access to London
Property and land costs, gross weekly pay = below national average
What is Peterborough's largest employment 'sector'?
Distribution, transport, accommodation, food - 35,000 jobs, 29% of all employment
Migration into Peterborough
2001-2011: 24,166 people moved in
Central Europeans immigration Peterborough
2011 - 14,134 of the population were born in Central/Eastern Europe
What is studentification?
Refers to the process of social, environmental and economic change affected by large numbers of students invading particular areas of the cities and towns in which popular universities are located
Social achievements of London Docklands regeneration
New roads built (e.g. Limehouse Road Link) - improved commute quality and time
Many older people have moved out - often retiring to the Essex coast
Older residents replaced by younger population - 2011, average age of Newham was 31 (UK average is 40)
Large-scale immigration since 2000 has increased the East Ends ethnic composition - Newham is now London's most ethnically diverse borough
Economic achievements of London Docklands regeneration
New high rise buildings replaced docks and industry - stimulate quaternary industry
1980 - government introduced the Right to Buy scheme, which gave those living in council housing the right to buy it at a reduced price
Environmental achievements of London Docklands regeneration
Reduction in manufacturing since docks closed - less industrial pollution
Social problems of London Docklands regeneration
Gentrification has resulted in traditional communities being broken up
High deprivation in Tower Hamlets and Newham as these in poor health are unable to work and concentrated in what remains of low-cost social housing
Tower Hamlets had the lowest average life expectancy in London in 2012 - 77 years
Environmental problems of London Docklands regeneration
Improved infrastructure (e.g. London City Airport) increases pollution
Economic problems of London Docklands regeneration
Poverty is still present there - 27% of Newham's working population earned less than £7 an hour in 2012
Lower income people living in social housing have been moved out
Where is Sydney?
One of Australia's largest cities, southeast
Economic reasons Sydney is successful
With overseas owned banks and TNCs, it's the leading financial centre for the Asia-Pacific region, providing high waged, skilled jobs
Employment levels are generally high with above average incomes
2011 - over 450,000 businesses based in Sydney, these included half of Australia's top 500 companies
Social reasons Sydney is successful
Young economically active workforce - median age of 36 (UK is 41)
Low levels of multiple deprivation
Environmental reasons Sydney is successful
Attracts businesses partly because of it's beaches, harbour environment, and climate
What is the Rust Belt?
A region in northeast US that has experienced industrial decline economic decline, population loss, and urban decay
Reasons for decline in the Rust Belt
Globalisation and outsourcing of many industries to low-wage Asian countries (global shift)
High paying manufacturing jobs, notably in the car industry, vanished and the workers went with them
Detroit population loss
1950 - 1.8 million
2013 - 700,000
Detroit unemployment
Unemployment rate peaked in 2009 at 28%
Detroit house prices
2009 - average house price was $7500
Illiteracy in Detroit
2011 - 47%
Schools closing Detroit
Since 2005, over 100 schools closed
Detroit crime
Crime capital of America - 7 out of 10 crimes unsolved
Detroit Ethnicity
82% black
8% white
7% Hispanic
1% Asian
2% mixed
Why is Detroit dominated by Black African Americans?
They are the lowest income group left behind when other groups - generally more skilled and better educated - have migrated from Detroit as it has declined