DAPR 1 sem
0.0(0)
Card Sorting
1/161
There's no tags or description
Looks like no tags are added yet.
Study Analytics
Name | Mastery | Learn | Test | Matching | Spaced |
|---|
No study sessions yet.
162 Terms
1
New cards
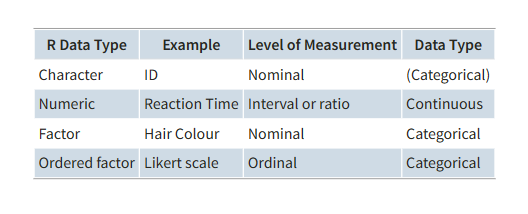
categorical data types
nominal, ordinal and binary
2
New cards
numeric data types
interval or ratio, continuous, discrete(count)
3
New cards
what is categorical data
variables with a discrete number of response options (usually written answer)
4
New cards
what is numeric data
variables which can take any real number value within the specified range of measurement (eg height in cm)
5
New cards
what is count data
variables which can only take non-negative integer values (0,1,2,3)
6
New cards
what are the four levels of measurement
nominal, ordinal, interval and ratio
7
New cards
what is nominal data
binary or categorical variable where the numerical markers share no relationship. no meaningful order. eg 1= brown 2= blonde, this doesnt suggest brown is better than blonde
8
New cards
what is ordinal data
binary or categorical variable where there is a meaningful way to rank order responses. you can say one is greater than the other, however cannot meaningfullt quantify the differences. eg - likert scale (agree, strongly agree)
9
New cards
what is interval data
variables where the numerical value have meaning but there is no true 0 point, can consider differences. eg - IQ
10
New cards
what is ratio data
variables where the numerical value have meaning and there is a true 0 point, can multiply and divide variables and legitimately talk about double X. eg - degrees kelvin.
11
New cards
data types key in R
12
New cards
what is frequency distribution
a plot showing the number of instances of each value of a variable
13
New cards
what are bar plots used for
used to show frequency distributions of categorical variables. x axis - values of variable. y axis - frequency
14
New cards
what is the central tendency
a set of statistics that describe the central point of frequency distributions. typically known as averages
15
New cards
what is dispersion
a set of statistics that describe the variation of frequency distributions
16
New cards
what central tendency and variability to use for nominal data
mode and relative frequency
17
New cards
what central tendency and variability to use for ordinal data
mode or median and range or inter-quartile range
18
New cards
what does a frequency table show
possible outcomes and count of number of observations per outcome
19
New cards
what is mode
mode is the most commonly observed value in the data set
20
New cards
what is median
the value for which half the data falls above and half below the given value. to calculate - rank order the data, find middle value
21
New cards
what is range
the value between two points, max-min
22
New cards
inter-quartile range (IQR)
the difference between first and third quartile. steps - rank data, split into four equal clocks, iqr is diff between 25% and 75%
23
New cards
what data is a histogram used for
continuous data
24
New cards
how to label x and y axis of histogram
x - possible values of a variable (height) y - frequency of a given value occurring
25
New cards
what are bins in a histogram
the number of columns
26
New cards
what is the optimal measure for continuous data
mean (sum of all values, divided by total number of observations)
27
New cards
what is the sum of deviations and what will it always equal
the amount each observation differs from the mean, will always be 0 and positives and negatives cancel eachother out
28
New cards
what is variance
the average squared deviation from the mean. σ(^2)
29
New cards
what is standard deviation
the square root of the variance
30
New cards
what central tendency do you use for categorical (nominal) data?
mode (+frequency table)
31
New cards
what central tendency do you use for categorical (ordered) data?
mode or median (+range)
32
New cards
what central tendency do you use for continuous data?
mean (+variance and sd)
33
New cards
what central tendency do you use for count data?
mode (+range so variance and standard deviation)
34
New cards
skew
measure of the asymmetry of a distribution
35
New cards
kurtosis
measure of the flatness of the peak, and fatness of tails of the distribution
36
New cards
what is a dependent variable?
the thing we want to predict, referred to as the outcome, and y in stats
37
New cards
what is an independent variable?
the things we hypothesize to influence the dependent variable, the explantory varible, and x in stats
38
New cards
what is a covariate?
things that will influence the outcome but we may not have a hypothesis about, also known as nuisance variables we try to control them to minimise their effect
39
New cards
when trying to describe two categorical variables what do we use?
contingency table
40
New cards
what does a contingency table show?
shows the frequency of one level within levels of the other
41
New cards
what do we use mosaic plot for?
to visualize a contingency table (categorical-categorical data)
42
New cards
how do we examine relationship between categorical and continuous data?
we look at stats (mean, sd, distribution shape) of the continuous variable at each level of categorical variable
43
New cards
what does group_by do
splits the data by the categorical variable data
44
New cards
what does facet_wrap do?
produces a plot per value of the variable given
45
New cards
how do we visualise continous-continous data?
scatterplots
46
New cards
scatterplot going from left to top right?
positive relationship
47
New cards
scatterplot going from top left to bottom right?
negative relationship
48
New cards
what is covariance?
the numerical value that represents the degree to which variables vary in the same way.
49
New cards
what does a function do?
takes an input, does something, provides an output
50
New cards
what does a linear function look like when plotted?
straight line
51
New cards
what do non-linear functions contain?
powers or roots
52
New cards
what are the uses of functions?
for data transformations and describing formal models
53
New cards
what is standardising?
putting all variables into the same scale to compare them
54
New cards
what is a standardised variable referred to as?
z-score
55
New cards
eg of standard way to interpret z score?
if z score is 1.2 this means respondent is 1.2 SD above the mean
56
New cards
what is the purpose of probability?
to help make inferences about the truth of the world from data we have
57
New cards
what is probability?
the likelihood of an events occurrence
58
New cards
probability formula
P(X) = (a)/(a+b) where a = ways event x can occur and b = ways event x can fail to occur
59
New cards
what is a set?
a well-defined collection of objects, composed of elements
60
New cards
what does x ∈ A mean
x is an element of set A
61
New cards
what does x ∉ A mean
x is not an element of set A
62
New cards
what does B ⊆ A mean
B is a subset of A
63
New cards
what does B ⊂ A mean
B is a proper subset of A (at least one element of A is not a member of B)
64
New cards
what does A ⊄ B mean
A is not a subset of B
65
New cards
in probability, what is a union?
an object is a member of either set A or B A⋃B
66
New cards
in probability, what is an intersection
an object is a member of set A and set B A⋂B
67
New cards
in probability, what is difference
when an object is a member of set A but not set B A-B
68
New cards
in probability, what is an empty set
when set A and B are mutually exclusive, when A occurs B cannot occur A⋂B = ∅
69
New cards
what is sample space
all the possible outcomes of a random experiment
70
New cards
what is the compliment of set A
the probability of not A
71
New cards
mutually exclusive events
if A occurs B cannot occur
72
New cards
independent events
the occurance of A does not impact B
73
New cards
dependent events
the occurance of event A does impact B, therefore changing the probability of event B
74
New cards
sampling with replacement
replacing the item sampled so that sample number stays the same
75
New cards
sampling without replacement
not replacing used sample meaning number of sample gradually decreases
76
New cards
conditional probability
probability of B given A p(B|A)
77
New cards
three features of statistical experiment
more than one possible outcome, outcomes specified in advance, each outcome has probability
78
New cards
random experiment
sampling simple events from a sample space, to produce an outcome
79
New cards
random variable
set of values that quantify the outcome of the random experiment
80
New cards
discrete random variable
can assume only a finite number of values
81
New cards
continuous random variable
arbritarily precise, can take all infinite values in a range
82
New cards
cumulative distribution function
provides an easy way to see the total probability of all values before or after a given point
83
New cards
continuous probability distribution
a random variable that produces a continuous set of outcomes
84
New cards
when is the probability density function used (PDF)
when describing continuous probability distributions
85
New cards
what is the mean and SD in a standard normal distribution
mean μ=0 and SD σ=1
86
New cards
what happens when you adjust μ (mean) in the probability density function (PDF)
the curve shifts left or right
87
New cards
what happens when you adjust σ (SD) in the probability density function (PDF)
the curve changes shape
88
New cards
where should 68% of the area of a normal distribution fall
1 SD either side of mean
89
New cards
where should 95% of the area of a normal distribution fall
2 SD either side of the mean
90
New cards
where should 99.75% of the area of a normal distribution fall
3 SD either side of the mean
91
New cards
what does a z score do?
standardise the values of x
92
New cards
what is the z score formula?
Z=(x−μ)/σ
numerator - converts x to deviations from mean
denominator - scales values based on spread in data (SD)
numerator - converts x to deviations from mean
denominator - scales values based on spread in data (SD)
93
New cards
difference from standard normal and t distribution
standard normal - uses σ which is actual population value, t - uses sd which is an estimate
curve difference - tails of t are higher due to variability/uncertainty from sd estimate
curve difference - tails of t are higher due to variability/uncertainty from sd estimate
94
New cards
what is a population
a group of people whom youd like to make inferences abouts
95
New cards
sample
a subset from the population whom you will collect data on to make inferences
96
New cards
what is a population parameter
a measure that describes the entire population
97
New cards
what is a sample parameter
a proportion of our sample which have identified characteristics
98
New cards
what is sampling distribution
a probability distribution of some statistic obtained from repeatedly sampling the population
99
New cards
what is a benefit of having a large sample
our estimates from those samples are likely to be closer to the population value
100
New cards
what is the formula for standard error (SE)
### **SE=(σ)/√N**