econ final with graphs and charts
1/36
There's no tags or description
Looks like no tags are added yet.
Name | Mastery | Learn | Test | Matching | Spaced |
|---|
No study sessions yet.
37 Terms
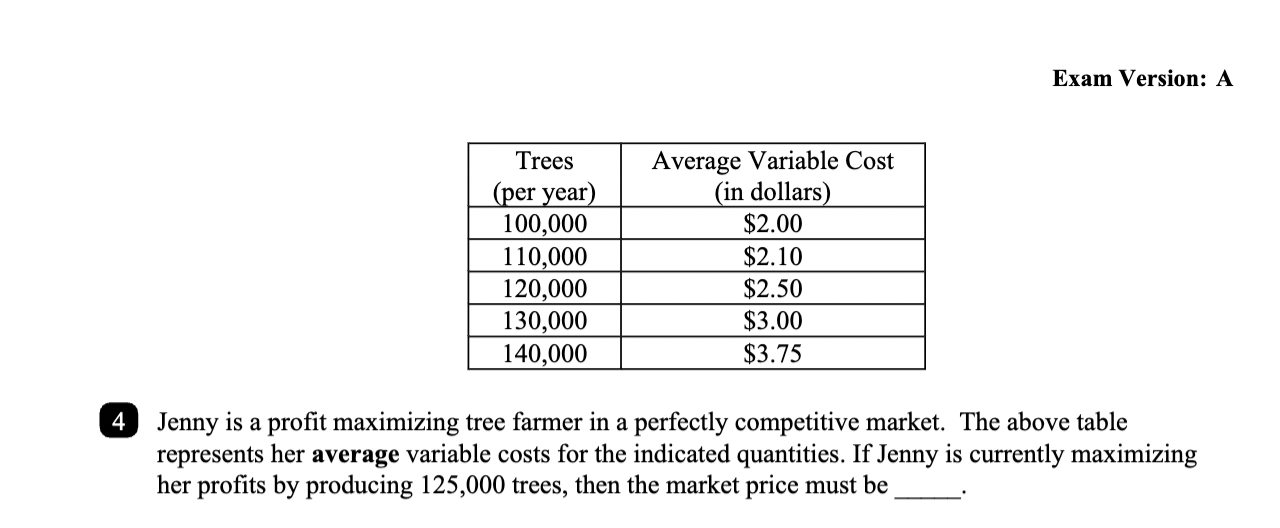
Jenny is a profit maximizing tree farmer in a perfectly competitive market. The above table
represents her average variable costs for the indicated quantities. If Jenny is currently maximizing
her profits by producing 125,000 trees, then the market price must be:
2.75
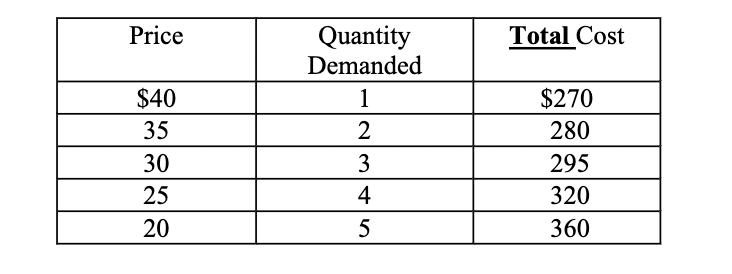
The above table provides some data for a monopoly firm. What is the profit maximizing point of
production for this firm? Assume that the firm can only produce and sell whole units (discrete case)
3

The average total curves for plant 0 (ATC0) and plant 1 (ATC1) are showin in teh figure
above. The long-run average cost curve goes through points
A,B,D,G
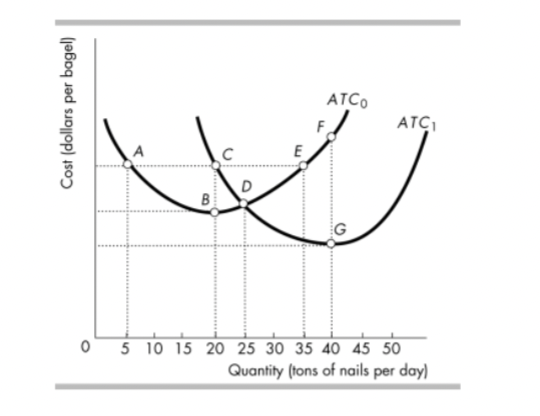
If this represents the full long run ATC curve, what point represents the minimum efficient scale for this firm?
G

From the diagram above depicting the short-run cost curves of a typical curve, curve A
represents
marginal cost curve
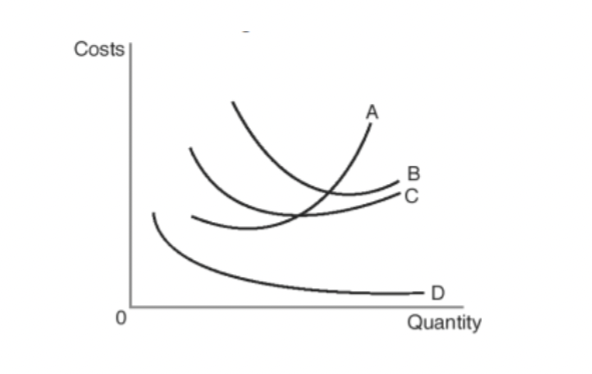
Curve C represents the
average variable cost curve

what is the value at C
24

what is the value at b
106
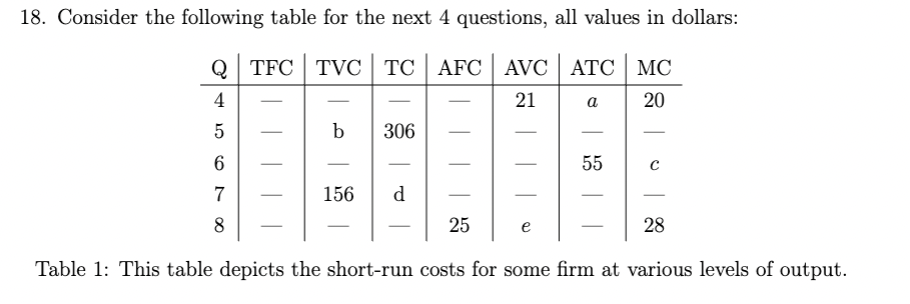
what is the value at a
71

what is the value at e
23
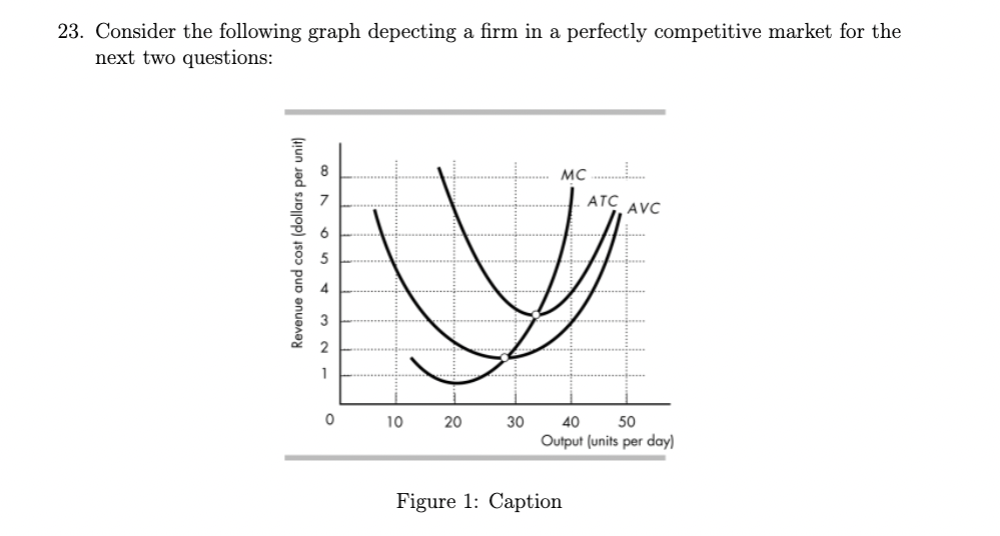
if the price is $7, how much is the firm’s profit?
120

If the price were to suddenly shift to $2.50, should the firm shut down in this period
No because the firm is able to cover its variable costs
Zero Sum
Cooperation/Stag Hare
Bach or Stravinsky/Battle of the Sexes
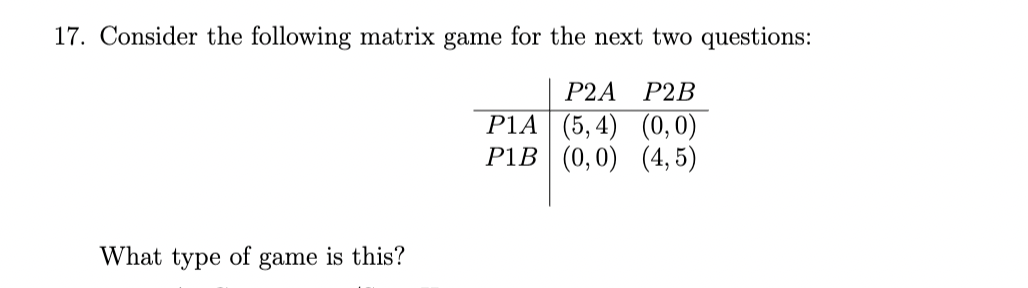
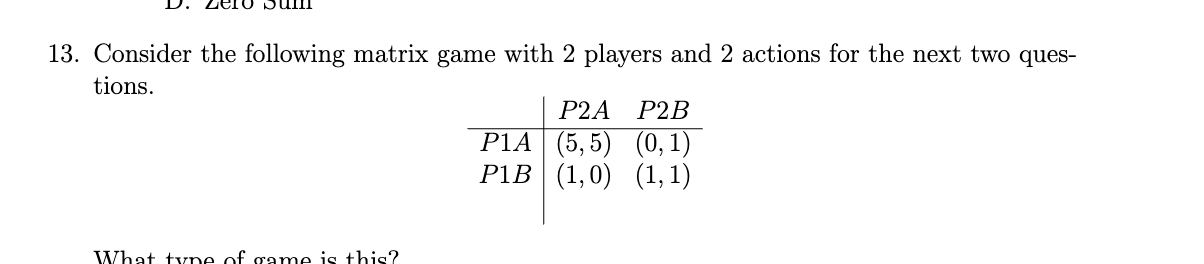
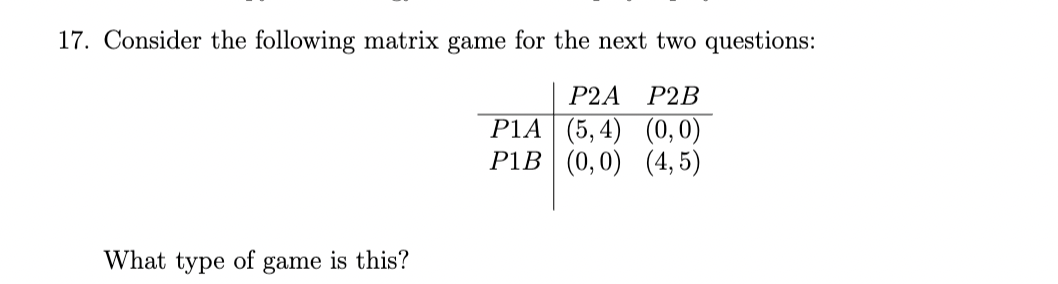
Find all Nash Equilibria (if they exist
P1A,P2A and P1B, P2B
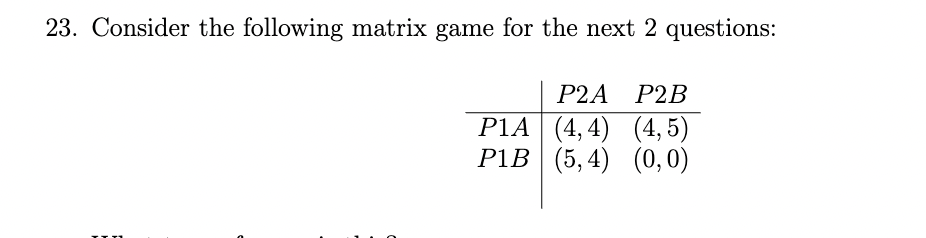
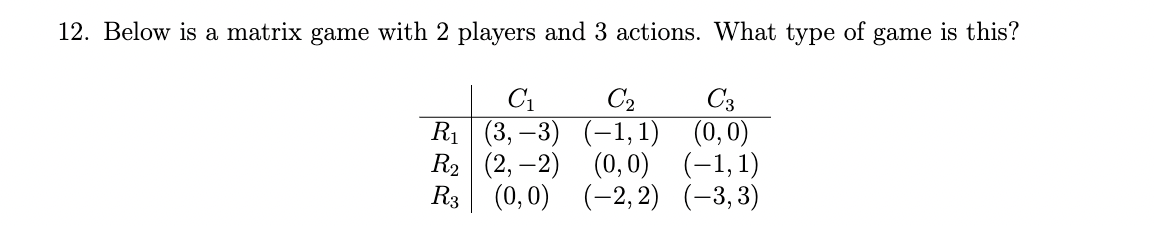
What type of game is this
Volunteer Dilemma

Find all Nash Equilibria (if they exist)
P1A, P2B, and P1B, P2A
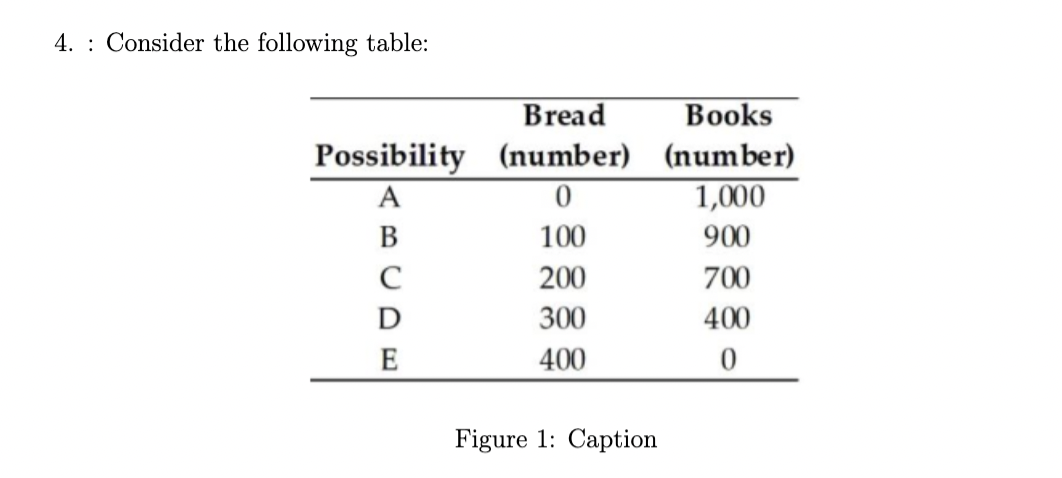
The table above shows the production possibilities for an economy. When the economy
produces a combination of 900 books and 50 loaves of bread
production efficiency is not achieved
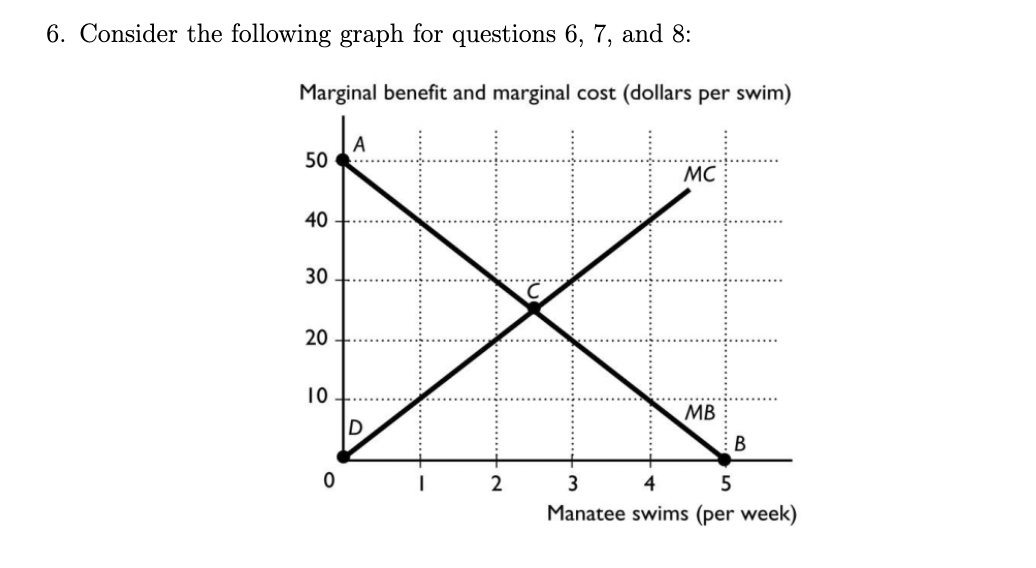
Calculate the total surplus if the economy produces 2 manatee swims per week:
$60

Calculate the total surplus if the economy produces at its allocative efficient point:
$62.5

Calculate the consumer surplus if the economy produces at its allocative efficient point:
31.25

What is the total surplus at the allocative efficient point?
7,500,000
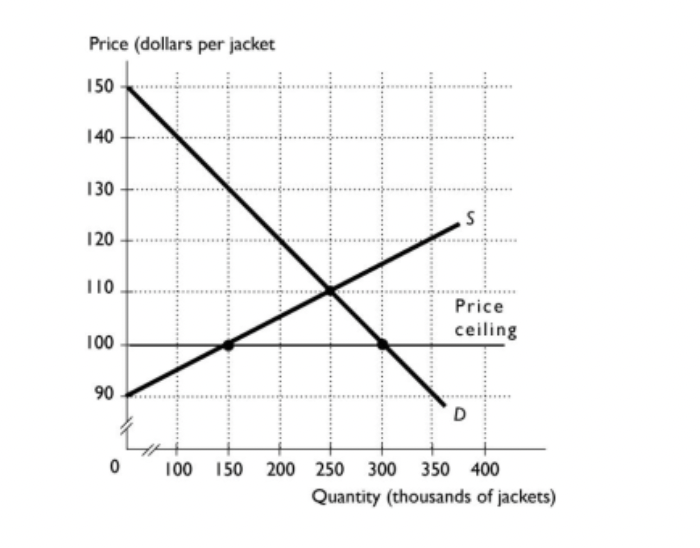
What is the total surplus with no search costs if the price ceiling displayed is imple-
mented?
6,750,000

What is the amount of surplus that could potentially be lost to search costs?
4,500,000

Which area(s) represent the surplus potentially lost to search costs?
B
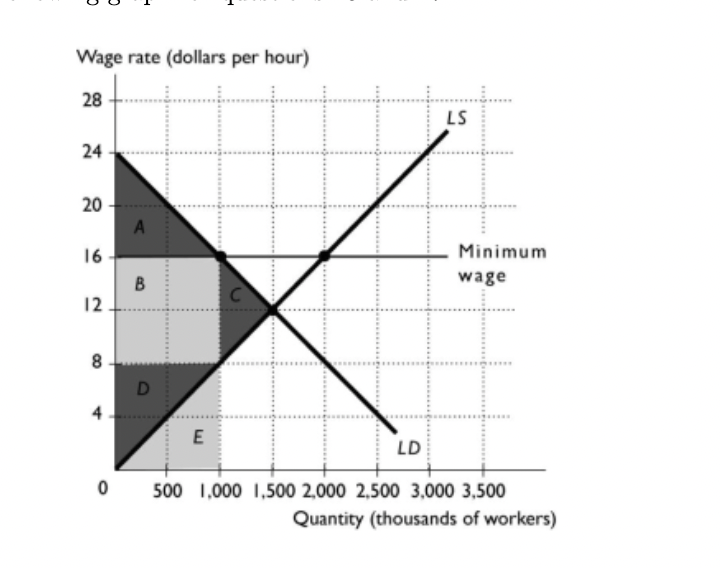
Which areas represent the total surplus when the minimum wage is implemented here?
A + B + D
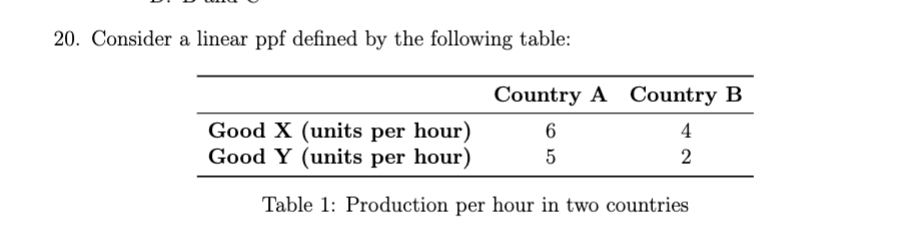
Country ____ has a comparative advantage in producing good X. Country_____ has an absolute advantage in producing good X
B,A

The given figure shows the market for tires. The figure shows that the government has
imposed a tax of ____ per tier and that _____ pay most of the tax
30 bucks- sellers

What is the value of tax revenue generated?
600 million
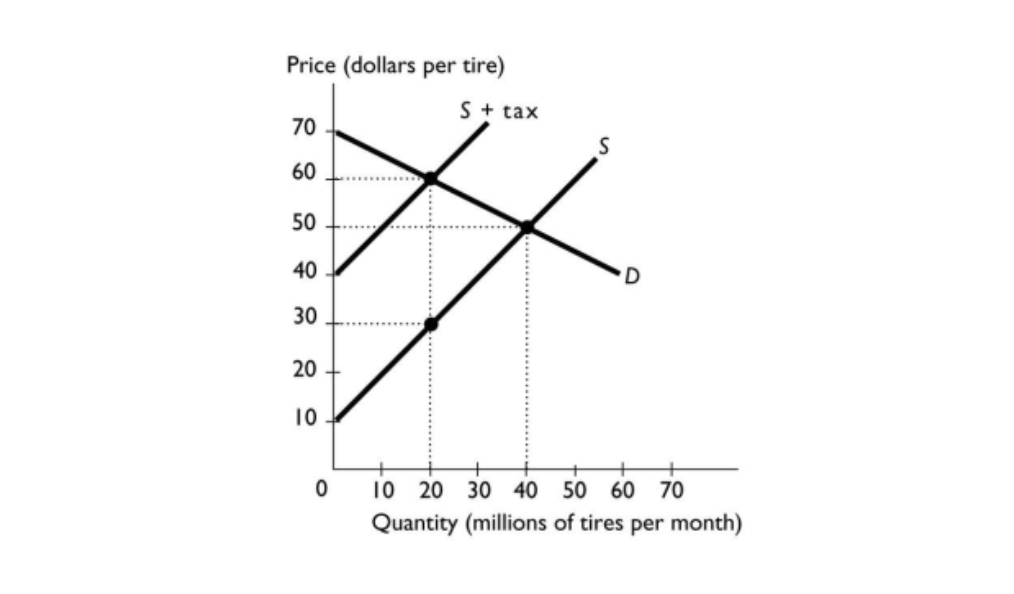
What is the value of the deadweight loss generated?
300 million
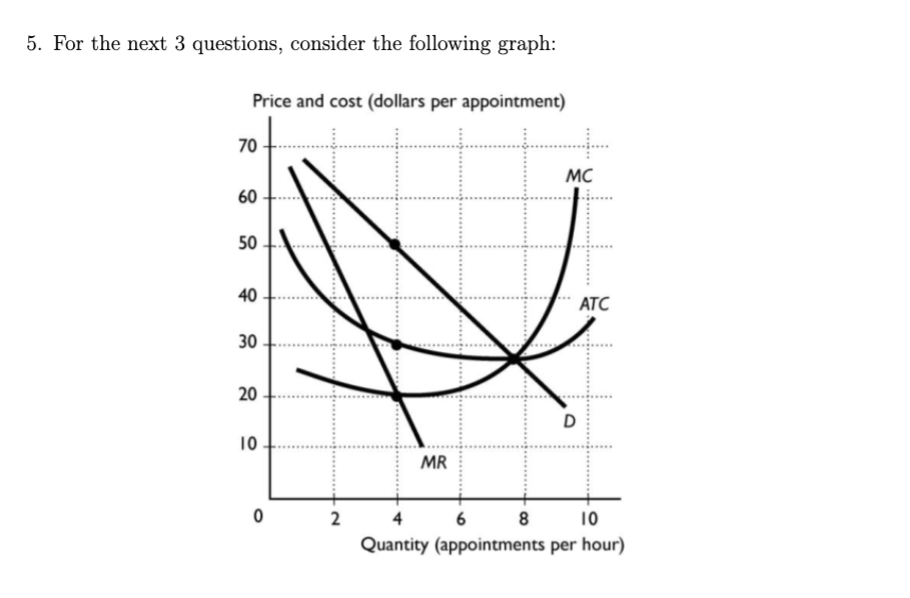
The graph represents the market for veterinary services in a small town, Cyberia. Lain is the only veterinarian in this town. Lain will treat ___ animals per hour, and charge ___
per customer
4 / $50

In an unregulated monopoly, Lain earns how much economic profit?
80 per hour

The government of Cyberia is wary of the control Lain has on the veterinary industry.
After some debate, two local politicians, Alice and Mika, propose marginal cost pricing
and average cost pricing regulation respectively. Which price regulation scheme should
Cyberia choose to minimize deadweight loss while also not incentivizing Lain to leave
town
Either policy because both achieve an efficient outcome

What is the area that represents a single price monopoly’s total revenue?
C + D + F + G + I
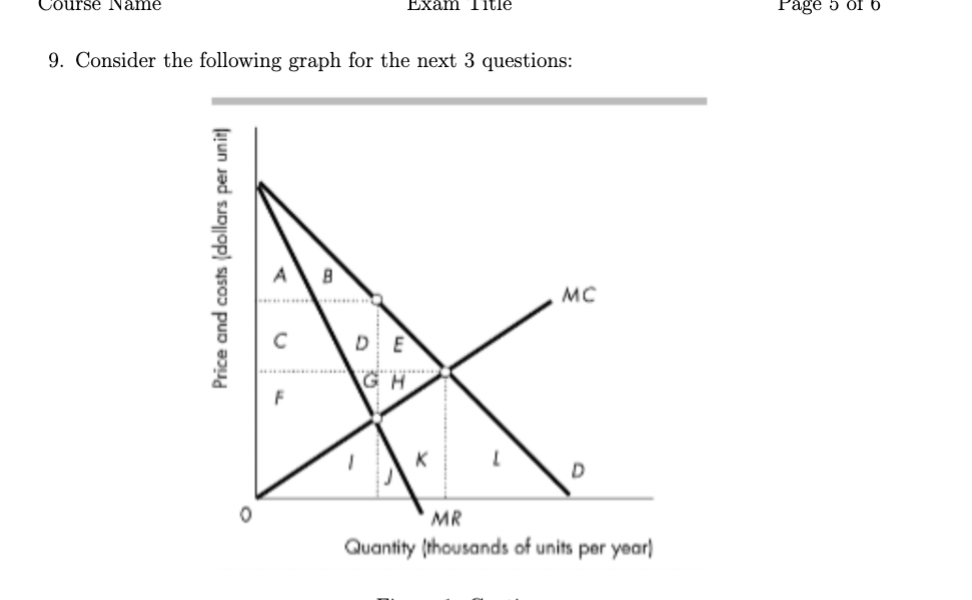
10. What is the area that represents the consumer surplus when facing a single price monopoly?
A + B

What is the area that represents a perfect price discrimination monopoly’s producer
surplus
A + B + C + D + E + F + G + H